. 2024 Jun 6;32(6):662-678.e8.
doi: 10.1016/j.str.2024.02.015. Epub 2024 Mar 19.

DNAJB8 oligomerization is mediated by an aromatic-rich motif that is dispensable for substrate activity

Affiliations

DNAJB8 oligomerization is mediated by an aromatic-rich motif that is dispensable for substrate activity

Bryan D Ryder et al. Structure. .

Abstract

J-domain protein (JDP) molecular chaperones have emerged as central players that maintain a healthy proteome. The diverse members of the JDP family function as monomers/dimers and a small subset assemble into micron-sized oligomers. The oligomeric JDP members have eluded structural characterization due to their low-complexity, intrinsically disordered middle domains. This in turn, obscures the biological significance of these larger oligomers in protein folding processes. Here, we identified a short, aromatic motif within DNAJB8 that drives self-assembly through π-π stacking and determined its X-ray structure. We show that mutations in the motif disrupt DNAJB8 oligomerization in vitro and in cells. DNAJB8 variants that are unable to assemble bind to misfolded tau seeds more specifically and retain capacity to reduce protein aggregation in vitro and in cells. We propose a new model for DNAJB8 function in which the sequences in the low-complexity domains play distinct roles in assembly and substrate activity.

Keywords: Alzheimer‘s disease; DNAJB6; DNAJB8; J-domain proteins; LARKS; chaperone; neurodegeneration; polyQ; proteostasis; tau.


Conflict of interest statement

Declaration of interests The authors declare no competing interests.

Figures
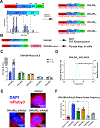
Figure 1.
Figure 1.. Phenylalanine residues in the S/T-rich domain drive self-assembly.
(A) DNAJB8 is colored by domain: JD (red), G/F-rich (blue), S/T-rich (cyan), and CTD (green). A histogram of the density distribution of phenylalanines in the DnaJB8 sequence. The disordered domains were divided into 4 segments, S1-S4 (herein DNAJB8S1, DNAJB8S2, DNAJB8S3, and DNAJB8S4), in which phenylalanines (black bars) were mutated to serine (red bars). (B) DNAJB8-mRuby3 and DnaJB8 were used in cell and in vitro experiments, respectively. mRuby3 is colored pale red. (C) Average Rh measured by DLS of DNAJB8WT (blue), DNAJB8S1 (green), DNAJB8S2 (gold), DNAJB8S3 (cyan), and DNAJB8S4 (grey) at t=0 hrs (solid) and t=30 hrs (dashed). Data is shown as an average of three replicates with standard deviation. Shown values were calculated with SOS < 20. For multiple comparisons to DNAJB8WT: *** p<0.001 and **** p<0.0001. (D) SEC-MALS chromatogram of DNAJB8S3. 99.3% of the sample mass eluted as a single peak with a calculated molar mass of 25.45 ±0.016 kg/mol. (E) Representative images from cells transfected with mRuby3 (top right), DNAJB8 (bottom left), and DNAJB8S3 (bottom right). DAPI is colored blue and mRuby3 signal is shown in red. (F) Histogram of puncta frequency across cell lines expressing mRuby3 (red), DNAJB8WT-mRuby3 (blue), DNAJB8S1-mRuby3 (green), DNAJB8S2-mRuby3 (gold), DNAJB8S3-mRuby3 (cyan), and DNAJB8S4-mRuby3 (grey). All values were calculated from CellProfiler v.4.2.1. Data is shown as an average of three replicates with standard deviation. One-way ANOVA was used to report significance where F=75.25 and P-value<0.0001. For multiple comparisons to DNAJB8WT, ** p<0.01.
Figure 2.
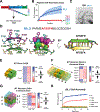
Figure 2.. A steric zipper motif drives local S/T-rich domain self-assembly.
(A) Peptides tested are shown below their respective locations within the DNAJB8 sequence. (B) ThT time aggregation time course of peptide library. (C) TEM image of oligomeric B8_5 peptide assemblies after 10 hrs of incubation at RT. Scale bar: 200 nm. (D) 0.75Å microED structure of the 147AFSSFN152 class 6 steric zipper motif identified within the B8_5 peptide. Four monomers of 147AFSSFN152 are shown within the assembly (left). The structure is stabilized by aromatic F148 and F151 interactions (center), and anti-parallel β-strand backbone hydrogen bonding (right). Crystallography statistics are shown in Table S2. (E-G) SASA analysis of F148 and F151 in (E) a peptide dimer based on the 147AFSSFN152 structure in panel D, a horizontally (F) and vertically (G) aligned hexamer. High SASA values correspond to greater solvent exposure (blue), while lower values correspond to less solvent exposure (red). (H) ThT aggregation time course of B8_5 WT (blue) derived peptides: F148S (salmon), F151S (gold), F148S F151S (teal), S149P (orange) and S149P S150P (black).
Figure 3.
Figure 3.. F151 is the primary driver of FL DNAJB8 self-assembly.
(A) DNAJB8WT, DNAJB8F148S, DNAJB8F151S, and DNAJB8F148S_F151S. Red hashes indicate the relative positions of the mutations. (B) Average Rh measured by DLS of DNAJB8WT (blue), DNAJB8S3 (cyan), DNAJB8F148S (lime), DNAJB8F151S (purple), and DNAJB8F148S_F151S (teal) at t=0 hrs (solid) and t=30 hrs (dashed). Data shown in the grey box was taken from Figure 1C for comparison. Only values with SOS < 20 were included. Data is shown as an average of three replicates with standard deviation. For multiple comparisons to DNAJB8WT: *** p<0.001, and **** p<0.0001. (C) SEC-MALS chromatogram of DNAJB8F148S_F151S. 93% of the sample mass eluted as a single peak with a calculated molar mass of 25.8 ±0.2 kg/mol. (D) Representative images of cell lines expressing DNAJB8F148S-mRuby3 (top right), DNAJB8F151S-mRuby3 (bottom left), and DNAJB8F148S_F151S-mRuby3 (bottom right). DAPI is shown in blue and mRuby3 signal from fusion proteins is shown in red. (E) Histogram of puncta frequency across cell lines expressing mRuby3 (red), DNAJB8WT-mRuby3 (blue), DNAJB8S3-mRuby3 (cyan), DNAJB8F148S-mRuby3 (lime), DNAJB8F151S-mRuby3 (purple) and DNAJB8F148S_F151S-mRuby3 (teal). Data shown in the gray box were taken from Figure 1F for comparison. All values were calculated from CellProfiler v.4.2.1. Data is shown as an average of three replicates with standard deviation. One-way ANOVA was used to report significance where F=87.85 and P-value<0.0001. Significance relative to DNAJB8WT reported as **** p<0.0001. Bar shown to indicate no significance between the mRuby3 negative control and DNAJB8S3, DNAJB8F151S, and DNAJB8F148S_F151S.
Figure 4.
Figure 4.. DNAJB8 preferentially binds a misfolded tau seed.
(A) DNAJB8WT, DNAJB8S3, and FL tau Mi/Ms used in in vitro activity experiments. Tau domains are shown from N to C termini as N-terminal domains (N1 and N2; orange), proline rich domain (PRD; cyan), and all repeat domains (R1; red, R2; green, R3; blue, R4; purple, R’; dark grey). (B) MST binding curves for DNAJB8S3 binding to Mi tau (black, circles) or Ms tau (red, squares). Fn values calculated from thermophoretic time traces, as a function of titrated protein. Baseline for unbound thermophoresis has been subtracted for the clarity of representation. Error bars represent the range of three replicates. (C,D) Relative coomassie signal intensity of the tau monomer band on a SDS-PAGE gel where DMTMM was added and quenched immediately (0 min), after 7.5 min, or after 15 min and either in samples of tau Mi (black), tau Ms (red), (C) tau Mi with DNAJB8WT (blue; solid), tau Ms with DNAJB8WT (blue; dashed), (D) tau Mi with DNAJB8S3 (cyan; solid), or tau Ms with DNAJB8S3 (cyan; dashed). Data is shown as an average of three replicates with standard deviation. (E-H) Contribution of different tau domains in the (E) DNAJB8WT:tau Mi, (F) DNAJB8S3:tau Mi, (G) DNAJB8WT:tau Ms, (H) and DNAJB8S3:tau Ms based on XL-MS contacts (id score >10). (I) DLS time course reporting average Rh for DNAJB8WT (brown), tau Ms (red), DNAJB8 WT and tau Ms (blue), and DNAJB8S3 and tau Ms (cyan). Data is shown as an average of three replicates with standard deviation.
Figure 5.
Figure 5.. Engineered monomeric DNAJB8 mutants retain anti-aggregation substrate activity in cells.
(A) Experiments involving HEK293T tau biosensor lines co-expressing P301S tauRD-mClover3 and P301S tauRD-mCerulean3. (B) Tau biosensor lines where transfected with mRuby3 (red), DNAJB6bWT-mRuby3 (pink), and DNAJB8WT-mRuby3 (blue) treated with lipofectamine (solid bars) or sonicated tau fibrils (dashed lines). Cell lines were prepared as biological triplicates. Data is shown as an average of three replicates with standard deviation. Statistics were calculated using two-way ANOVA, where *** p<0.001, **** p<0.0001 (C) Tau biosensor lines where transfected with DNAJB8WT-mRuby3 (blue), DNAJB8S1-mRuby3 (green), DNAJB8S2-mRuby3 (yellow), DNAJB8S3-mRuby3 (cyan), DNAJB8S4-mRuby3 (grey), DNAJB8F148S-mRuby3 (lime), DNAJB8F151SmRuby3 (purple), and DNAJB8F148S_F151S-mRuby3 (teal) and treated with lipofectamine (solid bars) or sonicated tau fibrils (dashed lines). %FRETClover/Cerulean was normalized to DNAJB8WT as shown in panel 5B to directly compare DNAJB8 mutants to DNAJB8WT activity (dashed line). Data is shown as an average of three replicates with standard deviation. Two-way ANOVA was used to calculate statistics across unseeded and tau fibrils lines. No significant changes could be reported across the different mutants for either condition. (D) Percentage of cells containing mRuby3 puncta across tau biosensor cells transfected with mRuby3 (red), DNAJB6bWT-mRuby3 (pink), and DNAJB8WT-mRuby3 (blue) and treated with lipofectamine (solid bars) or sonicated tau fibrils (dashed lines). Data is shown as an average of three replicates with standard deviation. Statistics were calculated using two-way ANOVA, where * p<0.1, ** p<0.01, **** p<0.0001. Values taken from image analysis with CellProfiler v.4.2.1. (E) Normalized number of puncta within tau biosensor cell populations transfected with DNAJB8WT-mRuby3 (blue), DNAJB8S1-mRuby3 (green), DNAJB8S2-mRuby3 (yellow), DNAJB8S3-mRuby3 (cyan), DNAJB8S4-mRuby3 (grey), DNAJB8F148S-mRuby3 (lime), DNAJB8F151S-mRuby3 (purple), and DNAJB8F148S_F151S-mRuby3 (teal) and treated with lipofectamine (solid bars) or sonicated tau fibrils (dashed lines). The data were normalized to DNAJB8WT-mRuby3 as shown in panel 5D to directly compare each mutant DNAJB8 construct to DNAJB8WT-mRuby3 (dashed line). Data is shown as an average of three replicates with standard deviation. Statistics were calculated using two-way ANOVA, where * p<0.1, ** p<0.01, *** p<0.001, **** p<0.0001. Values taken from image analysis with CellProfiler v.4.2.1. (F) Experiments involving co-expression of HttEx1 Q119-GFP with WT and mutant forms of DNAJB8-mRuby3 in HEK293T cells. (G) FTA results showing HttEx1 Q119 aggregation for cells expressing mRuby3 (red), DNAJB8WT-mRuby3 (blue), DNAJB8S1-mRuby3 (green), DNAJB8S2-mRuby3 (yellow), DNAJB8S3-mRuby3 (cyan), DNAJB8S4-mRuby3 (grey), DNAJB8F148S-mRuby3 (lime), DNAJB8F151S-mRuby3 (purple), and DNAJB8F148S_F151S-mRuby3 (teal). All values were normalized to the mRuby3 negative control. Data is shown as an average of three replicates with standard deviation. Statistics were calculated using Welch’s T test for each pair relative to DNAJB8WT, where * p<0.1.
Figure 6.
Figure 6.. DNAJB8 oligomerization is not a prerequisite for activity.
Model of DNAJB8 oligomeric assembly. The 147AFSSFN152 motif within the S/T-rich domain forms the core of the DNAJB8 oligomer with β-stranded dimers and Phe-Phe interactions stabilizing the hydrophobic core of the oligomer (top). Model showing how Phe→Ser mutations in the S/T-rich domain result in a mutant of DNAJB8 that is incapable of self-assembling (bottom). Model summarizing that DNAJB8 chaperone activity is independent on whether or not DNAJB8 exists as a oligomer (top right) or stable monomer (bottom right). Therefore, the role of DNAJB8 oligomeric assemblies in cells is unrelated to its activity as a JDP chaperone.

Update of

References

    1. Hartl FU (1996). Molecular chaperones in cellular protein folding. Nature 381, 571–9. 10.1038/381571a0. - DOI - PubMed
    1. Kampinga HH and Craig EA (2010). The HSP70 chaperone machinery: J proteins as drivers of functional specificity. Nat Rev Mol Cell Biol 11, 579–92. 10.1038/nrm2941. - DOI - PMC - PubMed
    1. Ryder BD, Wydorski PM, Hou Z and Joachimiak LA (2022). Chaperoning shape-shifting tau in disease. Trends Biochem Sci 47, 301–313. 10.1016/j.tibs.2021.12.009. - DOI - PubMed
    1. Fernandez-Fernandez MR, Gragera M, Ochoa-Ibarrola L, Quintana-Gallardo L and Valpuesta JM (2017). Hsp70 - a master regulator in protein degradation. FEBS Lett 591, 2648–2660. 10.1002/1873-3468.12751. - DOI - PubMed
    1. Quintana-Gallardo L, Martin-Benito J, Marcilla M, Espadas G, Sabido E and Valpuesta JM (2019). The cochaperone CHIP marks Hsp70- and Hsp90-bound substrates for degradation through a very flexible mechanism. Sci Rep 9, 5102. 10.1038/s41598-019-41060-0. - DOI - PMC - PubMed

Publication types

MeSH terms

LinkOut - more resources