. 2024 Mar 26;43(3):113951.
doi: 10.1016/j.celrep.2024.113951. Epub 2024 Mar 19.

Energy balance drives diurnal and nocturnal brain transcriptome rhythms

Affiliations

Energy balance drives diurnal and nocturnal brain transcriptome rhythms

Laura van Rosmalen et al. Cell Rep. .

Abstract

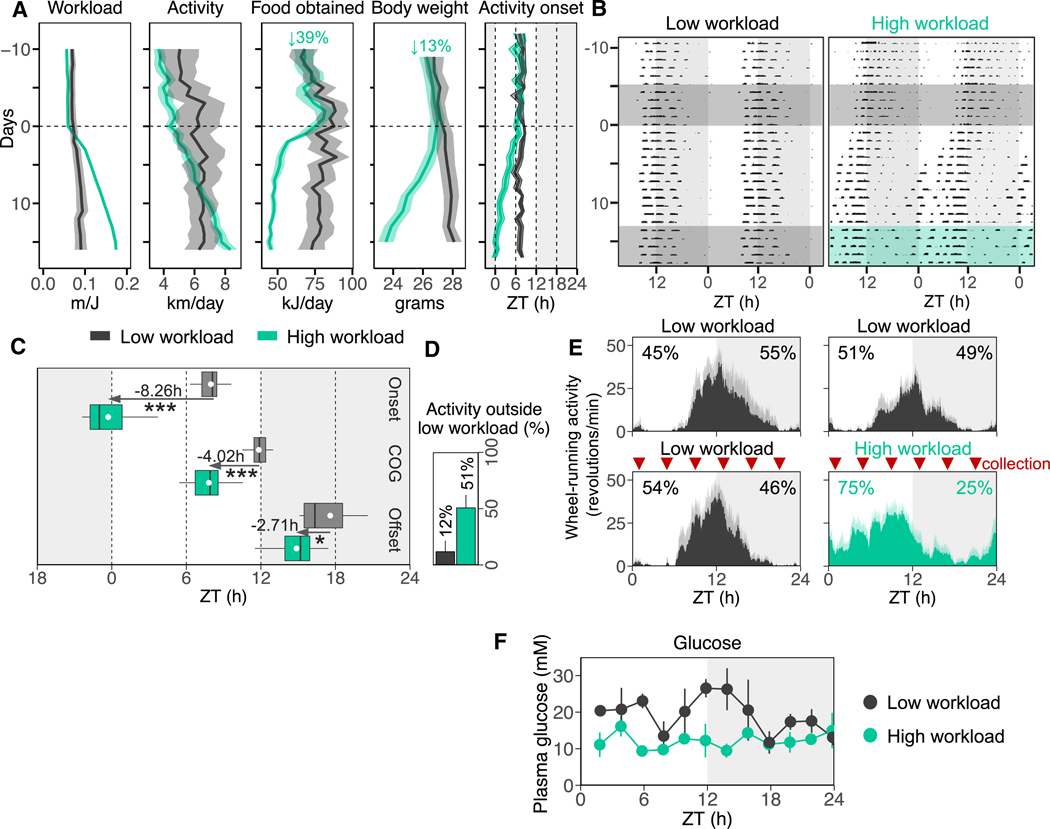
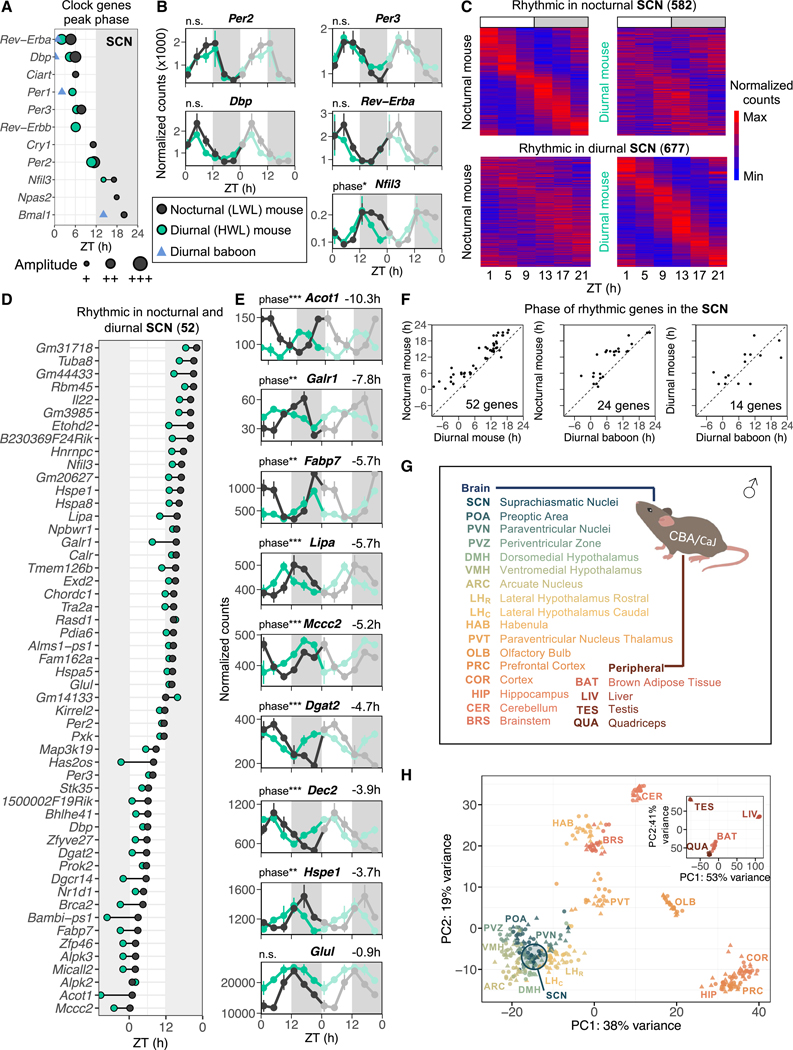
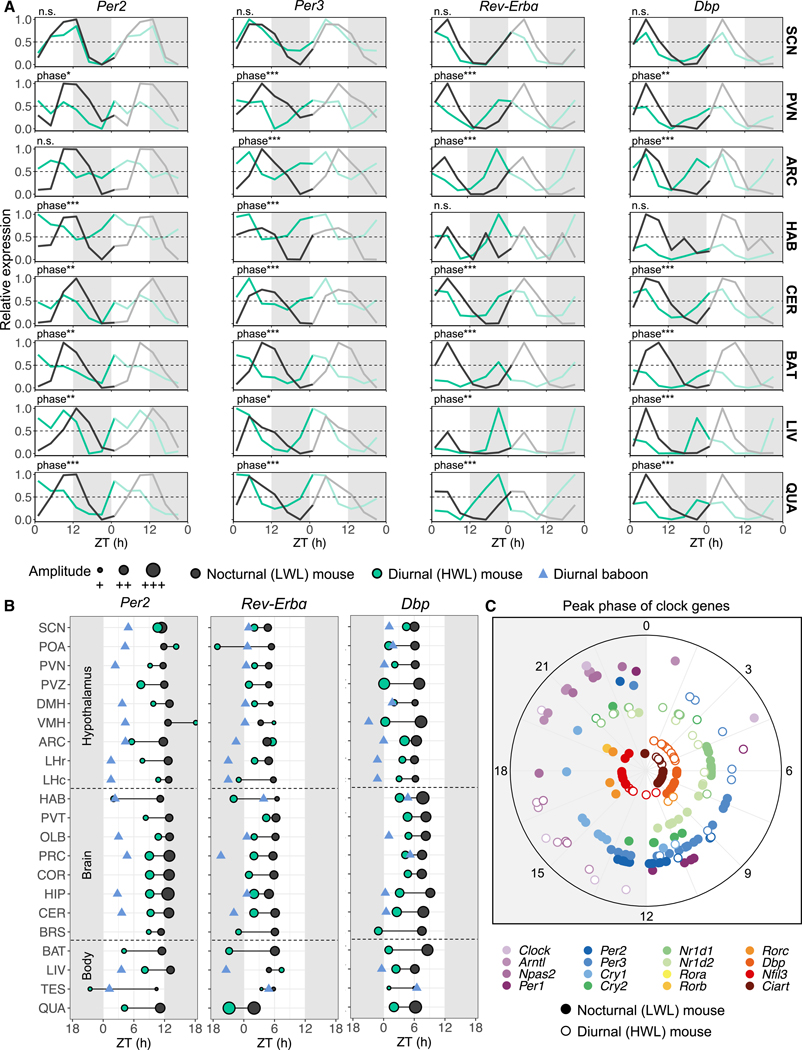
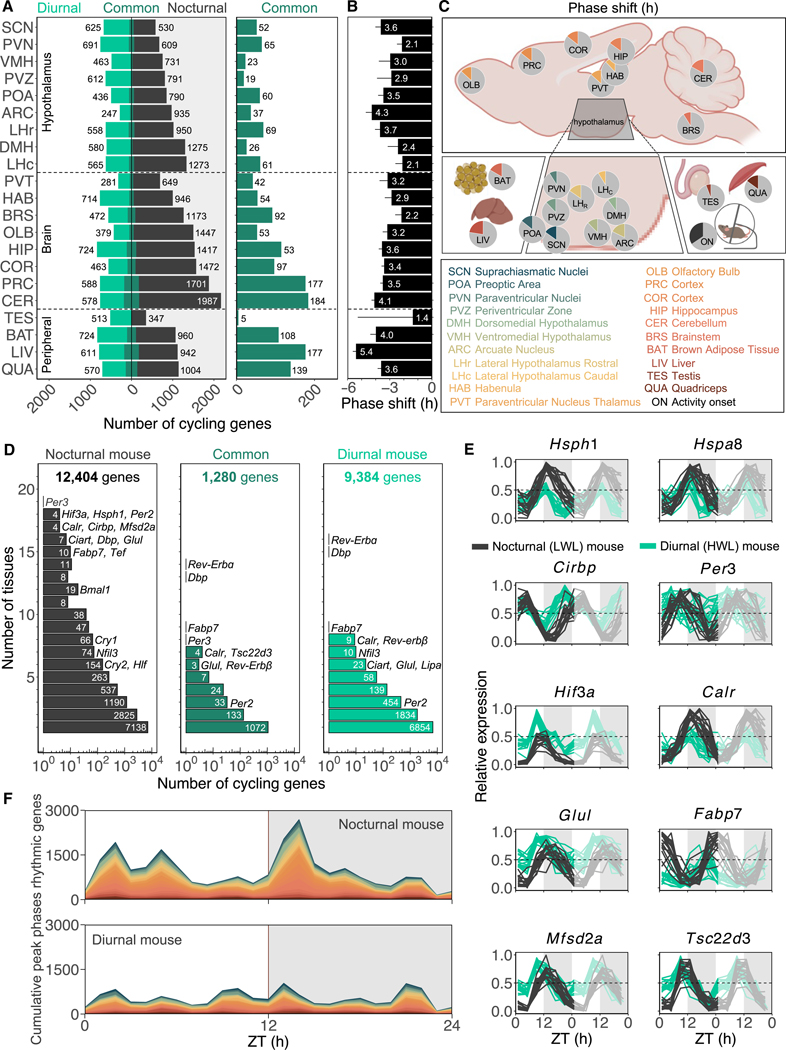
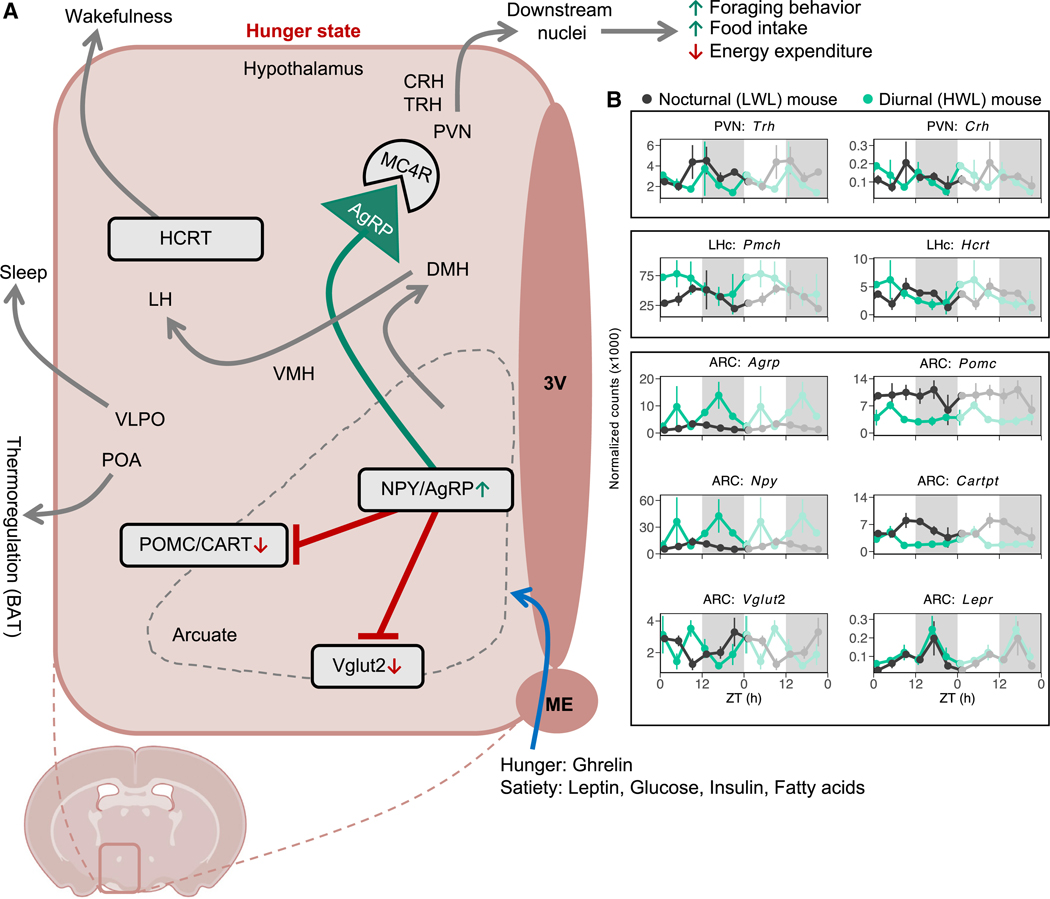
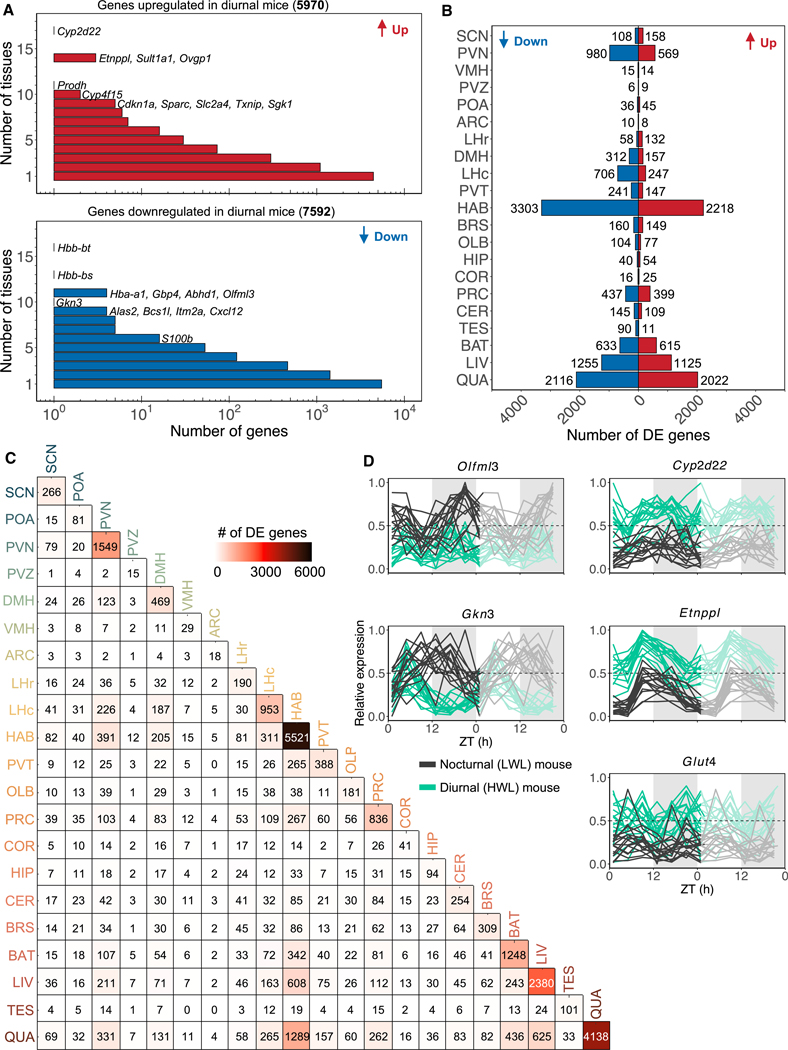
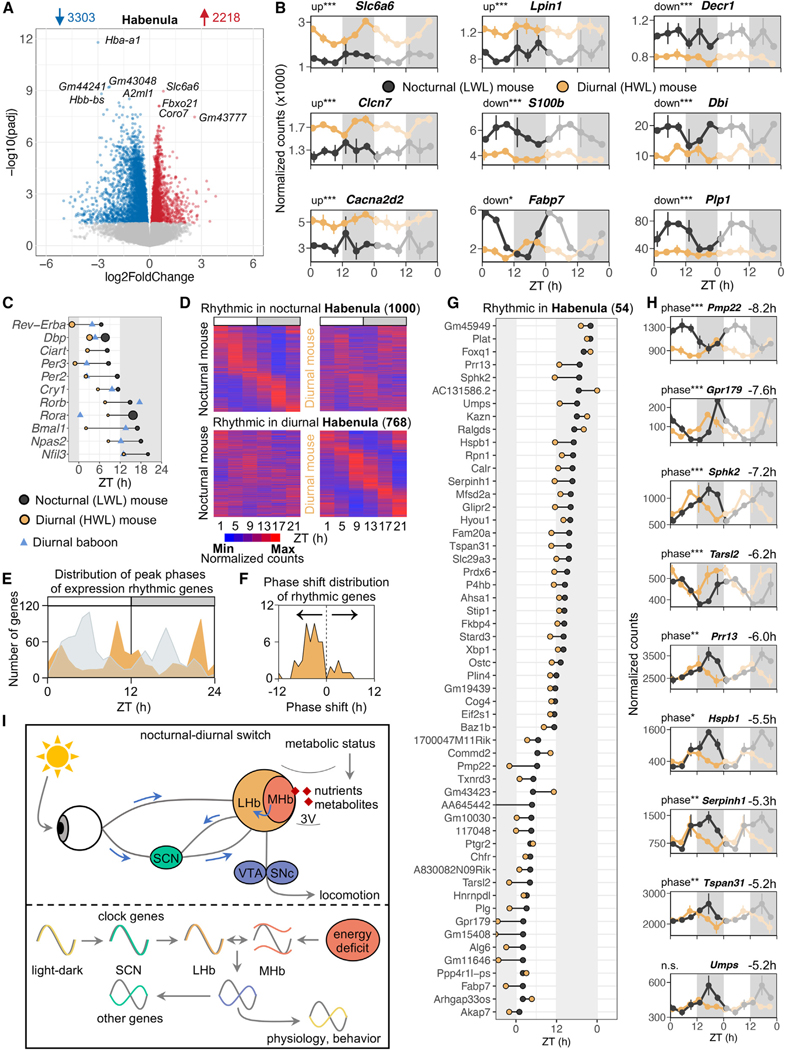
Plasticity in daily timing of activity has been observed in many species, yet the underlying mechanisms driving nocturnality and diurnality are unknown. By regulating how much wheel-running activity will be rewarded with a food pellet, we can manipulate energy balance and switch mice to be nocturnal or diurnal. Here, we present the rhythmic transcriptome of 21 tissues, including 17 brain regions, sampled every 4 h over a 24-h period from nocturnal and diurnal male CBA/CaJ mice. Rhythmic gene expression across tissues comprised different sets of genes with minimal overlap between nocturnal and diurnal mice. We show that non-clock genes in the suprachiasmatic nucleus (SCN) change, and the habenula was most affected. Our results indicate that adaptive flexibility in daily timing of behavior is supported by gene expression dynamics in many tissues and brain regions, especially in the habenula, which suggests a crucial role for the observed nocturnal-diurnal switch.

Keywords: CP: Metabolism; CP: Neuroscience; SCN; behavioral plasticity; circadian rhythms; diurnal; habenula; hypothalamus; negative energy balance; nocturnal; running wheel activity; temporal niche switching.


Conflict of interest statement

Declaration of interests The authors declare no competing interests.

Figures

Figure 1.
Figure 1.. Switching mice to be nocturnal or diurnal by working for food
(A) Gradual changes in workload (m/J), wheel-running activity, food obtained, body weight, and activity onset in low-workload (LWL) mice (gray) and high-workload (HWL) mice (green). The shaded areas indicate the dark phase (zeitgeber time [ZT] 12–ZT24). Data are represented as the mean ± SEM. (B) Representative double-plotted actograms of an LWL mouse (left) and an HWL mouse (right). Dark-gray shaded areas illustrate LWL condition, green shaded area illustrates HWL condition. (C) Onset, center of gravity (COG), and offset of wheel-running activity are shown for LWL and HWL animals. Phase shifts (advances) are depicted in hours. Mean values for each group are shown as white circles. *p < 0.05, **p < 0.01, ***p < 0.001. (D) Percentage activity that falls outside of the average active period of LWL mice. (E) Average daily wheel-running activity profiles for LWL (gray) and HWL (green) animals 5 days prior to the start of the protocol and the last 5 days of the protocol before tissue collection. Data are represented as the mean ± SD. Percentage diurnal and percentage nocturnal activity are shown. Red arrows indicate the timing of tissue collection (ZT1, 5, 9, 13, 17, and 21). (F) Plasma glucose levels in HWL and LWL animals are shown for 12 time points across the 24-h LD cycle. Data are represented as the mean ± SEM. See also Figure S1.
Figure 2.
Figure 2.. The rhythmic SCN transcriptome in nocturnal (LWL) and diurnal (HWL) mice
(A) Peak phase of rhythmic clock genes in the SCN of nocturnal mice (black), diurnal mice (green), and diurnal baboons (blue triangles). Data are shown only for statistically significant rhythmic clock genes. Amplitude is defined by point size (for mice only). The shaded area indicates the dark phase (ZT12–ZT24). (B) Double-plotted expression profiles for a selection of clock genes. Data are represented as the mean ± SEM. (C) Heatmap of normalized gene expression of rhythmic genes in the SCN of nocturnal and diurnal mice (false discovery rate [FDR] < 0.05) across six time points. Max and Min represent the relative ranked maximum and minimum values for the specific gene, respectively. (D) Phase of peak expression of common rhythmic genes in nocturnal and diurnal mice in the SCN. (E) Double-plotted expression patterns for a selection of genes that show major phase advances in diurnal mice. Phase shifts in hours are shown on top of each plot and labeled for significant differences in phase, with *p < 0.05, **p < 0.01, ***p < 0.001. (F) Correlations between the phase of rhythmic gene expression in the SCN of nocturnal mice, diurnal mice, and diurnal baboons. (G) List of tissues collected (17 brain sites, 4 peripheral organs). (H) Principal-component analysis (PCA) was performed on all six time points of nocturnal and diurnal mice for brain and peripheral tissues separately. Circles represent nocturnal mice; triangles represent diurnal mice. See also Figures S1–S4 and Tables S1, S2, and S3.
Figure 3.
Figure 3.. Clock-gene expression changes across tissues in diurnal (HWL) mice
(A) Double-plotted relative expression profiles of Per2, Per3, Rev-Erbɑ, and Dbp in nocturnal mice (black) and diurnal mice (green), across a selection of five brain sites (suprachiasmatic nucleus, SCN; paraventricular nucleus, PVN; arcuate nucleus, ARC; habenula, HAB; and cerebellum, CER) and three peripheral organs (brown adipose tissue, BAT; liver, LIV; and quadriceps, QUA). Data are represented as the mean. Phase shifts are labeled for significant differences in phase, with *p < 0.05, **p < 0.01, ***p < 0.001. The shaded areas indicate the dark phase (ZT12–ZT24). (B) Phases of peak expression of a selection of clock genes, Per2, Rev-Erbɑ, and Dbp, in nocturnal mice (black), diurnal mice (green), and diurnal baboons (blue triangles) across all tissues. Data are shown only for statistically significant rhythmic clock genes. Amplitude is displayed by point size. (C) Radial plot showing the peak phases of significantly rhythmic clock genes across tissues. See also Figure S2 and Tables S1 and S6.
Figure 4.
Figure 4.. Rhythmic gene expression changes across tissues in nocturnal (LWL) and diurnal (HWL) mice
(A) The bar graph indicates the number of genes rhythmic only in diurnal mice (light green), common rhythmic genes (dark green), and genes rhythmic only in nocturnal mice (gray) for each tissue. (B) The average phase shift ± SEM in hours of all common rhythmic genes per tissue. (C) Pie charts (h/24 h) represent the average phase shift of all common rhythmic genes for each tissue at the anatomical location. Created with http://biorender.com. (D) Distribution of rhythmic genes and the number of tissues in which they are rhythmic in nocturnal mice, in common, and in diurnal mice. (E) Double-plotted normalized expression profiles for a selection of genes across 17 brain sites in nocturnal mice (gray) and diurnal mice (green). (F) Cumulative peak phases of expression of rhythmic genes in all different tissues of nocturnal mice and diurnal mice. The shaded areas indicate the dark phase (ZT12–ZT24). See also Figures S5 and S6; Tables S2, S3, S7, and S14.
Figure 5.
Figure 5.. The transcriptome of feeding-fasting and sleep-wake centers in niche-switched mice
(A) Schematic representation of hypothalamic hunger-satiety and sleep-wake centers and neuropeptides involved in control of feeding behavior and energy expenditure. 3V, third ventricle; ME, median eminence. (B) Double-plotted normalized expression profiles for candidate genes in the PVN, LHc, and ARC of nocturnal mice (black) and diurnal mice (green). Data are represented as the mean ± SEM. The shaded areas indicate the dark phase (ZT12–ZT24).
Figure 6.
Figure 6.. Negative energy balance leads to systemic and tissue-specific changes in gene expression
(A) Distribution of differentially expressed (DE) genes and the number of tissues in which they are DE. (B) Number of DE genes for all tissues. Downregulated genes are depicted in blue, and upregulated genes are in red. (C) Tissue-by-tissue overlap of DE genes in each tissue. (D) Double-plotted normalized expression profiles of a selection of DE genes across 17 brain sites in nocturnal mice (gray) and diurnal mice (green). The shaded areas indicate the dark phase (ZT12–ZT24). See also Figure S7; Tables S8, S9, S10, and S11.
Figure 7.
Figure 7.. A potential role for the habenula in driving nocturnal-diurnal switches
(A) Volcano plot of differentially expressed (DE) genes in the habenula. Upregulated genes in diurnal mice (red) and downregulated genes in diurnal mice (blue) are shown. (B) Double-plotted expression patterns for a selection of DE genes. Data are represented as the mean ± SEM. (C) Peak phase of clock genes in the habenula of nocturnal mice (black), diurnal mice (orange), and diurnal baboons (blue). Amplitude is defined by point size (for mice only). (D) Heatmaps of relative expression of rhythmic genes in the habenula of nocturnal and diurnal mice (FDR < 0.05) across six time points. Max and Min represent the relative ranked maximum and minimum values for the specific gene, respectively. (E) Temporal distribution of peak phases of expression of cycling genes in the habenula of nocturnal (gray) and diurnal (orange) mice. The y axis indicates the number of cycling genes that peak in expression at ZT1–ZT24 (1-h bins). (F) Phase shift distribution of genes that were rhythmic in both nocturnal and diurnal mice. (G) Phase of peak expression of common cycling genes in nocturnal (black) and diurnal (orange) mice. (H) Double-plotted expression patterns of a selection of genes that show major phase advances in diurnal mice. Phase shifts in hours are shown on top of each plot and labeled for significant differences in phase, with *p < 0.05, **p < 0.01, ***p < 0.001. The shaded areas indicate the dark phase (ZT12–ZT24). (I) Schematic of a hypothetical biological pathway; see discussion for more details. SCN, suprachiasmatic nucleus; LHb, lateral habenula; MHb, medial habenula; 3V, third ventricle; VTA, ventral tegmental area; SNc, substantia nigra pars compacta. See also Tables S3, S8, and S12.

References

    1. Challet E. (2007). Minireview: Entrainment of the suprachiasmatic clock-work in diurnal and nocturnal mammals. Endocrinology 148, 5648–5655. 10.1210/en.2007-0804. - DOI - PubMed
    1. Kalsbeek A, Palm IF, La Fleur SE, Scheer FAJL, Perreau-Lenz S, Ruiter M, Kreier F, Cailotto C, and Buijs RM (2006). SCN outputs and the hypothalamic balance of life. J. Biol. Rhythms 21, 458–469. 10.1177/0748730406293854. - DOI - PubMed
    1. van Drunen R, and Eckel-Mahan K. (2021). Circadian rhythms of the hypothalamus: From function to physiology. Clocks & Sleep 3, 189–226. 10.3390/clockssleep3010012. - DOI - PMC - PubMed
    1. van der Vinne V, Gorter JA, Riede SJ, and Hut RA (2015). Diurnality as an energy-saving strategy: energetic consequences of temporal niche switching in small mammals. J. Exp. Biol. 218, 2585–2593. 10.1242/jeb.119354. - DOI - PubMed
    1. Hut RA, Kronfeld-Schor N, van der Vinne V, and De la Iglesia H. (2012). In search of a temporal niche: Environmental factors. Prog. Brain Res. 199, 281–304. 10.1016/B978-0-444-59427-3.00017-4. - DOI - PubMed

Publication types