. 2024 Apr 10;4(4):100523.
doi: 10.1016/j.xgen.2024.100523. Epub 2024 Mar 19.

Integrative polygenic risk score improves the prediction accuracy of complex traits and diseases

Affiliations

Integrative polygenic risk score improves the prediction accuracy of complex traits and diseases

Buu Truong et al. Cell Genom. .

Abstract

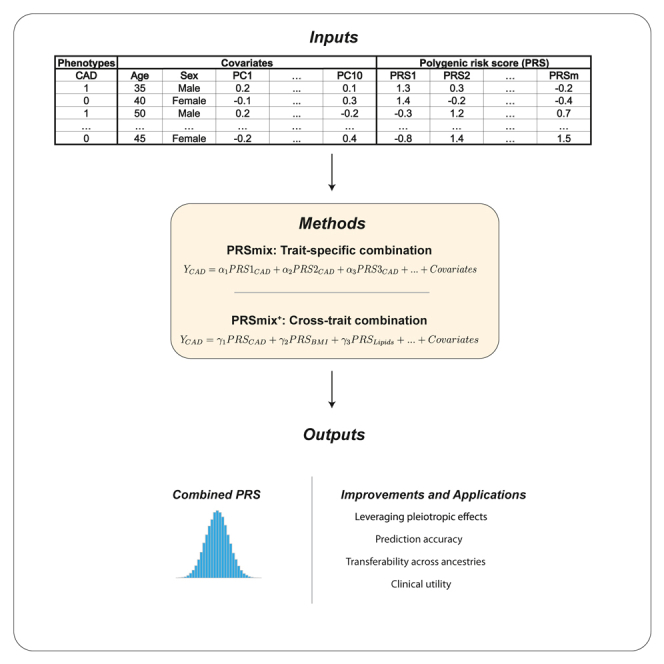
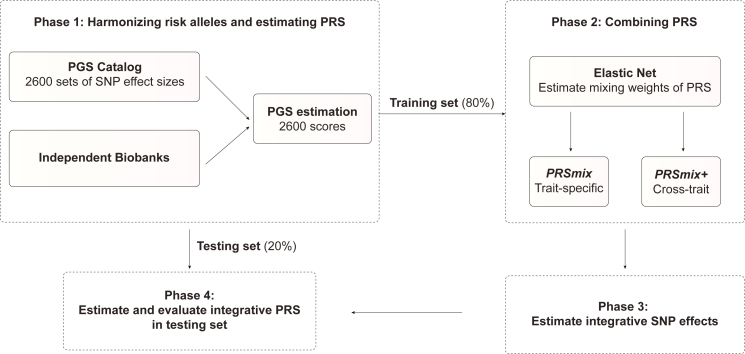
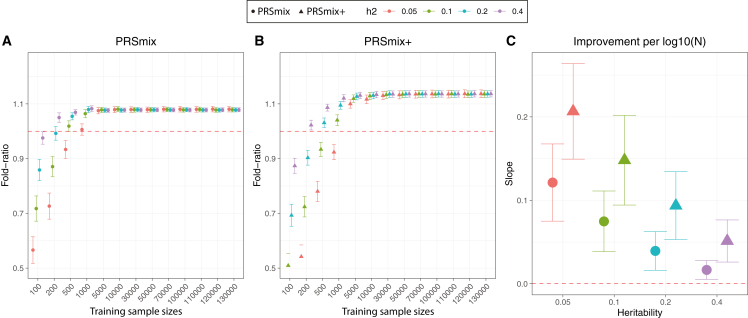
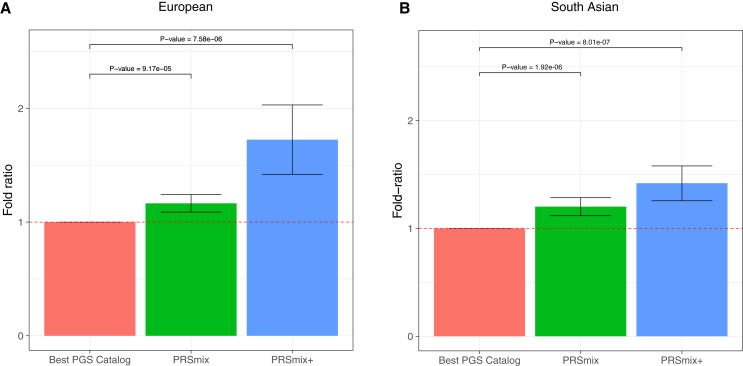
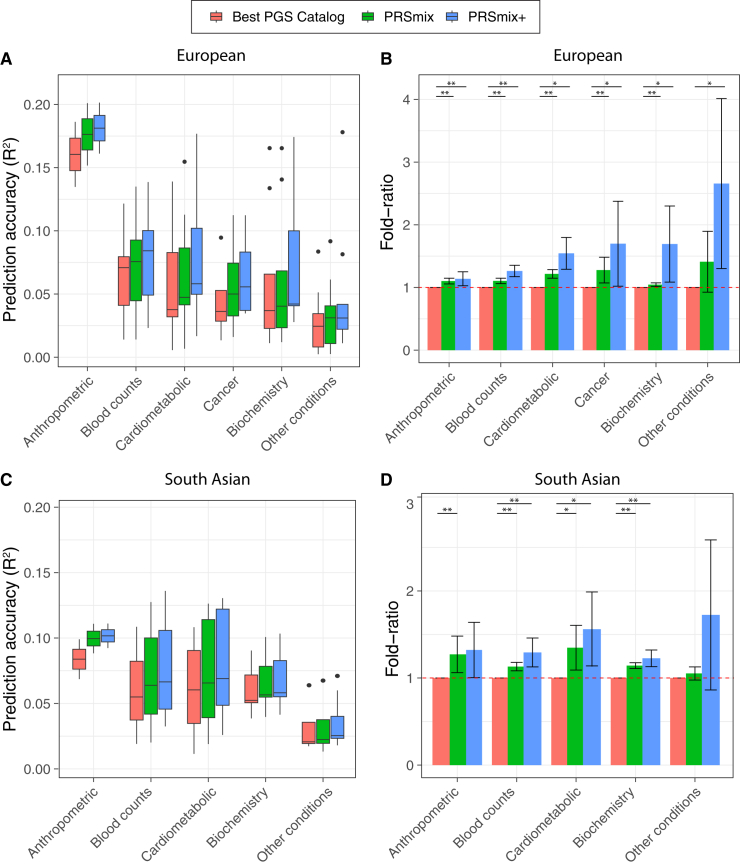
Polygenic risk scores (PRSs) are an emerging tool to predict the clinical phenotypes and outcomes of individuals. We propose PRSmix, a framework that leverages the PRS corpus of a target trait to improve prediction accuracy, and PRSmix+, which incorporates genetically correlated traits to better capture the human genetic architecture for 47 and 32 diseases/traits in European and South Asian ancestries, respectively. PRSmix demonstrated a mean prediction accuracy improvement of 1.20-fold (95% confidence interval [CI], [1.10; 1.3]; p = 9.17 × 10⁻⁵) and 1.19-fold (95% CI, [1.11; 1.27]; p = 1.92 × 10⁻⁶), and PRSmix+ improved the prediction accuracy by 1.72-fold (95% CI, [1.40; 2.04]; p = 7.58 × 10⁻⁶) and 1.42-fold (95% CI, [1.25; 1.59]; p = 8.01 × 10⁻⁷) in European and South Asian ancestries, respectively. Compared to the previously cross-trait-combination methods with scores from pre-defined correlated traits, we demonstrated that our method improved prediction accuracy for coronary artery disease up to 3.27-fold (95% CI, [2.1; 4.44]; p value after false discovery rate (FDR) correction = 2.6 × 10⁻⁴). Our method provides a comprehensive framework to benchmark and leverage the combined power of PRS for maximal performance in a desired target population.

Keywords: PRS; South Asian; clinical utility; combination; cross ancestry; integrative.


Conflict of interest statement

Declaration of interests P.N. reports grants from Allelica, Amgen, Apple, Boston Scientific, Genentech, and Novartis; is a consultant to Allelica, Apple, AstraZeneca, Blackstone Life Sciences, Foresite Labs, HeartFlow, Novartis, Genentech, and GV; reports scientific advisory board membership with Esperion Therapeutics, Preciseli, and TenSixteen Bio; is a scientific co-founder of TenSixteen Bio; and reports spousal employment at Vertex Pharmaceuticals, all unrelated to the present work.

Figures

None
Graphical abstract
Figure 1
Figure 1
The framework of the trait-specific and cross-trait PRS integration In phase 1, we obtained the SNP effects from the PGS Catalog and then harmonized the effect alleles as the alternative alleles in the independent cohorts. In each independent biobank (AoU, G&H), we estimated the PRS and split the data into training (80%) and testing (20%) datasets. In phase 2, in the training dataset, we trained the Elastic Net model with high-power scores to estimate the mixing weights for the PRSs. The training phase could include PRSs from traits corresponding to outcomes (PRSmix) or all traits (PRSmix+). The training was adjusted for age, sex, and 10 principal components (PCs). In phase 3, we adjusted the per-allele effect sizes from each single PRS by multiplying with the corresponding mixing weights obtained in the training phase. The final per-allele effect sizes are estimated as the weighted sum of the SNP effects across different single scores. In phase 4, we evaluated the re-estimated per-allele effect sizes in the testing dataset.
Figure 2
Figure 2
Simulations to demonstrate the predictive improvement of PRSmix and PRSmix+ (A and B) The points and triangles represent the mean fold ratio of R2 between (A) PRSmix and (B) PRSmix+, respectively, versus the best single PRS. (C) The improvement per logarithm with base 10 of sample size for various heritabilities was represented as a slope of a linear regression of fold ratio ∼log10(N). In simulations, the correlation within simulated trait-specific PRSs was 0.8, and the correlation between trait-specific and correlated PRSs was 0.4 (see STAR Methods). The whiskers demonstrate CIs across 200 replications. The dashed red lines represent the reference for fold ratio equal to 1 for (A) and (B), and equal to 0 for (C).
Figure 3
Figure 3
Comparison of PRSmix and PRSmix+ versus the best PGS Catalog in European and South Asian ancestries The relative improvement compared to the best single PRS was assessed in (A) the European ancestry in the AoU cohort and (B) South Asian ancestry in the G&H cohort. PRSmix combines trait-specific PRSs and PRSmix+ combines additional PRSs from other traits. The best PGS Catalog score was selected by the best-performance trait-specific score in the training sample and evaluated in the testing sample. The prediction accuracy (R2) was calculated as incremental R2, which is a difference of R2 between the model with PRS and covariates including age, sex, and 10 PCs versus the base model with only covariates. Prediction accuracy for binary traits was assessed with liability-R2 where disease prevalence was approximately estimated as a proportion of cases in the testing set. The bars represent the ratio of prediction accuracy of PRSmix and PRSmix+ versus the best PRS from the PGS Catalog across 47 traits and 32 traits in AoU and G&H cohorts, respectively, and the whiskers demonstrate 95% CIs. p values for significance difference of the fold ratio from 1 using a two-tailed paired t test.
Figure 4
Figure 4
Prediction accuracy and improvement across various types of traits in the European and South Asian ancestry We classified the traits into six main categories for European ancestry in the AoU cohort and five categories for South Asian ancestry in the G&H cohort due to the low prevalence of cancer traits in G&H. The prediction accuracies (A and C) are estimated as incremental R2 and liability R2 for continuous traits and binary traits, respectively. The relative improvements (B and D) are estimated as the fold ratio between the prediction accuracies of PRSmix and PRSmix+ against the best PGS Catalog. The order on the axis followed the decrease in the prediction accuracy of PRSmix+. The boxplots in (A) and (C) show the first to the third quartile of prediction accuracies for 47 traits and 32 traits in European and South Asian ancestries, respectively. The whiskers reflect the maximum and minimum values within the 1.5 × IQR for each group. The bars in (B) and (D) represent the mean prediction accuracy across the traits in that group and the whiskers demonstrate 95% CIs. The red dashed lines in (B) and (D) represent the ratio equal to 1 as a reference for comparison with the best PGS Catalog score. The asterisks indicate p values: ∗p < 0.05 and ∗∗p < 0.05/number of traits in each type with a two-tailed paired t test.
Figure 5
Figure 5
Benchmarking previous methods with PRSmix and PRSmix+ LDpred2-auto was used as the baseline method to input in the methods. Five traits from Maier et al. and 26 publicly available GWASs for European ancestry were curated. The components of each combination method are denoted in parentheses. wMT-SBLUP was conducted with the input of sample sizes from the GWAS summary statistics and heritabilities and genetic correlation between all pairs of traits using LD score regression. PRSmix (LDpred2 + PGS Catalog) combined target trait-specific scores within 26 scores and PGS Catalog. Elastic Net (LDpred2) was performed using Elastic Net with all scores from 26 traits generated with LDpred2-auto. PRSmix+ (LDpred2 + PGS Catalog) was conducted using 26 scores from LDpred2-auto and scores from all traits obtained from PGS Catalog. Incremental R2 and liability R2 were used for continuous traits and binary traits, respectively. The whiskers demonstrate 95% CIs of mean prediction accuracy. CAD, coronary artery disease; T2D, type 2 diabetes.
Figure 6
Figure 6
Comparison of prediction accuracies with PRSmix, PRSmix+, and CAD PRS from PGS Catalog PRSmix was computed as a linear combination of CAD PRS and PRSmix+ was computed as a linear combination of all significant PRSs obtained from the PGS Catalog. The PRSs were evaluated in the testing set with liability R2 in the (A) European ancestry from the AoU cohort and (B) South Asian ancestry from the G&H cohort. The bars indicate the mean prediction accuracy and the whiskers show 95% CIs.
Figure 7
Figure 7
Net reclassification improvement for CAD with the addition of PRSs to the baseline model in European and South Asian ancestries The baseline model for risk prediction includes QRISK3, age, sex, total cholesterol, HDL-C, systolic blood pressure, BMI, T2D, and current smoking status. We compared the integrative models with PGS Catalog, PRSmix, and PRSmix+ in addition to clinical risk factors versus the baseline model with only factors. The points indicate the mean estimate for continuous net reclassification improvement (NRI) and the whiskers indicate 95% CIs estimated from 500 bootstraps. HDL-C, high-density lipoprotein cholesterol.

Update of

References

    1. Catalog, P.G.S. PGS Catalog - the Polygenic Score Catalog. http://www.pgscatalog.org/.
    1. Choi S.W., Mak T.S.-H., O’Reilly P.F. Tutorial: a guide to performing polygenic risk score analyses. Nat. Protoc. 2020;15:2759–2772. doi: 10.1038/s41596-020-0353-1. - DOI - PMC - PubMed
    1. Dudbridge F. Power and predictive accuracy of polygenic risk scores. PLoS Genet. 2013;9 doi: 10.1371/journal.pgen.1003348. - DOI - PMC - PubMed
    1. Choi S.W., O’Reilly P. SA20 - PRSice 2: POLYGENIC RISK SCORE SOFTWARE (UPDATED) AND ITS APPLICATION TO CROSS-TRAIT ANALYSES. Eur. Neuropsychopharmacol. 2019;29:S832. doi: 10.1016/j.euroneuro.2017.08.092. - DOI
    1. Privé F., Arbel J., Vilhjálmsson B.J. LDpred2: better, faster, stronger. Bioinformatics. 2021;36:5424–5431. doi: 10.1093/bioinformatics/btaa1029. - DOI - PMC - PubMed