. 2024 Aug;81(2):207-217.
doi: 10.1016/j.jhep.2024.03.014. Epub 2024 Mar 18.

Phenotypes and ontogeny of senescent hepatic stellate cells in metabolic dysfunction-associated steatohepatitis

Affiliations

Phenotypes and ontogeny of senescent hepatic stellate cells in metabolic dysfunction-associated steatohepatitis

Chittampalli N Yashaswini et al. J Hepatol. 2024 Aug.

Abstract

Background & aims: Hepatic stellate cells (HSCs) are the key drivers of fibrosis in metabolic dysfunction-associated steatohepatitis (MASH), the fastest growing cause of hepatocellular carcinoma (HCC) worldwide. HSCs are heterogenous, and a senescent subset of HSCs is implicated in hepatic fibrosis and HCC. Administration of anti-uPAR (urokinase-type plasminogen activator receptor) CAR T cells has been shown to deplete senescent HSCs and attenuate fibrosis in murine models. However, the comprehensive features of senescent HSCs in MASH, as well as their cellular ontogeny have not been characterized; hence, we aimed to comprehensively characterize and define the origin of HSCs in human and murine MASH.

Methods: To comprehensively characterize the phenotype and ontogeny of senescent HSCs in human and murine MASH, we integrated senescence-associated beta galactosidase activity with immunostaining, flow cytometry and single-nucleus RNA sequencing (snRNAseq). We integrated the immunohistochemical profile with a senescence score applied to snRNAseq data to characterize senescent HSCs and mapped the evolution of uPAR expression in MASH.

Results: Using pseudotime trajectory analysis, we establish that senescent HSCs arise from activated HSCs. While uPAR is expressed in MASH, the magnitude and cell-specificity of its expression evolve with disease stage. In early disease, uPAR is more specific to activated and senescent HSCs, while it is also expressed by myeloid-lineage cells, including Trem2+ macrophages and myeloid-derived suppressor cells, in late disease. Furthermore, we identify novel surface proteins expressed on senescent HSCs in human and murine MASH that could be exploited as therapeutic targets.

Conclusions: These data define features of HSC senescence in human and murine MASH, establishing an important blueprint to target these cells as part of future antifibrotic therapies.

Impact and implications: Hepatic stellate cells (HSCs) are the primary drivers of scarring in chronic liver diseases. As injury develops, a subset of HSCs become senescent; these cells are non-proliferative and pro-inflammatory, thereby contributing to worsening liver injury. Here we show that senescent HSCs are expanded in MASH (metabolic dysfunction-associated steatohepatitis) in humans and mice, and we trace their cellular origin from the activated HSC subset. We further characterize expression of uPAR (urokinase plasminogen activated receptor), a protein that marks senescent HSCs, and report that uPAR is also expressed by activated HSCs in early injury, and in immune cells as liver injury advances. We have integrated high-resolution single-nucleus RNA sequencing with immunostaining and flow cytometry to identify five other novel proteins expressed by senescent HSCs, including mannose receptor CD206, which will facilitate future therapeutic development.

Keywords: CD206; hepatic stellate cells; metabolic dysfunction-associated steatohepatitis; senescence; senolytic; uPAR.


Figures

FIG. 1.
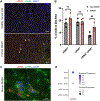
FIG. 1.. Senescence is elevated in human MASH and snRNAseq pinpoints a senescent HSC cluster.
(A) SA-β-gal activity in healthy patient liver (left, sample HumanNormal_1), and MASH liver (right, sample HumanMASH_3), with (B) quantification (n=3 per group), p = 0.005722. (C) snRNAseq clusters and (D) HSC subclusters from MASH and healthy patients post-doublet removal (scDblFinder), data originally from Wang et al., 2023.
FIG. 2.
FIG. 2.. uPAR is expressed by senescent, activated and deactivated HSCs in human MASH.
(A) uPAR and αSMA co-immunostaining in healthy liver (top, HumanNormal_3) and MASH (bottom, humanMASH_3). White arrows denote double-positive cells. (B) Co-immunostaining quantification (n=3 for healthy, n=4 for MASH), p values from left to right are 0.253112, 0.867618, and 0.026745. (C) 63x oil immersion of co-immunostaining in MASH (humanMASH_2). (D) HSC subcluster uPAR expression.
FIG. 3.
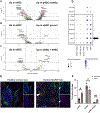
FIG. 3.. Senescent HSCs in human MASH express MRC1 (CD206).
Volcano plots of DEGs between the senescent HSC cluster and (A) quiescent-like healthy HSC cluster, (B) quiescent precursors of activated HSC cluster, and (C) the HSC cluster containing activated and deactivated HSCs. MRC1 is boxed. (D) Dot plot of top genes encoding cell-surface proteins expressed by the senescent HSC cluster. Black arrow denotes MRC1. (C) 63x oil immersion of co-immunostaining in healthy human (HumanNormal_3) and MASH liver (HumanMASH_2). White arrowheads denote double positive cell. (F) Co-immunostaining quantification (n = 2 for healthy, n = 3 for MASH) p values from left to right are 0.021897, 0.237237, 0.001311.
FIG. 4.
FIG. 4.. Senescence is elevated in murine MASH.
(A) Fibrosis and Tumor (FAT) MASH model with H&E and Sirius Red timepoint stains. (B) SA-β-gal activity staining of FAT vs age-matched healthy mice. (C) SA-β-gal quantification (n=2 for Chow 6-week, n=3 for Chow 12-week, n=2 for Chow 29-week, n=4 for FAT 6-week, n=6 for FAT 12-week, n=3 for FAT 29-week) p values from left to right are 0.020334, 0.002727, 0.000556, 0.001257 (6-week vs 12-week FAT), 0.000556 (6-week vs 29-week FAT), 0.000183. (D) Senescence-associated gene expression in healthy vs FAT whole liver bulk RNAseq, and uPAR (Plaur) expression (right). All values normalized to average healthy liver (n=5 per group).
FIG. 5.
FIG. 5.. Hepatic senescence in MASH occurs in HSC-rich areas.
(A) Healthy, (B) 6-week FAT, (C) 12-week FAT, and (D) 29-week FAT serial sections stained for SA-β-gal activity (top) and desmin (bottom). White arrowheads indicate areas of overlap.
FIG. 6.
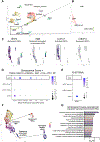
FIG. 6.. A distinct cluster of senescent HSCs arises from activated HSCs.
(A) snRNAseq clusters from 24-week FAT and chow mice post-doublet removal (scDblFinder), data originally from Wang et al., 2023. HSC clusters are boxed. (B) HSC subclustering. (C) Monocle3 gene expression plots of HSC subclusters. (D) Senescence-associated gene expression, black box indicating senescent subcluster. (E) Ki-67 expression, black box indicating senescent subcluster. (F) Monocle3 pseudotime trajectory analysis of HSC subclusters, arrows indicating direction of cell type evolution. (G) PANTHER gene ontology showing biological processes associated with top genes expressed by senescent HSC subcluster. Top genes identified as having significant p_val_adj < 0.05 and log2FC > 1. GO processes shown are significantly enriched (FDR < 0.05). Red asterisks indicate processes associated with senescence, fibrosis and inflammation.
FIG. 7.
FIG. 7.. uPAR expression is elevated in MASH tissues and is expressed by proliferating and non-proliferating cells.
(A) Serial sections from healthy (top) and 29-week FAT mice (bottom) stained for SA-β-gal activity (left) and uPAR (right). White arrows indicate SA-β-gal+ uPAR+ areas. Blue arrows indicate SA-β-gal+ Upar areas. Red arrows indicate SA-β-gal uPAR+ areas. (B) uPAR immunofluorescence quantification (n=5 per group), p values left to right are 0.000758, 0.002648, 0.002247. (C) Flow cytometry of 24-week FAT liver non-parenchymal cells, gated on singlets, live, CD45, αSMA+ events. Gates indicate uPAR+ Ki-67+ HSCs and uPAR+ Ki-67 HSCs. (D) Co-immunostaining of αSMA and uPAR, with (E) quantification via JaCOP (n=5 per group), p values left to right are <0.000001, 0.003528, 0.001278.
FIG. 8.
FIG. 8.. CD206 expression by HSCs in murine MASH is restricted to senescent HSCs.
Volcano plots of DEGs between the senescent HSC cluster and (A) quiescent-like healthy HSC cluster, (B) quiescent precursors of activated HSC cluster, (C) activated HSC cluster. Mrc1 is boxed. (D) Top genes expressed by the senescent HSC cluster that encode cell-surface proteins. Black box indicates genes expressed by >50% of senescent HSC cluster. Asterisks indicate genes significantly expressed by human senescent HSCs. Black arrow denotes Mrc1, encoding CD206. (E) Mrc1 expression among HSC subsets. (F) 63x oil immersion of αSMA and CD206 co-immunostaining in 29-week FAT liver. White arrowheads denote double positive cell. (G) Colocalization quantification utilizing JaCOP (n=3 for Chow and 29-week FAT, n=4 for 6- and 12-week FAT), p values from left to right are 0.003937, 0.045497, 0.011004. (H) Flow cytometry of non-parenchymal cells of 24-week FAT liver, gated on singlets, live, CD45 and αSMA+ events. Gating indicates a CD206+ Ki-67 HSC population.

References

    1. Higashi T, Friedman SL, Hoshida Y. Hepatic stellate cells as key target in liver fibrosis. Adv Drug Deliv Rev. Nov 1 2017;121:27–42. doi: 10.1016/j.addr.2017.05.007 - DOI - PMC - PubMed
    1. Tsuchida T [Mechanisms of hepatic stellate cell activation as a therapeutic target for the treatment of non-alcoholic steatohepatitis]. Nihon Yakurigaku Zasshi. 2019;154(4):203–209. doi: 10.1254/fpj.154.203 - DOI - PubMed
    1. Cogliati B, Yashaswini CN, Wang S, Sia D, Friedman SL. Friend or foe? The elusive role of hepatic stellate cells in liver cancer. Nat Rev Gastroenterol Hepatol. Aug 7 2023;doi: 10.1038/s41575-023-00821-z - DOI - PMC - PubMed
    1. Rosenthal SB, Liu X, Ganguly S, et al. Heterogeneity of HSCs in a Mouse Model of NASH. Hepatology. Aug 2021;74(2):667–685. doi: 10.1002/hep.31743 - DOI - PMC - PubMed
    1. Kuilman T, Michaloglou C, Vredeveld LC, et al. Oncogene-induced senescence relayed by an interleukin-dependent inflammatory network. Cell. Jun 13 2008;133(6):1019–31. doi: 10.1016/j.cell.2008.03.039 - DOI - PubMed

Substances