Neuronal Modeling of Cross-Sensory Visual Evoked Magnetoencephalography Responses in the Auditory Cortex
- PMID: 38508715
- PMCID: PMC11044114
- DOI: 10.1523/JNEUROSCI.1119-23.2024
Neuronal Modeling of Cross-Sensory Visual Evoked Magnetoencephalography Responses in the Auditory Cortex
Abstract
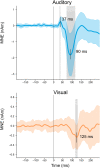
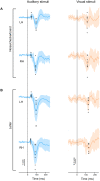
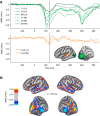
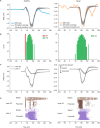
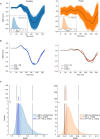
Previous studies have demonstrated that auditory cortex activity can be influenced by cross-sensory visual inputs. Intracortical laminar recordings in nonhuman primates have suggested a feedforward (FF) type profile for auditory evoked but feedback (FB) type for visual evoked activity in the auditory cortex. To test whether cross-sensory visual evoked activity in the auditory cortex is associated with FB inputs also in humans, we analyzed magnetoencephalography (MEG) responses from eight human subjects (six females) evoked by simple auditory or visual stimuli. In the estimated MEG source waveforms for auditory cortex regions of interest, auditory evoked response showed peaks at 37 and 90 ms and visual evoked response at 125 ms. The inputs to the auditory cortex were modeled through FF- and FB-type connections targeting different cortical layers using the Human Neocortical Neurosolver (HNN), which links cellular- and circuit-level mechanisms to MEG signals. HNN modeling suggested that the experimentally observed auditory response could be explained by an FF input followed by an FB input, whereas the cross-sensory visual response could be adequately explained by just an FB input. Thus, the combined MEG and HNN results support the hypothesis that cross-sensory visual input in the auditory cortex is of FB type. The results also illustrate how the dynamic patterns of the estimated MEG source activity can provide information about the characteristics of the input into a cortical area in terms of the hierarchical organization among areas.
Keywords: MEG; computational modeling; cross-sensory; feedforward/feedback.
Copyright © 2024 the authors.
Conflict of interest statement
The authors declare no competing financial interests.
Figures



Update of
-
Neuronal modeling of magnetoencephalography responses in auditory cortex to auditory and visual stimuli.bioRxiv [Preprint]. 2024 Feb 13:2023.06.16.545371. doi: 10.1101/2023.06.16.545371. bioRxiv. 2024. Update in: J Neurosci. 2024 Apr 24;44(17):e1119232024. doi: 10.1523/JNEUROSCI.1119-23.2024. PMID: 37398025 Free PMC article. Updated. Preprint.
Similar articles
-
Neuronal modeling of magnetoencephalography responses in auditory cortex to auditory and visual stimuli.bioRxiv [Preprint]. 2024 Feb 13:2023.06.16.545371. doi: 10.1101/2023.06.16.545371. bioRxiv. 2024. Update in: J Neurosci. 2024 Apr 24;44(17):e1119232024. doi: 10.1523/JNEUROSCI.1119-23.2024. PMID: 37398025 Free PMC article. Updated. Preprint.
-
Quantitative analysis and biophysically realistic neural modeling of the MEG mu rhythm: rhythmogenesis and modulation of sensory-evoked responses.J Neurophysiol. 2009 Dec;102(6):3554-72. doi: 10.1152/jn.00535.2009. Epub 2009 Oct 7. J Neurophysiol. 2009. PMID: 19812290 Free PMC article.
-
Onset timing of cross-sensory activations and multisensory interactions in auditory and visual sensory cortices.Eur J Neurosci. 2010 May;31(10):1772-82. doi: 10.1111/j.1460-9568.2010.07213.x. Eur J Neurosci. 2010. PMID: 20584181 Free PMC article.
-
How do neurons work together? Lessons from auditory cortex.Hear Res. 2011 Jan;271(1-2):37-53. doi: 10.1016/j.heares.2010.06.006. Epub 2010 Jul 11. Hear Res. 2011. PMID: 20603208 Free PMC article. Review.
-
Fetal neurological assessment using noninvasive magnetoencephalography.Clin Perinatol. 2009 Sep;36(3):701-9. doi: 10.1016/j.clp.2009.07.003. Clin Perinatol. 2009. PMID: 19732622 Free PMC article. Review.
Cited by
-
HNN-core: A Python software for cellular and circuit-level interpretation of human MEG/EEG.J Open Source Softw. 2023;8(92):5848. doi: 10.21105/joss.05848. Epub 2023 Dec 15. J Open Source Softw. 2023. PMID: 38939123 Free PMC article.
-
Onset timing of letter processing in auditory and visual sensory cortices.Front Integr Neurosci. 2024 Nov 14;18:1427149. doi: 10.3389/fnint.2024.1427149. eCollection 2024. Front Integr Neurosci. 2024. PMID: 39610979 Free PMC article.
-
Tactile stimulations reduce or promote the segregation of auditory streams: psychophysics and modeling.PLoS Comput Biol. 2025 Aug 18;21(8):e1012701. doi: 10.1371/journal.pcbi.1012701. eCollection 2025 Aug. PLoS Comput Biol. 2025. PMID: 40825077 Free PMC article.
References
Publication types
MeSH terms
Grants and funding
LinkOut - more resources
Full Text Sources
