. 2024 Mar 20;15(1):2498.
doi: 10.1038/s41467-024-46504-4.

Metabolic targeting of cancer associated fibroblasts overcomes T-cell exclusion and chemoresistance in soft-tissue sarcomas

Affiliations

Metabolic targeting of cancer associated fibroblasts overcomes T-cell exclusion and chemoresistance in soft-tissue sarcomas

Marina T Broz et al. Nat Commun. .

Abstract

T cell-based immunotherapies have exhibited promising outcomes in tumor control; however, their efficacy is limited in immune-excluded tumors. Cancer-associated fibroblasts (CAFs) play a pivotal role in shaping the tumor microenvironment and modulating immune infiltration. Despite the identification of distinct CAF subtypes using single-cell RNA-sequencing (scRNA-seq), their functional impact on hindering T-cell infiltration remains unclear, particularly in soft-tissue sarcomas (STS) characterized by low response rates to T cell-based therapies. In this study, we characterize the STS microenvironment using murine models (in female mice) with distinct immune composition by scRNA-seq, and identify a subset of CAFs we termed glycolytic cancer-associated fibroblasts (glyCAF). GlyCAF rely on GLUT1-dependent expression of CXCL16 to impede cytotoxic T-cell infiltration into the tumor parenchyma. Targeting glycolysis decreases T-cell restrictive glyCAF accumulation at the tumor margin, thereby enhancing T-cell infiltration and augmenting the efficacy of chemotherapy. These findings highlight avenues for combinatorial therapeutic interventions in sarcomas and possibly other solid tumors. Further investigations and clinical trials are needed to validate these potential strategies and translate them into clinical practice.


Conflict of interest statement

The authors declare no competing interests.

Figures

Fig. 1
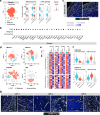
Fig. 1. Sarcoma mouse models recapitulate immune-excluded and -infiltrated TME.
a GSEA Pathway enrichment analysis of RNA-seq data from 251 sarcoma patient samples which were stratified based on CCNE1-high vs. unaltered expression (n = 16; 235) or VGLL3-high vs. unaltered expression (n = 8; 243). b Overview of platform for modeling tumorigenesis utilizing murine mesenchymal stem cells (MSCs) isolated from p53KO mice. c Flow cytometry analysis of the proportion of infiltrating CD45+ immune cells of total cells. Relative proportions of tumor infiltrating immune cells: CD4+ and CD8+ T cells, tumor associated macrophage (TAM), monocytes, and NK cells (n = 9 Ccne1+; n = 10 Vgll3+ mice). d Immunofluorescence staining of CD8+ T cells (green) and CD4+ T cells (red) (Scale bars 500 μm (top) and 100 μm (bottom)). Images are representative of three independent experiments with n = 4 mice. e, f Quantifications of CD8+ and CD4+ cells/field in ROIs encompassing the tumor margin or the tumor parenchyma (n = 8 ROIs from n = 3 mice). g, h Tumor growth following treatment with doxorubicin (DOX, 6 mg/kg) in Ccne1+ and Vgll3+ tumor bearing mice. Two-way ANOVA with Tukey’s multiple comparison was used to determine differences between groups (n = 5 mice). Unless otherwise indicated, results are presented as mean ± SEM and p-values are derived by a two-tailed unpaired Student’s t test. Source data are provided as a Source Data file.
Fig. 2
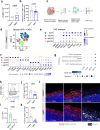
Fig. 2. CAF identified in human sarcoma share similarities with murine sarcoma-associated CAF.
a t-distributed stochastic neighbor embedding (t-SNE) depicting the immune, malignant, and fibroblastic compartments of the mouse UPS tumor mass (Ccne1+, n = 12 individually hashed mice) (left panel). Expression of mesenchymal markers and CAF-specific markers (right panel). b Genes enriched in CAF vs dsRED+ sarcoma cells in murine Ccne1+ tumors. c Multiplex immunohistochemistry staining of CD3 and CD90 at the tumor margin of two Ccne1+ tumors. Images are representative of three independent experiments. d t-distributed stochastic neighbor embedding (t-SNE) depicting the immune, malignant, and CAF compartments of the human sarcomas including two primary uterine leiomyosarcoma (A32, C10), one high grade metastatic leiomyosarcoma (metsLMS), and one primary myxofibrosarcoma (MFS). e Heatmap of the mouse CAF signature and universal fibroblast signature in 4 human sarcoma samples. f Averaged expression of the mouse CAF signature and the LMS signature in the primary LMS samples. g Multiplex immunohistochemistry staining of CD3 and CD90 in three independent human leiomyosarcoma (LMS) cases.
Fig. 3
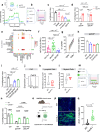
Fig. 3. Glycolytic CAF (glyCAF) are the dominant CAF-subtype in immune excluded tumors.
a Absolute counts of CD90+ CAF by flow cytometry (n = 5 mice). b Quantification of the distance from CD90+ CAF stroma to tumor invasive margin assessed by immunofluorescence staining. Dots represent individual distances from independent CD90+ cells to the tumor margin (n = 16 Ccne1+, n = 13 Vgll3+) taken from n = 3 independent mice. c Schematic of isolation of mouse CAF from Ccne1+ tumors for scRNA-seq (n = 4 mice). d t-SNE depicting 4 major CAF clusters; inflammatory CAF (iCAF), matrix CAF (mCAF), antigen-presenting CAF (apCAF), and glycolytic CAF (glyCAF). e Dot plot of cell-typing markers used to confirm fibroblast identity in CAF clusters. f Expression of top marker genes differentially expressed by the CAF sub-clusters. Box denotes Nt5e (CD73) expression in CAF sub-clusters. g KEGG pathways enriched in the glyCAF cluster. h Flow cytometry gating strategy for glyCAF (CD90+CD73+) and non-glyCAF (CD90+CD73) gated on dsRED CD45 CD31 cells. i Median fluorescence intensity (MFI) of GLUT1 by flow cytometry (n = 8 mice). j Proportions of glyCAF (CD73+ CD90+) by flow cytometry (n = 9 mice). k Quantification of CD73+ CD90+ glyCAF in ROIs encompassing the tumor margin (Ccne1+: n = 13 ROI, Vgll3+: n = 8 ROI from n = 3 mice). l Immunofluorescence of glyCAF (top) and CD8+ T cells (right panel) at the tumor margin. Images are representative of two independent experiments. Unless otherwise indicated, results are presented as mean ± SEM and p-values are derived by a two-tailed unpaired Student’s t test. Source data are provided as a Source Data file.
Fig. 4
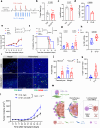
Fig. 4. GLUT1 inhibition targets glycolytic CAF and promotes intratumoral T cell infiltration.
a Glucose uptake of glyCAF quantified by flow cytometry of 2-NBDG (FITC) MFI relative to non-glyCAF (n = 5 mice). b Multiplex immunofluorescence staining of CAF marker CD90 (red) glyCAF marker CD73 (green), and CD3 (white) at the tumor margin. Images are representative of two independent experiments with n = 3 mice. c Quantifications of the number of CD73+ CD90+ cells (glyCAF) in ~1 mm2 ROIs encompassing the tumor margin (Ctrl: n = 17 ROI, GLUT1i: n = 14 ROI from n = 3 mice). d Proportion of CD73+ glyCAF (dsRED, CD45, CD31, CD90+, CD73+) by flow cytometry (n = 10 mice). e Proportion of CD90+ CAF (dsRED, CD45, CD31, CD90+) by flow cytometry (n = 10 mice). f Averaged expression of mCAF, iCAF, glyCAF, and apCAF signature genes (top 10 DEG per cluster) in CAFs from mouse tumors treated with GLUT1i or control (NT) (n = 4 mice). g Immunofluorescence staining of CD8+ cells (green) in Ctrl and GLUT1i treated Ccne1+ tumors (Scale bars 500 μm (top) and 100 μm (bottom)). Images are representative of two independent experiments with n = 3 mice. h Quantifications of CD8+ cells/field in ROIs encompassing the tumor margin or the tumor parenchyma in Ctrl and GLUT1i treated Ccne1+ tumors (n = 3 mice) and i relative proportions of tumor infiltrating CD8+ T cells (CD45+CD8+) cells determined by flow cytometry (n = 10 mice). j Quantifications of CD8+ cells/field in ROIs encompassing the tumor margin or the tumor parenchyma in WT and Glut1-KD tumors (Ctrl, Parenchyma: n = 6 ROI, Margin: n = 7 ROI; GLUT1i, Parenchyma: n = 8, Margin n = 8 ROIs from n = 3 mice) and k relative proportions of tumor infiltrating CD8+ T cells (CD45+CD8+) cells determined by flow cytometry (n = 8 mice). l Multiplex immunofluorescence staining of CAF marker CD90 (red), glyCAF marker CD73 (green), and CD8 (white) at the tumor margin. White arrows illustrate association between glyCAF and CD8+ T cells. Scale bars 100 μm. Images representative of three independent experiments with n = 3 mice. m Quantifications of the distance to the nearest CD8+ T cell using multiplex immunohistochemistry images. Dots represent individual cell-cell interactions (n = 24 CD73+ CD90+, n = 17 CD73 CD90+, n = 24 CSF1R+) acquired from n = 3 mice each group. P-values determined by one-way ANOVA with Tukey’s multiple comparisons test. Unless otherwise indicated, results are presented as mean ± SEM and p-values are derived by a two-tailed unpaired Student’s t test. Source data are provided as a Source Data file.
Fig. 5
Fig. 5. CXCL16+ glyCAF retain CD8+ T cells at the tumor margin.
a Seahorse metabolic profiling of in vitro CAF. Data shown (n = 3 technical replicates) is representative of three independent experiments. b Schematic of T cell transwell migration assay: bottom chamber containing tumor cells, top chamber containing one of the following: BMDM, tumor, glyCAF or non-glyCAF, seeded with activated CD8+ T cells. c, d Quantification of migrated CD8+ T cells. The x-axis refers to the cell-type in the upper chamber of the transwell system, certain cultures treated with GLUT1i (BAY-876, 75 uM). Representative data from one experiment shown out of three total experiments (n = 6 Ctrl, n = 6 BMDM, n = 4 Tumor, n = 5 glyCAF, n = 6 non-glyCAF) and (n = 6 WT glyCAF, and n = 6 non-glyCAF). p-values determined by two-way ANOVA with Tukey’s multiple comparison. e Predicted ligand-receptor interaction scores of CXCL16-CXCR6 signaling pathway (averaged expression from n = 4 mice). Data shown is representative of three total experiments. f Median fluorescence intensity (MFI) of CXCL16 (n = 14 mice). g Proportion of T cells expressing CXCR6 (n = 9 mice). h Median fluorescence intensity (MFI) of CXCL16 in glyCAF (in vitro). Dots correspond to n = 3 technical replicates from one experiment are shown out of three with a similar trend. i Migration index of CD8+ T cells cultured with glyCAF. p-values are presented as determined by one-way ANOVA with Fisher’s LSD. Representative data from one experiment is shown out of three (n = 3 biological replicates). j Cxcl16 expression in CD90+ CAF. k Expression of Cxcr6 mRNA in lymphoid cells from GLUT1i and control (NT) tumors (n = 5 mice). l Expression of Cxcl16 mRNA in myeloid cells from GLUT1i and control (NT) tumors (n = 5 mice). m Schematic of T cell transwell migration assay with WT or Cxcr6−/− CD8+ T cells. n Migration index of WT or Cxcr6−/− T cells cultured in transwell in the presence of glyCAF. Dots correspond to n = 4 biological replicates from one experiment out of two with a similar trend. p-values are presented as determined by two-way ANOVA with Tukey’s multiple comparison test. o Schematic of adoptive transfer experiment. p Multiplex IHC staining of transferred WT OT-1 (CD45.1) and Cxcr6−/− (CD90.1). Scale bars 500 μm. Image representative of n = 4 mice. q Quantification of transferred OT-1 T cells by IHC. n = 25 ROIs (WT) and n = 23 s ROI (Cxcr6−/−) from n = 4 mice. Unless otherwise indicated, results are presented as mean ± SEM and p-values derived by two-tailed unpaired Student’s t test. Source data are provided as a Source Data file.
Fig. 6
Fig. 6. GLUT1 inhibition facilitates chemotherapy response.
a Treatment timeline for Doxorubicin (DOX, D) and GLUT1 inhibition (GLUT1i, G). b Tumor mass measured in grams of GLUT1i treated tumors (n = 10 mice). c Flow cytometry proportions of dsRED+ tumor cells in GLUT1i treated tumors (n = 10 mice). d Flow cytometry proportions of dsRED+ tumor cells in DOX (D) or DOX+GLUT1i (D + G) treated tumors (n = 3 mice). e Tumor bearing mice were treated with DOX (6 mg/kg) with or without GLUT1i (5 mg/kg) for 9 days. Tumor volume was measured every 2–3 days. Two-way ANOVA with Tukey’s multiple comparison was used to determine differences in tumor growth between groups (n = 8 mice). f Kaplan-Meier survival curve for DOX+GLUT1i treated mice (n = 5 mice). Log-rank test was used to determine differences in survival between groups. g Proportions of CD4+ and CD8+ T cells assessed by flow cytometry (n = 5 mice). h Proportion of PD1+ CD8+ T cells by flow cytometry (n = 5 mice). i, j Immunofluorescence staining of CD8+ cells (green) and Granzyme B (red) infiltrating the tumor margin and parenchyma and quantifications of the number of CD8+ cells in ~1 mm2 ROIs encompassing the tumor margin and parenchyma of DOX or DOX+GLUT1i treated Ccne1+ tumor bearing mice (D, Parenchyma: n = 9 ROI, Margin: n = 10 ROI; D + G, Parenchyma: n = 10 ROI, Margin, n = 10 ROI from n = 3 mice). k Quantifications of CD8+ GZMB+ cells in the tumor parenchyma (n = 11 ROIs from n = 3 mice). l Ccne1+ tumor-bearing mice, with or without anti-CD8a neutralizing antibody treatment, received 9 days of combination DOX+GLUT1i treatment. Tumor volume was monitored every 2–3 days. Two-way ANOVA with Tukey’s multiple comparison was used to determine differences between groups (n = 5 mice). m Schematic illustrating synergistic T-cell dependent effect of GLUT1i and DOX promotes anti-tumor immunity. Unless otherwise indicated, results are presented as mean ± SEM and p-values are derived by a two-tailed Student’s t test. Source data are provided as a Source Data file.

References

    1. Chen L, Han X. Anti–PD-1/PD-L1 therapy of human cancer: past, present, and future. J. Clin. Investig. 2015;125:3384–3391. doi: 10.1172/JCI80011. - DOI - PMC - PubMed
    1. Cappell, K. M. & Kochenderfer, J. N. Long-term outcomes following CAR T cell therapy: what we know so far. Nat. Rev. Clin. Oncol. 20, 359–371 (2023). - PMC - PubMed
    1. Ren H, et al. A novel immune-related gene signature predicting survival in sarcoma patients. Mol. Ther. Oncol. 2021;24:114–126. doi: 10.1016/j.omto.2021.12.007. - DOI - PMC - PubMed
    1. Feig C, et al. Targeting CXCL12 from FAP-expressing carcinoma-associated fibroblasts synergizes with anti-PD-L1 immunotherapy in pancreatic cancer. Proc. Natl Acad. Sci. 2013;110:20212–20217. doi: 10.1073/pnas.1320318110. - DOI - PMC - PubMed
    1. Grout, J. A. et al. Spatial positioning and matrix programs of cancer-associated fibroblasts promote t-cell exclusion in human lung tumors. Cancer Discov. 12, 2606–2625 (2022). - PMC - PubMed