. 2024 Mar 20;15(1):2486.
doi: 10.1038/s41467-024-46703-z.

Extended stop codon context predicts nonsense codon readthrough efficiency in human cells

Affiliations

Extended stop codon context predicts nonsense codon readthrough efficiency in human cells

Kotchaphorn Mangkalaphiban et al. Nat Commun. .

Abstract

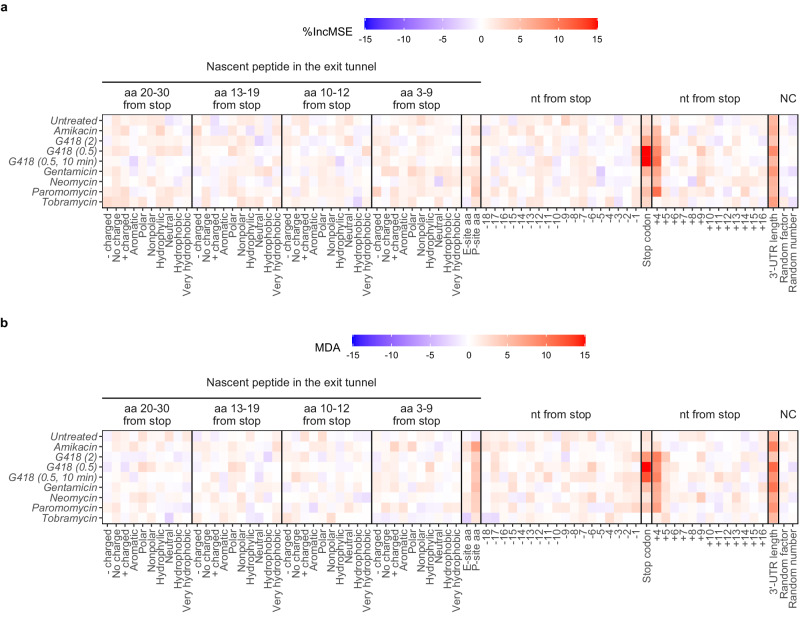
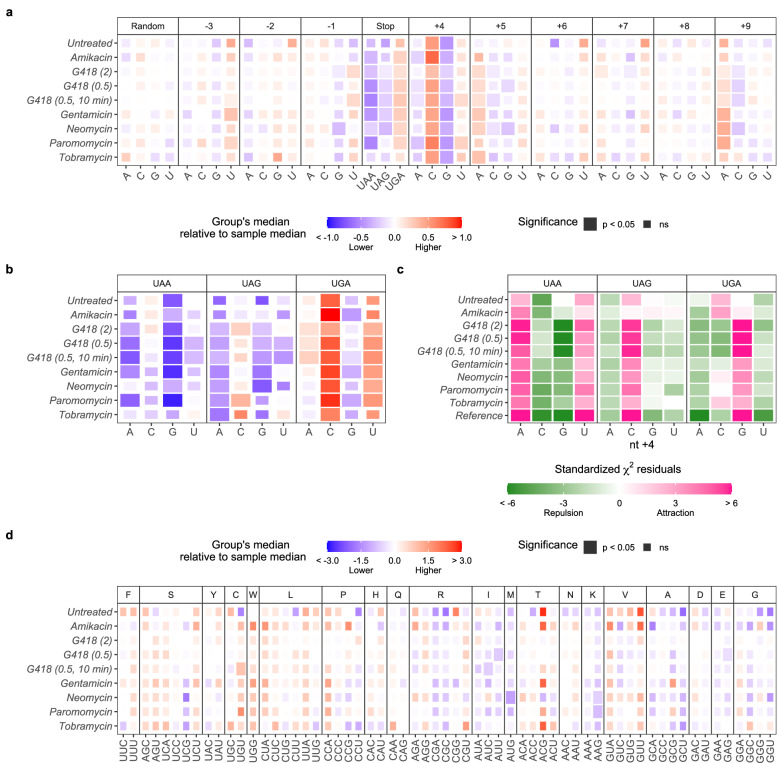
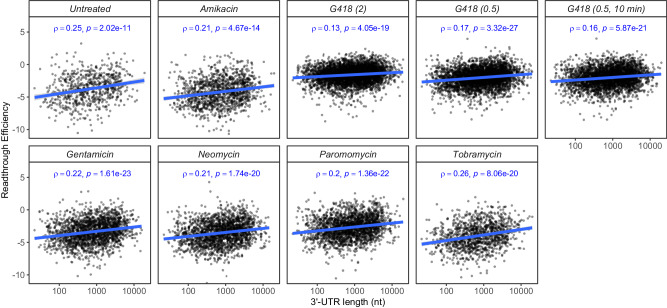
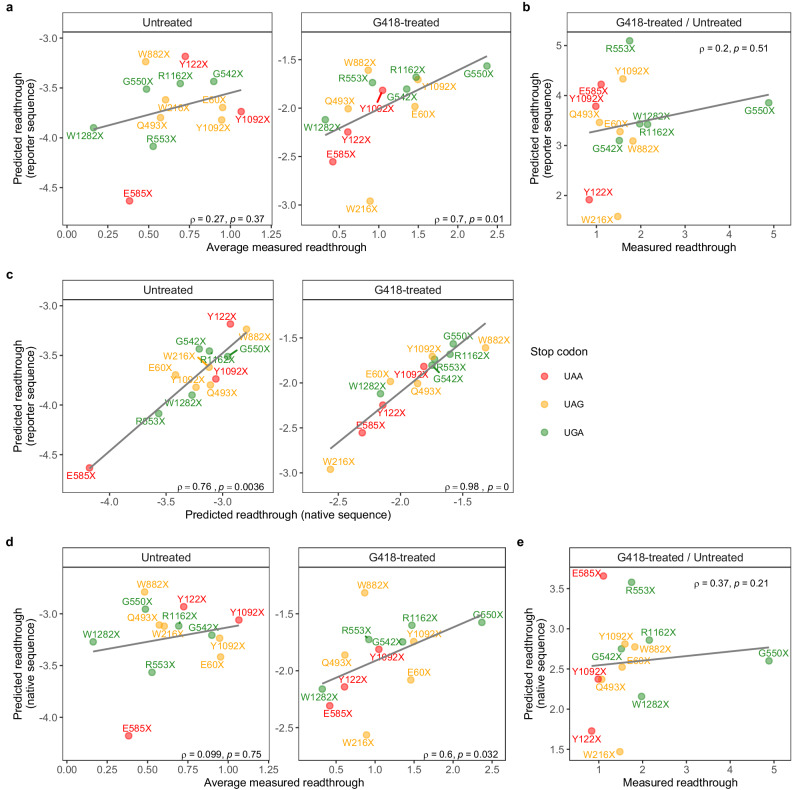
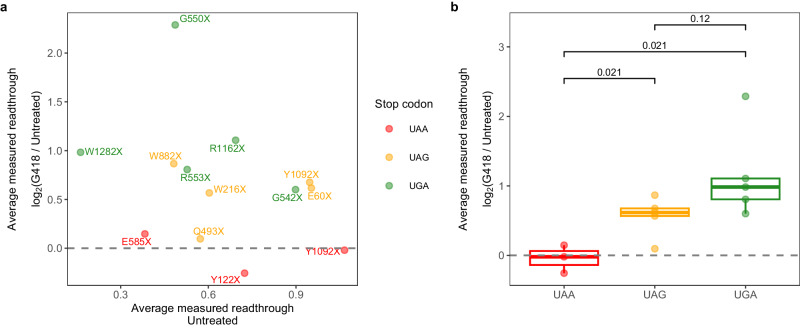
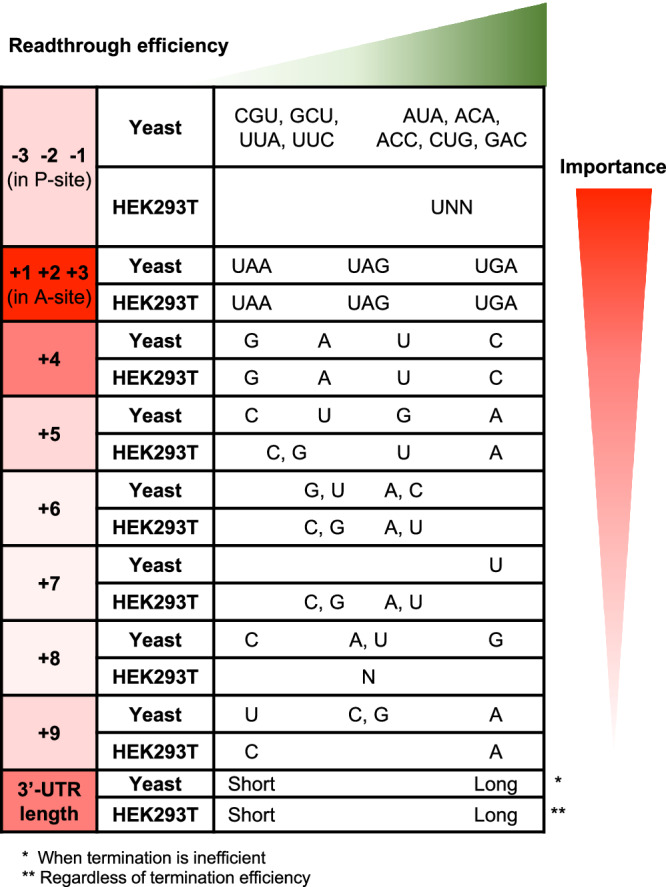
Protein synthesis terminates when a stop codon enters the ribosome's A-site. Although termination is efficient, stop codon readthrough can occur when a near-cognate tRNA outcompetes release factors during decoding. Seeking to understand readthrough regulation we used a machine learning approach to analyze readthrough efficiency data from published HEK293T ribosome profiling experiments and compared it to comparable yeast experiments. We obtained evidence for the conservation of identities of the stop codon, its context, and 3'-UTR length (when termination is compromised), but not the P-site codon, suggesting a P-site tRNA role in readthrough regulation. Models trained on data from cells treated with the readthrough-promoting drug, G418, accurately predicted readthrough of premature termination codons arising from CFTR nonsense alleles that cause cystic fibrosis. This predictive ability has the potential to aid development of nonsense suppression therapies by predicting a patient's likelihood of improvement in response to drugs given their nonsense mutation sequence context.


Conflict of interest statement

A.J. is co-founder, director, and consultant for PTC Therapeutics Inc. D.B., K.M., L.F., M.D., K.T., and K.K. declare no competing interests.

Figures

Fig. 1
Fig. 1. mRNA features predictive of readthrough efficiency.
Feature importance scores, % increase in mean square error (%IncMSE) for regression (a), and mean decrease accuracy (MDA) for classification (b) were extracted from random forest models. The higher the feature importance score (red), the more important a feature is in predicting readthrough efficiency or distinguishing between “high” and “low” readthrough mRNAs. Numbers or categorical values randomly assigned to the mRNAs are used as negative controls (“NC”) and to set the baseline feature importance scores as unimportant features. aa amino acid, nt nucleotide. Source data are provided as a Source Data file.
Fig. 2
Fig. 2. Effects of the stop codon and flanking nucleotide identities on readthrough efficiency.
a, b, d Differences between median readthrough efficiency of all mRNAs in the sample and median readthrough efficiency of a group of mRNAs containing particular stop codon or nucleotide (a), stop codon with nt +4 as quadruplet (b), or triplet codon in the ribosomal P-site (d). Positive (red) and negative (blue) values indicate that the group of mRNAs had higher and lower median readthrough efficiency compared to the sample median, respectively. Two-tailed Wilcoxon’s rank sum test with the Benjamini–Hochberg method for multiple testing correction was used to determine whether the difference was significant. c Standardized residuals of two-tailed χ2 test of independence determining association between stop codon and nt +4 identities. Positive residuals (pink) indicate that the pair occurs together more often than expected (attraction), while negative residuals (green) are less often than expected (repulsion). For all panels, a significant result (p < 0.05) is represented as a larger tile. Source data, the exact p-values, and the number of data points (n) in each group are provided as a Source Data file.
Fig. 3
Fig. 3. Readthrough efficiency increases with 3’-UTR length.
Readthrough efficiency vs. 3’-UTR length for all mRNAs (that have UTR annotations) in the sample. Two-tailed Spearman’s correlation coefficient (ρ) and the associated p-value are reported for each sample. Source data are provided as a Source Data file.
Fig. 4
Fig. 4. Random forest model can accurately predict the readthrough of CFTR PTC alleles in G418-treated cells.
a Readthrough measured by Dual-Luc assay (average of 4–7 replicates) vs. readthrough predicted by random forest model using CFTR PTC alleles in Dual-Luc reporter’s sequence. b Response to G418 treatment is defined as fold-change of readthrough in G418-treated to untreated condition from (a), measured vs. predicted. c Comparison of two readthrough prediction schemes: predicted using CFTR PTC allele in reporter’s sequence or predicted using CFTR PTC allele’s native sequence. d As in (a), but readthrough was predicted using CFTR PTC allele’s native sequence. e As in (b), but readthrough was predicted using CFTR PTC allele’s native sequence. For all panels, the two-tailed Spearman’s correlation coefficient (ρ) and the associated p-value is reported. Source data are provided as a Source Data file and Supplementary Data 1.
Fig. 5
Fig. 5. UAA PTC alleles do not respond well to G418-treatment.
Response to G418 treatment is defined as log2 fold-change of readthrough for each replicate of G418-treated over the untreated condition and then averaged (4–7 replicates). a Average response to G418 treatment vs. average basal readthrough level in an untreated condition. b Average response to G418 treatment vs. stop codon identity. Box-plot center line, median; lower and upper hinges, first and third quartiles (the 25th and 75th percentile); whiskers, 1.5× interquartile range; points, actual data. Two-tailed Student’s t-test with the Benjamini–Hochberg method for multiple testing correction was used to perform the pairwise comparison. Source data are provided as a Source Data file and Supplementary Data 1.
Fig. 6
Fig. 6. Cis-acting elements modulating readthrough efficiency are mostly conserved between yeast and humans.
Comparison of results analyzed in a similar manner with data from yeast W303 and human HEK293T cells. mRNA features are shaded based on relative importance in readthrough efficiency prediction (red shading). The details of how each feature inhibits or promotes readthrough are ordered from left to right (green shading).

Similar articles

Cited by

References

    1. Hellen CUT. Translation termination and ribosome recycling in eukaryotes. Cold Spring Harb. Perspect. Biol. 2018;10:a032656. doi: 10.1101/cshperspect.a032656. - DOI - PMC - PubMed
    1. Schuller AP, Green R. Roadblocks and resolutions in eukaryotic translation. Nat. Rev. Mol. Cell Biol. 2018;19:526–541. doi: 10.1038/s41580-018-0011-4. - DOI - PMC - PubMed
    1. Dabrowski M, Bukowy-Bieryllo Z, Zietkiewicz E. Translational readthrough potential of natural termination codons in eucaryotes – The impact of RNA sequence. RNA Biol. 2015;12:950–958. doi: 10.1080/15476286.2015.1068497. - DOI - PMC - PubMed
    1. Rodnina MV, et al. Translational recoding: canonical translation mechanisms reinterpreted. Nucleic Acids Res. 2020;48:1056–1067. doi: 10.1093/nar/gkz783. - DOI - PMC - PubMed
    1. Welch EM, et al. PTC124 targets genetic disorders caused by nonsense mutations. Nature. 2007;447:87–91. doi: 10.1038/nature05756. - DOI - PubMed