. 2024 Mar 20;15(1):2491.
doi: 10.1038/s41467-024-46861-0.

Dynamics of accessible chromatin regions and subgenome dominance in octoploid strawberry

Affiliations

Dynamics of accessible chromatin regions and subgenome dominance in octoploid strawberry

Chao Fang et al. Nat Commun. .

Abstract

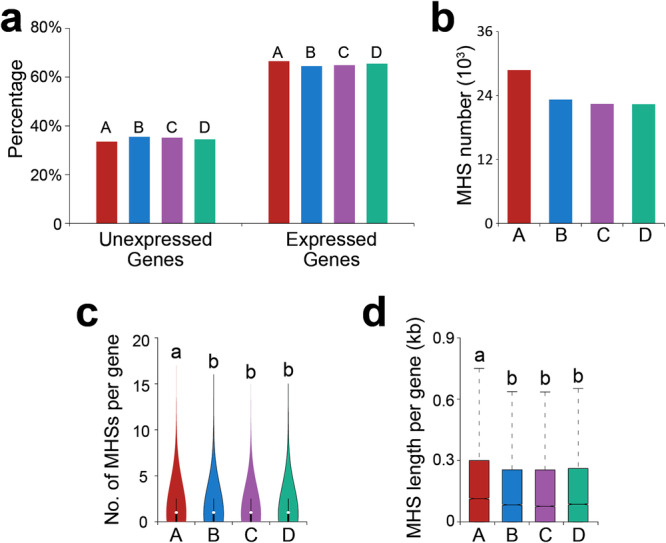
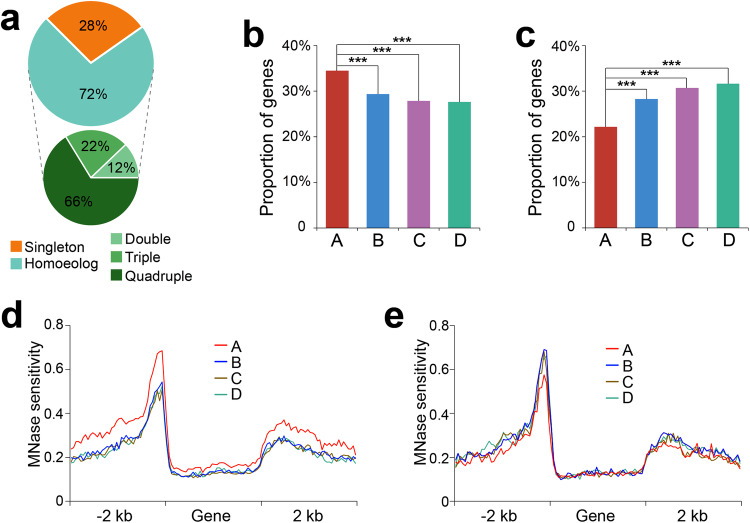
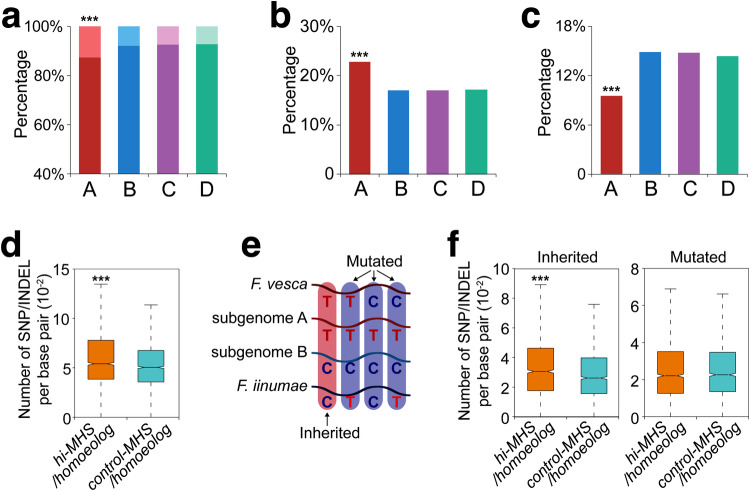
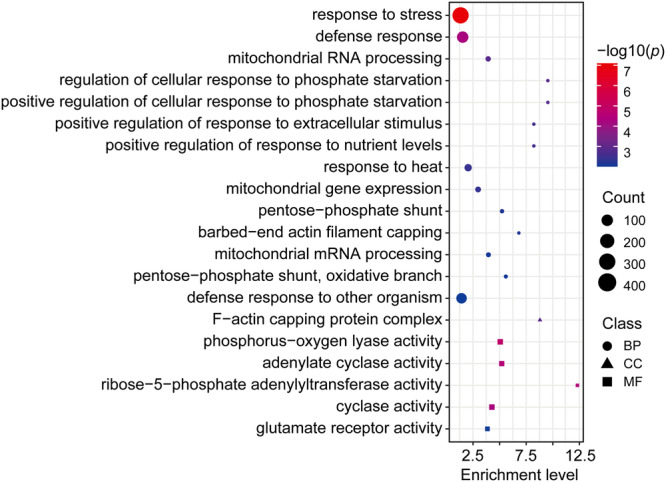
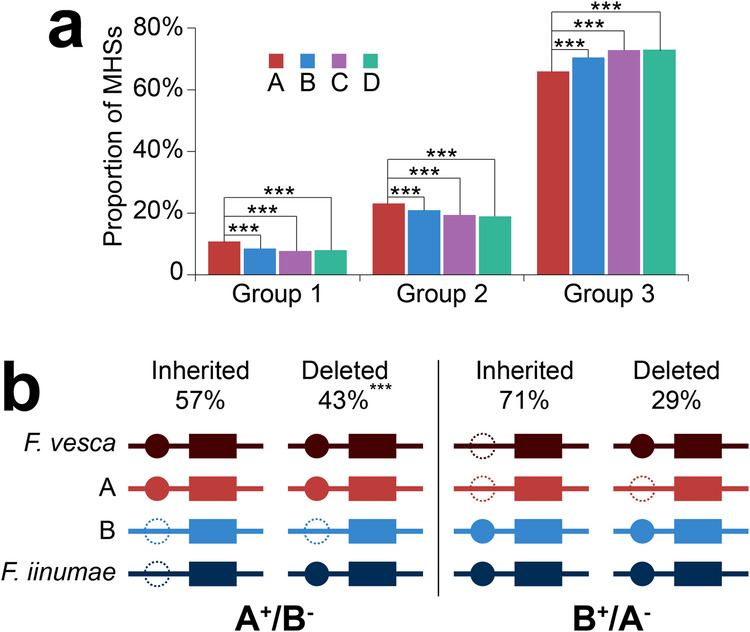
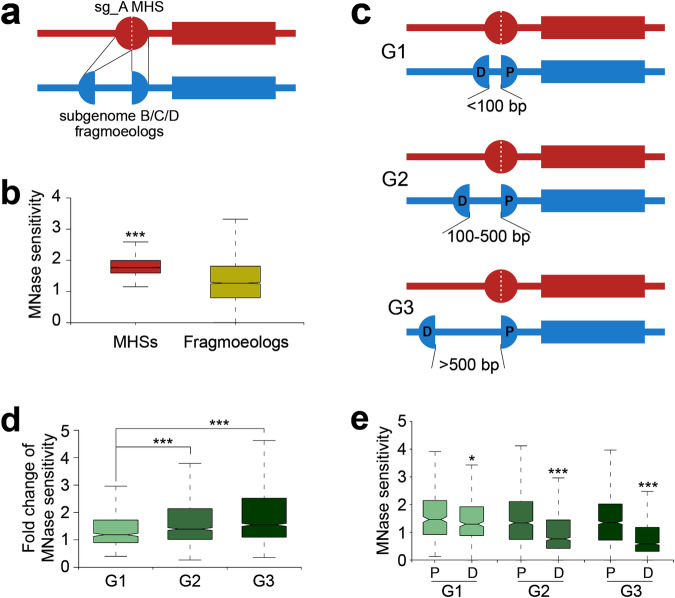
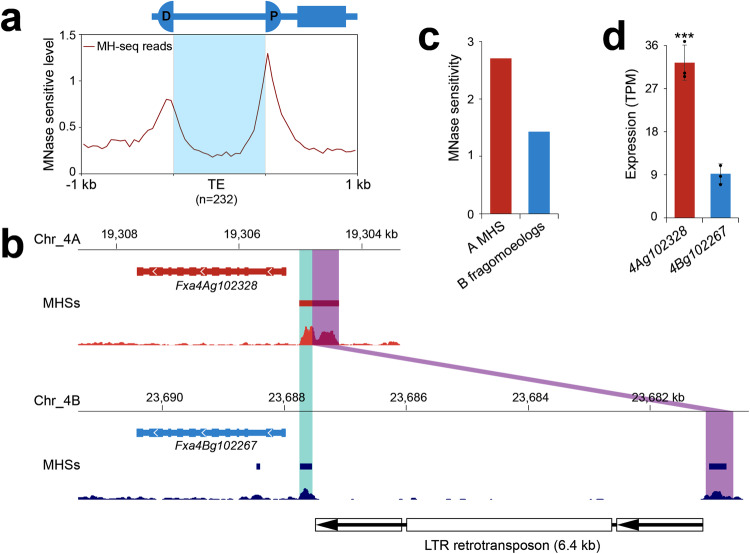
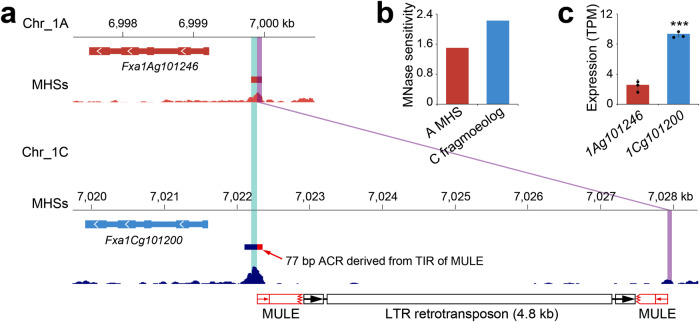
Subgenome dominance has been reported in diverse allopolyploid species, where genes from one subgenome are preferentially retained and are more highly expressed than those from other subgenome(s). However, the molecular mechanisms responsible for subgenome dominance remain poorly understood. Here, we develop genome-wide map of accessible chromatin regions (ACRs) in cultivated strawberry (2n = 8x = 56, with A, B, C, D subgenomes). Each ACR is identified as an MNase hypersensitive site (MHS). We discover that the dominant subgenome A contains a greater number of total MHSs and MHS per gene than the submissive B/C/D subgenomes. Subgenome A suffers fewer losses of MHS-related DNA sequences and fewer MHS fragmentations caused by insertions of transposable elements. We also discover that genes and MHSs related to stress response have been preferentially retained in subgenome A. We conclude that preservation of genes and their cognate ACRs, especially those related to stress responses, play a major role in the establishment of subgenome dominance in octoploid strawberry.


Conflict of interest statement

The authors declare no competing interests.

Figures

Fig. 1
Fig. 1. Gene expression and chromatin accessibility associated with the four subgenomes (A, B, C, D) in strawberry.
a Percentage of expressed and non-expressed genes in the four subgenomes. Subgenome A has a lower percentage of non-expressed genes and a higher percentage of expressed genes (A vs. B: p = 2.4e−6; A vs. C: p = 1.2e−4; A vs. D: p = 1.8e–2, two-sided chi-square test). b A total number of MHSs in each subgenome. c Average number of MHSs per gene in each subgenome (nA = 27,398, nB = 25,461, nC = 24,505, nD = 23,911). d Average MHS length per gene in each subgenome (nA = 27,398, nB = 25,461, nC = 24,505, nD = 23,911). The lower and upper boundaries of each box indicate 25th and 75th percentile, the center line indicates the median, and the whiskers extend to 1.5× IQR. In (c, d), the total number of MHSs and MHS length were normalized in the four subgenomes by dividing to the total number of genes from each subgenome. Means that do not share a letter are significantly different (p < 0.01, one-way ANOVA with Games-Howell post-hoc test). Source data are provided as a Source Data file.
Fig. 2
Fig. 2. Chromatin accessibility and its impact on transcriptional divergence of homoeologous genes.
a The proportion of genes from subgenome A with or without homoeologs identified in B/C/D subgenomes. Singleton indicates genes that do not have a homoeolog from any of the other three subgenomes. Homoeolog indicates genes that have homoeologs from at least one of the other three subgenomes. Double, triple, and quadruple indicate genes that have one, two, and three homoeologs, respectively. b Proportion of gene from subgenome A showing higher expression than at least one of its homoeologs (A vs. B, C or D: p < 2.2e−16). c Proportion of gene from subgenome A showing lower expression than at least one of its homoeologs (A vs. B, C or D: p < 2.2e−16). d MH-seq profiles of the highly expressed genes from subgenome A (n = 778) and their homoeologs from B, C, and D subgenomes. e MH-seq profiles of the lowly expressed genes from subgenome A (n = 397) and their homoeologs from B, C, and D subgenomes. ***p < 0.001, two-sided chi-square test. Source data are provided as a Source Data file.
Fig. 3
Fig. 3. Sequence variation and MHS divergence.
a Proportions of syntenic MHSs and singleton MHSs from the four subgenomes. MHSs with a homoeolog from at least one of the other three subgenomes are referred to as syntenic MHSs, which are indicated by a darker color. MHSs without a homoeolog from any of the other three subgenomes are referred to as singleton MHSs, which are indicated by a lighter color. Subgenome A has a higher percentage of singleton MHSs compared to subgenome B/C/D (A vs. B, C or D: p < 2.2e−16). b Proportion of MHSs showing significantly higher MNase sensitivity than at least one of its homoeologs. Subgenome A has a higher percentage of hi-MHSs compared to subgenome B/C/D (A vs. B, C or D: p < 2.2e−16). c Proportion of MHSs showing significantly lower MNase sensitivity than at least one of its homoeologs. Subgenome A has a lower percentage of lo-MHSs compared to subgenome B/C/D (A vs. B, C or D: p < 2.2e−16). d Numbers of SNPs/INDELs identified in hi-MHS (A, n = 2034)/homoeolog (B, n = 2034) pairs and control-MHS (A, n = 2034)/homoeolog (B, n = 2034) pairs (p = 3.5e−10). The number of SNP/INDEL was normalized by dividing to the alignment length between MHS and its homoeolog. e Identification of two types (inherited and mutated) of SNP/INDEL between an MHS from A subgenome and its homoeolog from B subgenome. Each row represents four different possibilities of a “T/C” SNP in subgenomes A and B, and in the two diploid progenitor species. Each vertical column illustrates a specific combination of the SNP from four sequence sources, which determine if the SNP was inherited from the diploid progenitor or arose after polyploidization. f The number of two types of SNP/INDEL in hi-MHS (A, n = 1726)/homoeolog (B, n = 1726) pairs and control-MHS (A, n = 1726)/homoeolog (B, n = 1726) pairs (Inherited: p = 3.8e−8; Mutated: p = 0.64). The number of SNP/INDEL was normalized by dividing to the overlapped length between an MHS and its homoeolog. The lower and upper boundaries of each box indicate 25th and 75th percentile, the center line indicates the median, and the whiskers extend to 1.5 × IQR in (df). ***p < 0.001, two-sided chi-square test (ac) and Mann–Whitney U test (d and f). Source data are provided as a Source Data file.
Fig. 4
Fig. 4. GO terms enriched in subgenome A-specific genes.
BP biological process, CC cellular component, MF molecular function. The significance was assessed using the Fisher exact test (−log10) with adjusted p-values calculated by the Benjamini–Hochberg (BH) method. Source data are provided as a Source Data file.
Fig. 5
Fig. 5. MHSs identified in four subgenomes and the origin of subgenome A/B-specific MHSs.
a The proportions of three groups of syntenic MHSs. Group 1 MHSs lost their homoeologs in two of the other three subgenomes (A vs. B, C or D: p < 2.2e−16); Group2 MHSs lost their homoeologs in one of the other three subgenomes (A vs. B: p = 1.3e−8; A vs. C or D: p < 2.2e−16); Group 3 MHSs have homoeologs in all other three subgenomes (A vs. B, C or D: p < 2.2e−16). b Origins of subgenome A/B-specific MHSs. A+/B−: subgenome A-specific MHSs, which do not have a homoeolog in subgenome B. B+/A−: subgenome B-specific MHSs, which do not have a homoeolog in subgenome A. Inherited: a subgenome-specific MHS was inherited from its progenitor species. Deleted: a subgenome A (B)-specific MHS is generated due to loss of its homoeologous B (A) sequence after polyploidization. Solid circles indicate MHSs and rectangles indicate their cognate genes. Dotted circles indicate loss of the homoeologs. ***p < 0.001, two-sided chi-square test. Source data are provided as a Source Data file.
Fig. 6
Fig. 6. MHS fragmentation and its impact on subgenome dominance.
a A schematic illustration of an MHS in subgenome A and its fragmented homoeologs in subgenomes B/C/D. The rectangles indicate a pair of homoeologous genes associated with the MHS and the fragmented homoeologs. b Comparison of MNase sensitivity between subgenome A MHSs (n = 3792) and their fragmented homoeologs from B/C/D subgenomes (n = 7883, p < 2.2e−16). The number of MH-seq reads associated with MHSs or their fragmented homoeologs were used to represent MNase sensitivity. c A schematic illustration of two fragmented homoeologs separated by different distances. D: distal homoeolog; P: proximal homoeolog. d Impact of the distance between two fragmented homoeologs on MNase sensitivity change between the MHSs and their fragmented homoeologs (ng1 = 511; ng2 = 1289; ng3 = 1712, G1 vs. G2: p = 1.1e−11; G1 vs. G3: p < 2.2e−16; G2 vs. G3: p = 8e−8). e Comparison of the MNase sensitivity levels between proximal and distal homoeologs with different distances (G1: p = 2.5e−2; G2: p < 2.2e−16; G3: p < 2.2e−16). The lower and upper boundaries of each box indicate 25th and 75th percentile, the center line indicates the median, and the whiskers extend to 1.5× IQR in (b) and (e). ***p < 0.001, two-sided Mann–Whitney U test. Source data are provided as a Source Data file.
Fig. 7
Fig. 7. Fragmentation of MHSs and impact on expression of cognate gene.
a MNase sensitivity levels across TEs (n = 232) inserted in MHSs associated with subgenomes B/C/D. Each TE and its 1 kb flanking regions were divided into 20 bins. The MNase sensitivity level is represented by the number of MH-seq reads normalized by the length of each bin. b Identification of an MHS associated with gene Fxa4Ag102328 in subgenome A and its fragmoeologs in subgenome B. The fragmentation in subgenome B was caused by insertion of an LTR retrotransposon in the middle of the MHS. Cyan and purple boxes indicate the MHS in chromosome 4A and its fragmoeologs in chromosome 4B. c Comparison of MNase sensitivity between the MHS and its fragmented homoeologs. MH-seq reads associated with the two homoeologs were combined. MH-seq read numbers were normalized by the sequence length of the MHS or the total length of the two homoeologs. d Comparison of expression levels between Fxa4Ag102328 and Fxa4Bg102267 (p = 3.4e−4). The data are presented as mean ± s.d. (n  =  3 biological replicates). ***p < 0.001, one-tailed t-test. Source data are provided as a Source Data file.
Fig. 8
Fig. 8. A case of enhanced MNase sensitivity of a fragmented MHS and its impact on gene expression.
a Identification of an MHS associated with gene Fxa1Ag101246 in subgenome A and its fragmoeologs in subgenome C. The fragmentation in subgenome C was caused by insertions of two nested TEs where a 4.8 kb-LTR retrotransposon (depicted as black boxes and arrows) inserted into an 800-bp MULE element (depicted as red boxes and arrows). Cyan and purple boxes indicate the MHS in chromosome 1A and its fragmoeologs in chromosome 1C. The red rectangle indicates a 77-bp ACR contributed by the TIR of the MULE element. (b) Comparison of MNase sensitivity between the MHS in subgenome A and the expanded proximal fragmoeolog in subgenome C. MH-seq read numbers were normalized by the sequence length of the two MHSs. c Comparison of the expression levels between Fxa1Ag101246 and Fxa1Cg101200 (p = 6.1e−5). The data are presented as mean ± s.d. (n  =  3 biological replicates). ***p < 0.001, one-tailed t-test. Source data are provided as a Source Data file.

Similar articles

Cited by

References

    1. Ohno, S. Evolution by Gene Duplication. (Springer Berlin, 1970).
    1. Van De Peer Y, Mizrachi E, Marchal K. The evolutionary significance of polyploidy. Nat. Rev. Genet. 2017;18:411–424. doi: 10.1038/nrg.2017.26. - DOI - PubMed
    1. Jiao YN, et al. Ancestral polyploidy in seed plants and angiosperms. Nature. 2011;473:97–100. doi: 10.1038/nature09916. - DOI - PubMed
    1. Comai L. The advantages and disadvantages of being polyploid. Nat. Rev. Genet. 2005;6:836–846. doi: 10.1038/nrg1711. - DOI - PubMed
    1. Osborn TC, et al. Understanding mechanisms of novel gene expression in polyploids. Trends Genet. 2003;19:141–147. doi: 10.1016/S0168-9525(03)00015-5. - DOI - PubMed