. 2024 Mar 20;10(1):25.
doi: 10.1038/s41522-024-00486-9.

Lactobacillus rhamnosus GG ameliorates hyperuricemia in a novel model

Affiliations

Lactobacillus rhamnosus GG ameliorates hyperuricemia in a novel model

Yang Fu et al. NPJ Biofilms Microbiomes. .

Abstract

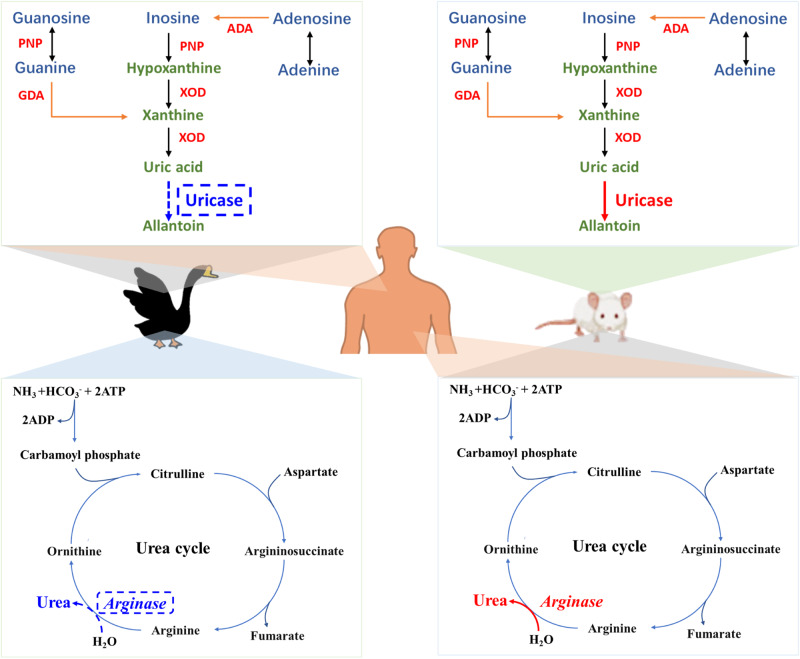
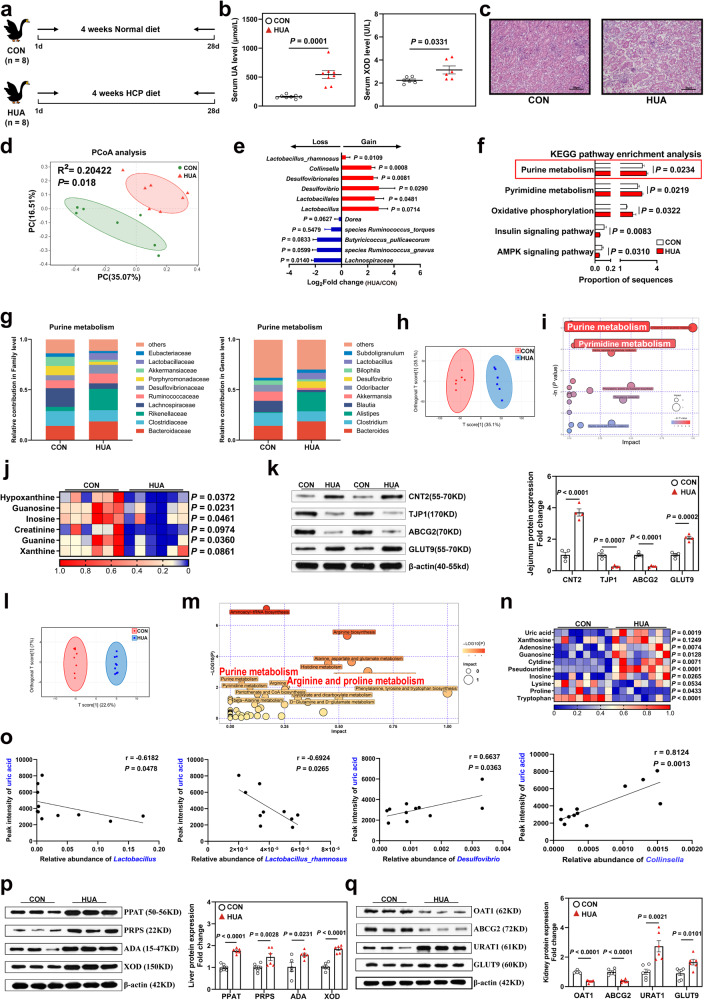
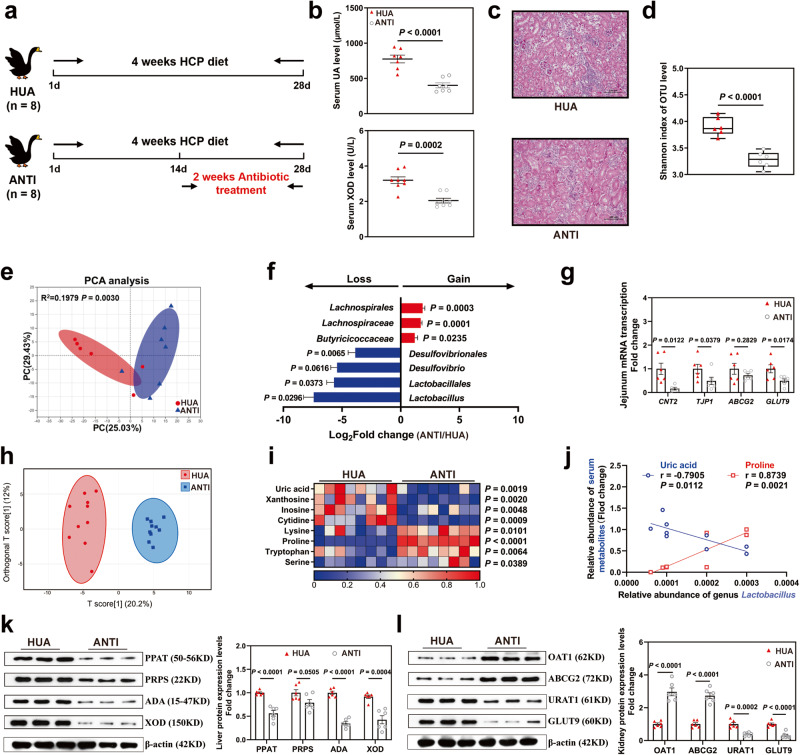
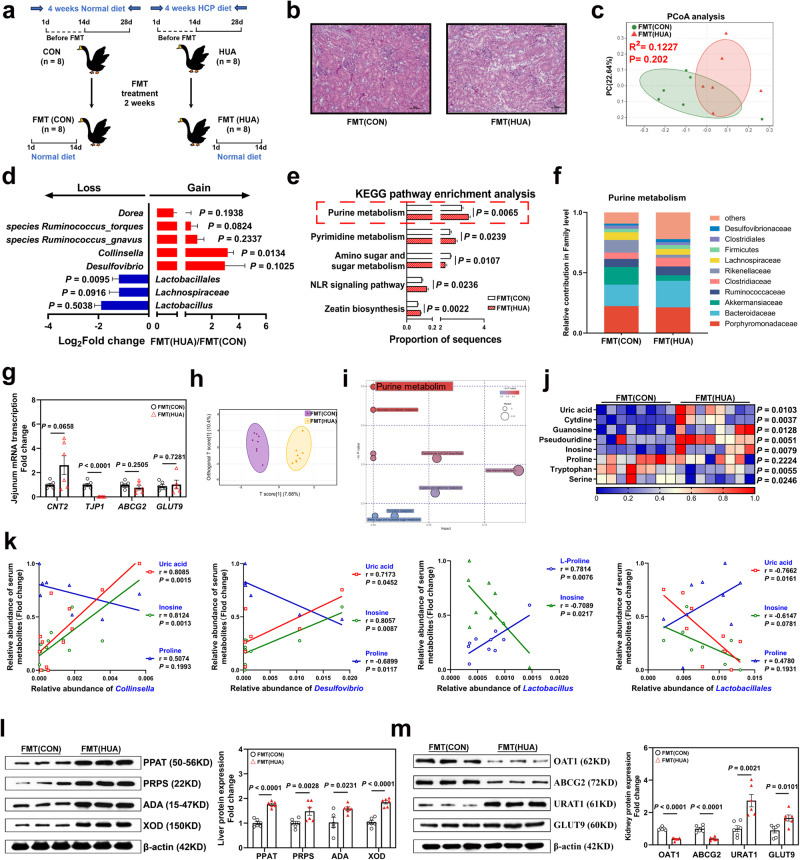
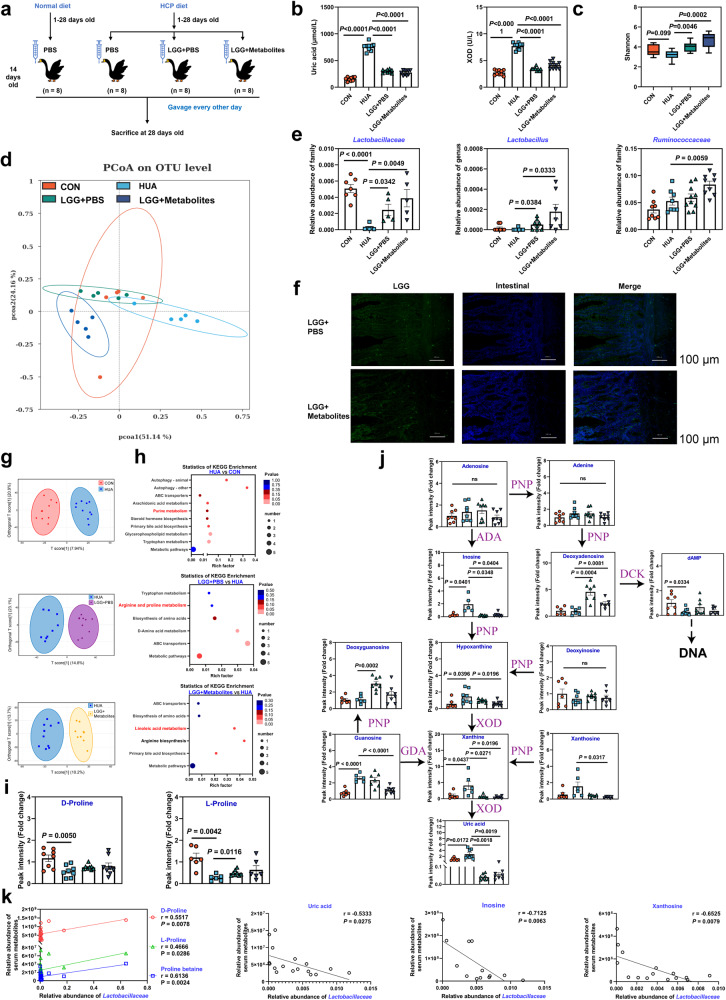
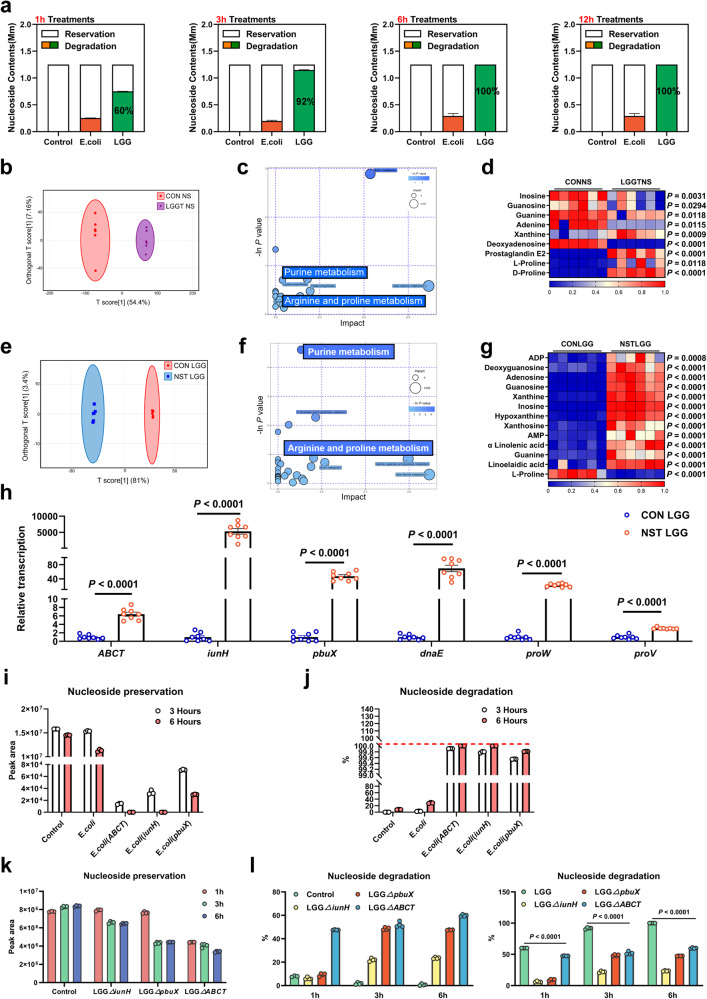
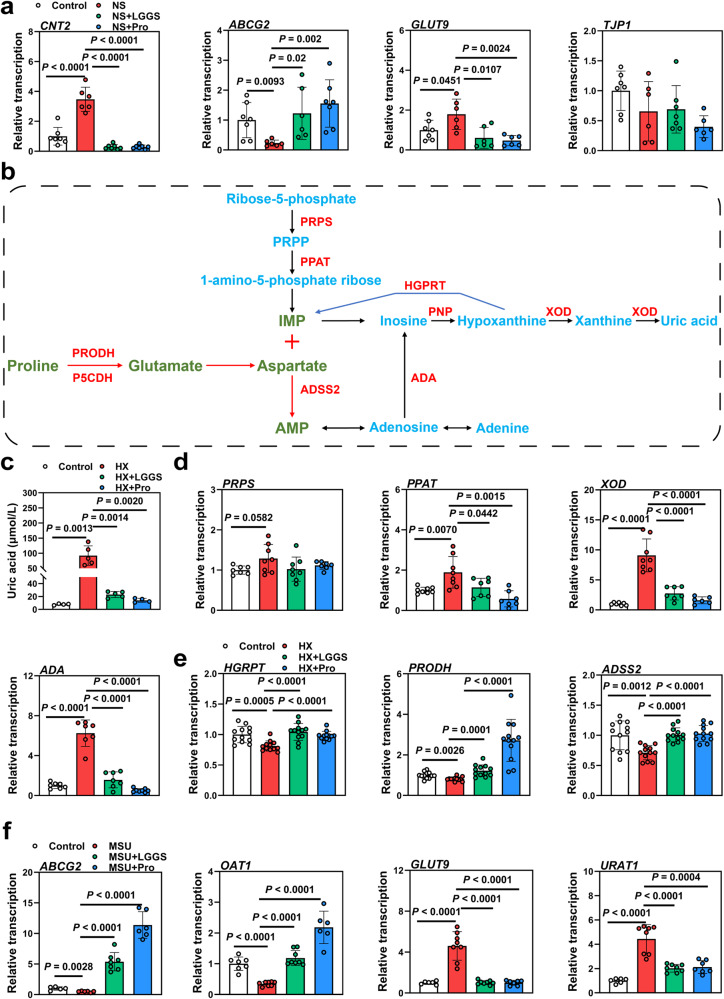
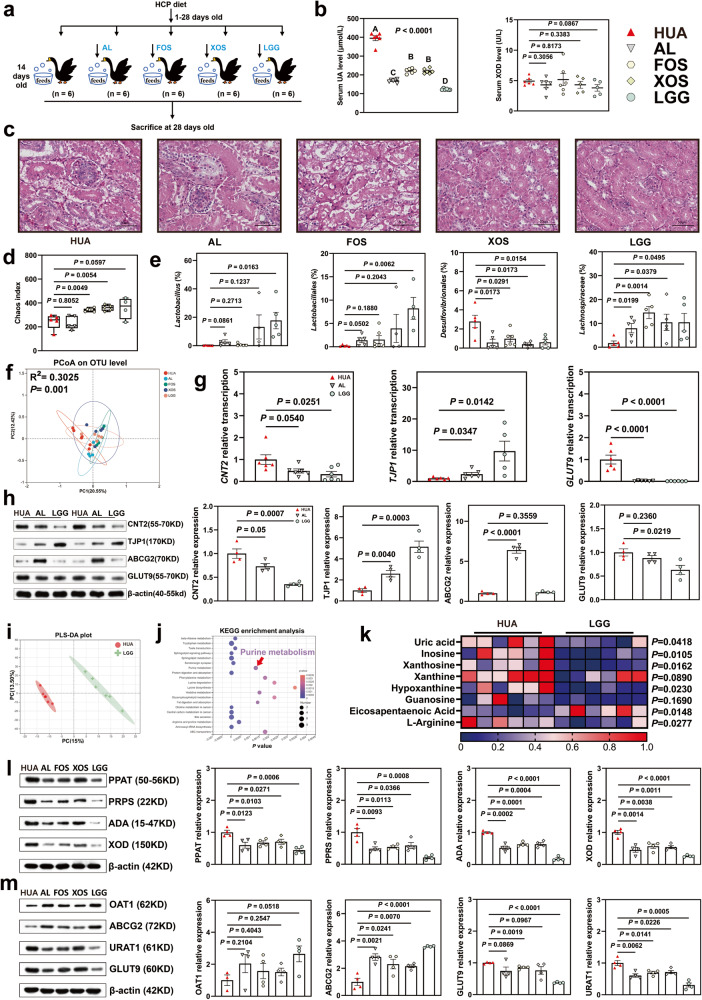
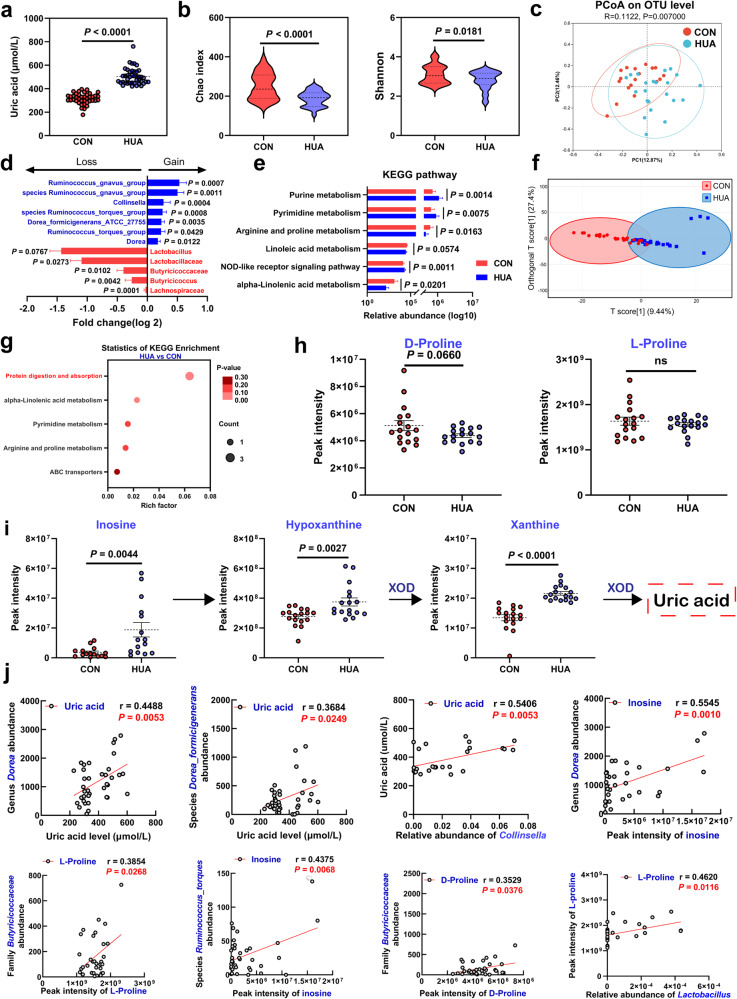
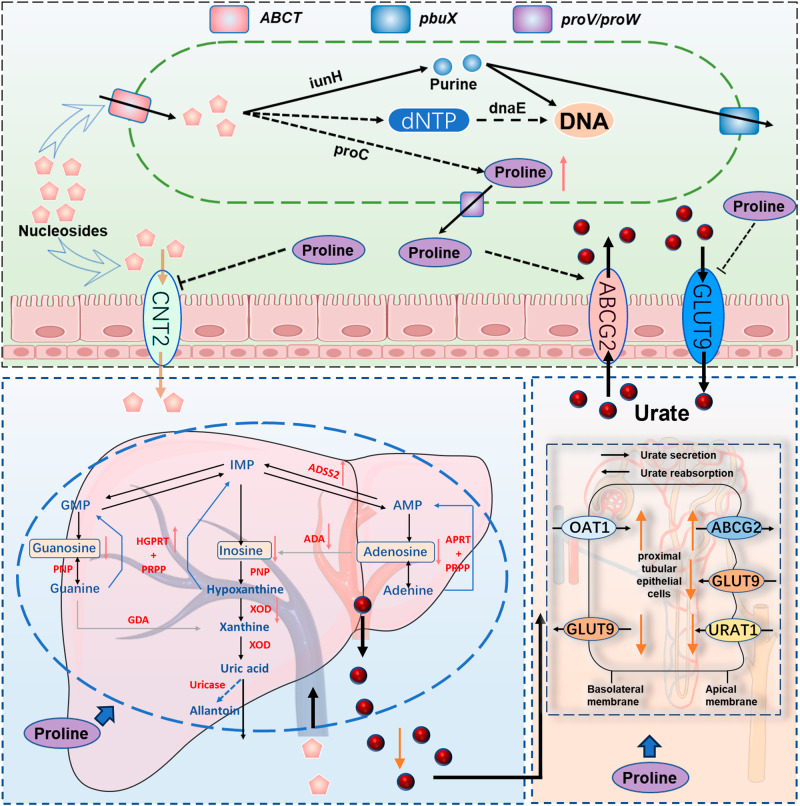
Hyperuricemia (HUA) is a metabolic syndrome caused by abnormal purine metabolism. Although recent studies have noted a relationship between the gut microbiota and gout, whether the microbiota could ameliorate HUA-associated systemic purine metabolism remains unclear. In this study, we constructed a novel model of HUA in geese and investigated the mechanism by which Lactobacillus rhamnosus GG (LGG) could have beneficial effects on HUA. The administration of antibiotics and fecal microbiota transplantation (FMT) experiments were used in this HUA goose model. The effects of LGG and its metabolites on HUA were evaluated in vivo and in vitro. Heterogeneous expression and gene knockout of LGG revealed the mechanism of LGG. Multi-omics analysis revealed that the Lactobacillus genus is associated with changes in purine metabolism in HUA. This study showed that LGG and its metabolites could alleviate HUA through the gut-liver-kidney axis. Whole-genome analysis, heterogeneous expression, and gene knockout of LGG enzymes ABC-type multidrug transport system (ABCT), inosine-uridine nucleoside N-ribohydrolase (iunH), and xanthine permease (pbuX) demonstrated the function of nucleoside degradation in LGG. Multi-omics and a correlation analysis in HUA patients and this goose model revealed that a serum proline deficiency, as well as changes in Collinsella and Lactobacillus, may be associated with the occurrence of HUA. Our findings demonstrated the potential of a goose model of diet-induced HUA, and LGG and proline could be promising therapies for HUA.


Conflict of interest statement

The authors declare no competing interests.

Figures

Fig. 1
Fig. 1. Goose is a more ideal HUA model because of its specific physiological defects.
Compared with mice, geese and humans have one innate commonality: a lack of uricase, which is especially important for the formation of hyperuricemia. Fortunately, people can excrete a part of the ammonia produced by protein degradation through the intestinal-hepatic urea cycle, thus reducing the production of a piece of uric acid. In contrast, geese are more susceptible to HUA because their liver lacks arginase and cannot synthesize urea. In summary, the goose is an ideal HUA model.
Fig. 2
Fig. 2. HCP diet disturbs gut flora and constructs a gosling HUA model through the gut-liver-kidney axis.
a Experimental design. One-day-old goslings were selected and divided into two groups to be fed a normal diet and HCP diet respectively for 28 d. b Effect of HCP diet on the serum uric acid (UA) (n = 8, mean with SEM), xanthine oxidase (XOD) levels (n = 6, mean with SEM). c Representative image of H&E staining of kidney sections from CON group or HUA group (×400, n = 8). The white part of the peripheral renal tubule in the right figure is the proteinuria protein cast lesions. All scale bars are 50 μm. d Principal components analysis of bacteria with 95% confidence regions between CON group (n = 7, green) and HUA group (n = 7, red). e The alteration trends of the bacterial relative abundance (n = 7). The x-axis shows the log2 fold change of the bacterial relative abundance in the HUA group compared to the CON group. f The abundance of microbial function genes and gene families in the CON group (white) and HUA group (red) (n = 7, mean with SEM). g Changes in the functional contribution of purine metabolism (top ten bacterial in terms of abundance, left: Family level, right: Genu level). h OPLS-DA of the fecal samples (n = 6). The red color represents the CON group, while the blue color HUA group. Compounds that were selected through RP and HILIC were analyzed separately. i KEGG pathway enrichment differential fecal metabolites between CON group and HUA group (n = 6). The y-axis shows the -Ln P-value, two significant pathways with P < 0.05 were highlighted with their names. j, Heatmap of LC-MS data showing fecal purine metabolite changes under HCP diet (n = 6). Increases in metabolite levels are shown in red, whereas blue indicates decreased metabolite. k Representative western blotting images and quantification of proteins (CNT2, TJP1, ABCG2, GLUT9) in the jejunum tissue between the CON group and HUA group (n = 4). l OPLS-DA of the serum samples (n = 8). The red color represents the CON group, while the blue color HUA group. Compounds that were selected through RP and HILIC were analyzed separately. m KEGG pathway enrichment differential serum metabolites between CON group and HUA group (n = 8). The y-axis shows the -Ln P-value, two significant pathways with P < 0.05 were highlighted with their names. n Heatmap of LC-MS data showing serum purine and amino acid metabolite changes under HCP diet (n = 8). Increases in metabolite levels are shown in red, whereas blue indicates decreased metabolite. o Pearson correlation analysis between gut microbiome relative abundance and serum metabolite relative level. p Representative western blotting images and quantification of proteins (PPAT, PRPS, ADA, XOD) in the liver tissue between the CON group and HUA group (n = 6). q Representative western blotting images and quantification of proteins (OAT1, ABCG2, URAT, GLUT9) in the kidney tissue between the CON group and HUA group (n = 6, mean with SEM). Data with error bars represent mean ± s.e.m. For (b, e, j, k) and (o, p, q), data were analyzed by two-tailed unpaired Student’s t-test. For (f), data were employed for the Wilcoxon rank-sum test.
Fig. 3
Fig. 3. Antibiotic treatment adjusts gut flora and alleviates HCP diet-induced HUA through the gut-liver-kidney axis.
a Experimental design. One-day-old goslings were selected and divided into two groups to be fed HCP diet for 4 weeks and then ANTI group gavage of antibiotics for 2 weeks. b Effect of antibiotics on the serum UA, and XOD levels in HCP diet-treated geese (n = 8). c Representative image of H&E staining of kidney sections from HUA group and ANTI group (×400, n = 8). The white part of the peripheral renal tubule in the right figure is the proteinuria protein cast lesions. All scale bars are 50 μm. d Shannon index of indicated groups based on alpha diversity analysis (n = 6). e Principal components analysis of bacteria with 95% confidence regions between the HUA group (red, n = 6) and ANTI group (blue, n = 7). f The alteration trends of the bacterial relative abundance (n = 7). The x-axis shows the log2 fold change of the bacterial relative abundance in the ANTI group compared to the HUA group. g Effect of antibiotics treatment on the relative expression of nucleoside transport gene (CNT2), gut barrier gene (TJP1), UA excretion genes (ABCG2), and reabsorption genes (GLUT9) in jejunum tissue by RT-PCR analysis (n = 6). h OPLS-DA of the serum samples (n = 10). The red color represents the HUA group, while the blue color ANTI group. Compounds that were selected through RP and HILIC were analyzed separately. i Heatmap of LC-MS data showing serum purine and amino acid metabolite changes between the HUA group and ANTI group (n = 8). Increases in metabolite levels are shown in red, whereas blue indicates decreased metabolite. j Pearson correlation analysis between Lactobacillus relative abundance and serum metabolite relative level. k Representative western blotting images and quantification of proteins (PPAT, PRPS, ADA, XOD) in the liver tissue of HCP diet-treated geese (n = 6) between the HUA group and ANTI group. l Representative western blotting images and quantification of proteins (OAT1, ABCG2, URAT, GLUT9) in the kidney tissue between the HUA group and ANTI group (n = 6). Data with error bars represent mean ± s.e.m. For (b, d, g, i, k, and l), data were analyzed by two-tailed unpaired Student’s t-test.
Fig. 4
Fig. 4. FMT disordered bacteria group and induced the occurrence of HUA through the gut-liver-kidney axis.
a Fecal microbiota transplantation experimental design. b Representative image of H&E staining of kidney sections from FMT(CON) group and FMT(HCP) (×400, n = 8). The white part of the peripheral renal tubule in the right figure is the proteinuria protein cast lesions. All scale bars are 50 μm. c Principal components analysis of bacteria with 95% confidence regions between the FMT(CON) group (n = 6, green) and FMT(HCP) group (n = 6, red). d The alteration trends of the bacterial relative abundance after HCP diet treatment-derived microbiota treatment (n = 6). e The abundance of microbial function genes and gene families in the FMT(CON) group (white) and FMT(HCP) group (red), n = 6, mean with SEM. f Changes in the functional contribution of purine metabolism (top ten bacterial in terms of abundance, Family level). g Effect of HCP diet treatment-derived microbiota on the relative expression of nucleoside transport gene (CNT2), gut barrier gene (TJP1), UA excretion genes (ABCG2), and reabsorption genes (GLUT9) in jejunum tissue by RT-PCR analysis (n = 6). h OPLS-DA of the serum samples (n = 8). The purple color represents the FMT(CON) group, while the yellow color FMT(HCP) group. Compounds that were selected through RP and HILIC were analyzed separately. i KEGG pathway enrichment differential metabolites between FMT(CON) group and FMT(HCP) group (n = 8). The y-axis shows the Ln P-value, and the significant pathway with P < 0.05 was highlighted. j Heatmap of LC-MS data showing serum purine and amino acid metabolite changes under HCP diet (n = 8). Increases in metabolite levels are shown in red, whereas blue indicates decreased metabolite. k Pearson correlation analysis between Lactobacillus relative abundance and serum metabolite relative level. l Representative western blotting images and quantification of proteins (PPAT, PRPS, ADA, XOD) in the liver tissue between the FMT(CON) group and FMT(HCP) group (n = 6). m Representative western blotting images and quantification of proteins (OAT1, ABCG2, URAT, GLUT9) in the kidney tissue between the FMT(CON) group and FMT(HCP) group (n = 6). Data with error bars represent mean ± s.e.m. For (d, g, j, l, and m), data were analyzed by two-tailed unpaired Student’s t-test. For e, data were employed for the Wilcoxon rank-sum test. For (k), data were employed for computer non-parametric Pearson correlation. FMT (CON): geese received fecal microbiota from CON diet-treated donor geese. FMT (HCP): geese received the fecal microbiota from HCP diet-treated donor geese.
Fig. 5
Fig. 5. LGG and LGG metabolites alleviate HCP diet-induced HUA through the gut-liver-kidney axis.
a LGG and LGG metabolites treatment experimental design. LGG + PBS: LGG cells resuspended in PBS, LGG + Metabolites: LGG cells and their metabolites. b Effect of LGG and LGG metabolites on the serum UA, and XOD levels in HCP diet-treated geese (n = 10). c Shannon index of indicated groups based on alpha diversity analysis (n = 8). d Principal components analysis of bacteria with 95% confidence regions of indicated groups (n = 5). e The alteration trends of the bacterial relative abundance (n = 8). f FISH assay was applied to explore the location of LGG in the intestinal (original magnification, ×200, scale bar:100 μm). Green represents LGG (LGG probe, FAM-labeled) and blue represents intestinal cell nucleus (DAPI). g Metabolic profiles of serum between two groups are clustered according to OPLS-DA (n = 8). The red color represents the CON group, while the blue color represents the HUA group, purple represents the LGG + PBS group, and yellow represents the LGG + Metabolites group. Compounds that were selected through RP and HILIC were analyzed separately. h KEGG pathway enrichment differential metabolites between HUA group and CON, LGG + PBS, LGG + Metabolites group (n = 8). The x-axis shows the rich factor. i The alteration trends of proline relative content between the HUA group and CON, LGG + PBS, LGG + Metabolites group (n = 8). j Changes in purine pathway metabolites level in LGG and LGG metabolites treatment (n = 8). k Pearson correlation analysis between gut microbiome relative abundance and serum metabolite relative level. Data with error bars represent mean ± s.e.m. For (b, c, e, h, and i), data was analyzed by two-tailed unpaired Student’s t-test. For (j), data were employed for computer non-parametric Spearman correlation.
Fig. 6
Fig. 6. LGG absorbs and degrades nucleosides through nucleoside permease and nucleoside hydrolase, and generates proline, which has the potential to alleviate HUA.
a Degradation effect of LGG on nucleoside solutions (n = 6). The contents of nucleosides (inosine, guanosine) after co-incubation of LGG with nucleoside solution were determined by high-performance liquid chromatography (HPLC). b OPLS-DA of the extracellular samples (n = 6). The red color represents the CONNS group, while the purple color LGGTNS group. Compounds that were selected through RP and HILIC were analyzed separately. c KEGG pathway enrichment differential metabolites between CONNS group and LGGTNS group (n = 6). d Heatmap of extracellular LC-MS data showing marker metabolite changes between CONNS group and LGGTNS group (n = 6). Increases in metabolite levels are shown in red, whereas blue indicates decreased metabolite. e OPLS-DA of the intracellular samples (n = 6). The red color represents the CONLGG group, while the blue color NSTLGG group. Compounds that were selected through RP and HILIC were analyzed separately. f KEGG pathway enrichment differential metabolites between CONLGG group and NTLGG group (n = 6). The y-axis shows the Ln P-value, and the significant pathway was highlighted. g Heatmap of intracellular LC-MS data showing marker metabolite changes between CONLGG group and NSTLGG group. Increases in metabolite levels are shown in red, whereas blue indicates decreased metabolite. h Real-time PCR analysis for ABCT, iunH, pbuX, dnaE, proW, and proV in LGG cells under different treatments (n = 8). i, j Effect of heterologous expression of ABCT, iunH, pbuX genes in E. coli on the degradation of nucleoside solutions (n = 4). Nucleoside (inosine, guanosine) preservation was determined by HPLC. The nucleoside degradation rates were obtained by conversion from the results of the standards. k, l Degradation effects of iunH, pbuX, and ABCT knockouts in LGG on nucleoside solutions (n = 4), control: inosine, guanosine. The nucleoside degradation rates were obtained by conversion from the results of the standards. Data with error bars represent mean ± s.e.m. For (a, d, g, and h), data were analyzed by two-tailed unpaired Student’s t-test. CONNS: control nucleoside solution, LGGTNS LGG-treated nucleoside solution, CONLGG control LGG; NSTLGG nucleoside solution-treated LGG, yxjA purine nucleoside transport protein, ABCT ABC-type multidrug transport system, ATPase and permease component; iunH Inosine-uridine nucleoside N-ribohydrolase, pbuX xanthine permease, dnaE DNA polymerase III subunit alpha, proW proline transport system permease protein, proV: proline transport system ATP-binding protein.
Fig. 7
Fig. 7. LGG metabolites or proline can alleviate the dysfunction of the intestine, liver, and kidney.
a Effect of LGG metabolites or proline on the relative expression of nucleoside transport gene (CNT2), gut barrier gene (TJP1), UA excretion genes (ABCG2), and reabsorption genes (GLUT9) in IPEC-J2 cell by RT-PCR analysis (n = 8). b proline metabolism and purine metabolism pathways. c Effect of LGG metabolites or proline on the UA levels in HX treated Hep-G2 cell (n = 5). d Effect of LGG metabolites or proline on the relative expression of UA production indicated genes (PPAT, PRPS, ADA, XOD) in Hep-G2 cell by RT-PCR analysis (n = 8). e Effect of LGG metabolites or proline on the relative expression of UA reduction indicated genes (HGPRT, ADSS2, PRODH) in Hep-G2 cell by RT-PCR analysis (n = 12). f Effect of LGG metabolites or proline on the relative expression of UA excretion genes (OAT1, ABCG2) and reabsorption genes (URAT1, GLUT9) in BHK cell by RT-PCR analysis (n = 6). Data with error bars represent mean ± s.e.m. For (a, b, and c), data were analyzed by two-tailed unpaired Student’s t-test. NS nucleoside solution, LGGS LGG metabolites solution. HX hypoxanthine, MSU Monosodium urate, CNT2 Concentrative nucleoside transporter 2, TJP1 Tight junction protein 1, ABCG2 ATP-binding cassette sub-family G member 2, GLUT9 Glucose transporter 9, OAT1 Organic anion transporter 1, URAT1 Urate transporter 1, PPAT Phosphoribosyl pyrophosphate amidotransferase, PRPS Phosphoribosyl pyrophosphate synthetase, ADA Adenosine deaminase, XOD Xanthine oxidase dehydrogenase, HGPRT Hypoxanthine-Guanine phosphoribosyltransferase, ADSS2 Adenylosuccinate synthase 2, PRODH Proline dehydrogenase.
Fig. 8
Fig. 8. LGG treatment adjusts gut flora and alleviates HCP diet-induced HUA through the gut-liver-kidney axis.
a LGG and prebiotics treatment experimental design. AL Allopurinol, FOS fructo-oligosaccharide, XOS xylo-oligosaccharide. b Effect of LGG, AL, and prebiotics on the serum UA, and XOD levels in HCP diet-treated geese (n = 6). c Representative image of H&E staining of kidney sections from indicated groups (×400, scale bar: 50 μm, n = 6). The white part of the peripheral renal tubule in the right figure is the proteinuria protein cast lesions. All scale bars are 50 μm. d Chao index of indicated groups based on alpha diversity analysis (n = 6). e The alteration trends of the bacterial relative abundance (n = 6). f Principal components analysis of bacteria with 95% confidence regions of indicated groups (n = 6). g Effect of LGG, AL treatment on the relative expression of nucleoside transport gene (CNT2), gut barrier gene (TJP1), and UA reabsorption indicated genes (GLUT9) in jejunum tissue by RT-PCR analysis (n = 6). h Representative western blotting images and quantification of proteins (CNT2, TJP1, ABCG2, GLUT9) in the jejunum tissue between the HUA group, AL group, and LGG group (n = 4). i PLS-DA of the serum samples (n = 6). The red color represents the HUA group, while the green color LGG group. Compounds that were selected through RP and HILIC were analyzed separately. j KEGG pathway enrichment differential metabolites between HUA group and LGG group (n = 6). The x-axis shows the Ln P-value. k Heatmap of LC-MS data showing serum purine, lipid acid, and amino acid metabolite changes under HCP diet (n = 6). Increases in metabolite levels are shown in red, whereas blue indicates decreased metabolite. l Representative western blotting images and quantification of proteins (PPAT, PRPS, ADA, XOD) in the liver tissue of indicated groups (n = 4). m Representative western blotting images and quantification of proteins (OAT1, ABCG2, URAT, GLUT9) in the kidney tissue of indicated groups (n = 4). Data with error bars represent mean ± s.e.m. For (b, d, e, g, h, k, l, and m), data were analyzed by two-tailed unpaired Student’s t-test.
Fig. 9
Fig. 9. The abundance of intestinal Lactobacillus in the HUA population decreased, and the serum uric acid synthesis precursor increased.
a Level of serum UA between CON group (n = 40) and HUA group (n = 43). b Chao index of indicated groups based on alpha diversity analysis (CON, n = 32; HUA, n = 33). c Principal components analysis of bacteria with 95% confidence regions of indicated groups. The red color represents the CON group (n = 32), while the blue color HUA group (n = 33). d The alteration trends of the bacterial relative abundance (CON, n = 32; HUA, n = 33). e Abundance profile of the kegg pathway obtained based on PICRUSt prediction analysis. f OPLS-DA of the serum samples. The red color represents the CON group (n = 25), while the blue color HUA group (n = 25). Compounds that were selected through RP and HILIC were analyzed separately. g KEGG pathway enrichment differential metabolites between the CON group (n = 25) and HUA group (n = 25). The x-axis shows the rich factor. h The alteration trends of proline relative content between CON (n = 17) and HUA group (n = 17). i Serum purine pathway metabolites levels in CON (n = 17) and HUA group (n = 17). j Pearson correlation analysis between gut microbiome relative abundance and serum uric acid and metabolites relative level. Data with error bars represent mean ± s.e.m. For (a, b, e, h, and i), data was analyzed by two-tailed unpaired Student’s t-test. For (d), data were employed for computer non-parametric Spearman correlation.
Fig. 10
Fig. 10. Working hypothesis.
The results may indicate that Lactobacillus rhamnosus GG degrades nucleosides through absorption, produces metabolites such as proline, increases intestinal uric acid excretion, reduces intestinal nucleoside transport, and reduces liver Uric acid production, restores kidney uric acid excretion, relieves HUA by gut-liver-kidney axis. ABCT ABC-type multidrug transport system, ATPase and permease component; iunH Inosine-uridine nucleoside N-ribohydrolase, pbuX xanthine permease, proW proline transport system permease protein, proV proline transport system ATP-binding protein, GLUT9 Glucose Transporter 9, UA reabsorption transporter; CNT2 concentrative nucleoside transporter type, ABCG2 ATP Binding Cassette Transporter G2, UA excretion transporter, OAT1 Organic Anion Transporter 1, XOD xanthine oxidase.

References

    1. Joosten L, et al. Asymptomatic hyperuricaemia: a silent activator of the innate immune system. Nat. Rev. Rheumatol. 2020;16:75–86. doi: 10.1038/s41584-019-0334-3. - DOI - PMC - PubMed
    1. Chen XM, et al. Contemporary prevalence of gout and hyperuricemia in the United States and decadal trends: the national health and nutrition examination survey, 2007-2016. Arthritis Rheumatol. 2019;71:991–999. doi: 10.1002/art.40807. - DOI - PMC - PubMed
    1. Dalbeth N, et al. Gout. Lancet. 2021;397:1843–1855. doi: 10.1016/S0140-6736(21)00569-9. - DOI - PubMed
    1. Cabau G, et al. Urate-induced immune programming: consequences for gouty arthritis and hyperuricemia. Immunol. Rev. 2020;294:92–105. doi: 10.1111/imr.12833. - DOI - PMC - PubMed
    1. He H, et al. Prevalence of hyperuricemia and the population attributable fraction of modifiable risk factors: evidence from a general population cohort in China. Front Public Health. 2022;10:936717. doi: 10.3389/fpubh.2022.936717. - DOI - PMC - PubMed