. 2024 Mar 20;15(1):2480.
doi: 10.1038/s41467-024-46456-9.

A universal molecular control for DNA, mRNA and protein expression

Affiliations

A universal molecular control for DNA, mRNA and protein expression

Helen M Gunter et al. Nat Commun. .

Abstract

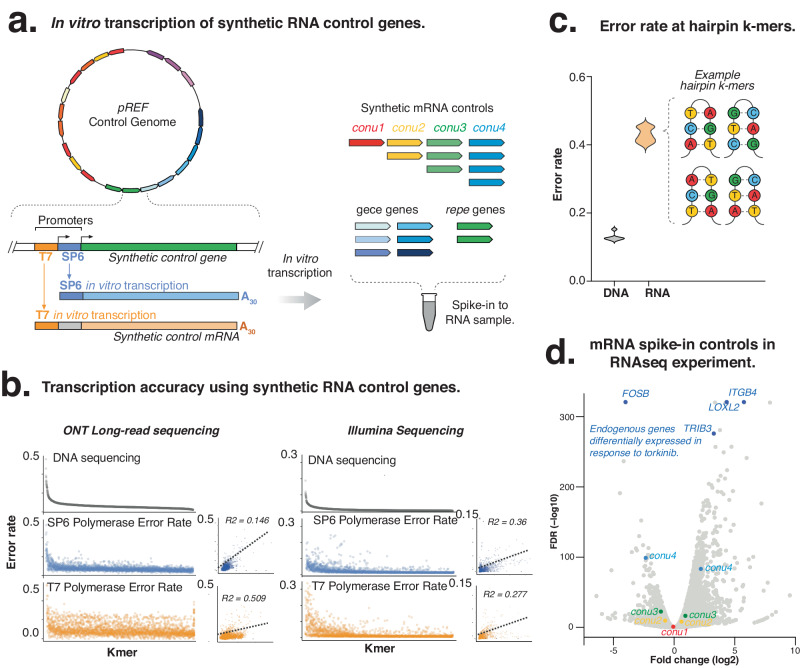
The expression of genes encompasses their transcription into mRNA followed by translation into protein. In recent years, next-generation sequencing and mass spectrometry methods have profiled DNA, RNA and protein abundance in cells. However, there are currently no reference standards that are compatible across these genomic, transcriptomic and proteomic methods, and provide an integrated measure of gene expression. Here, we use synthetic biology principles to engineer a multi-omics control, termed pREF, that can act as a universal molecular standard for next-generation sequencing and mass spectrometry methods. The pREF sequence encodes 21 synthetic genes that can be in vitro transcribed into spike-in mRNA controls, and in vitro translated to generate matched protein controls. The synthetic genes provide qualitative controls that can measure sensitivity and quantitative accuracy of DNA, RNA and peptide detection. We demonstrate the use of pREF in metagenome DNA sequencing and RNA sequencing experiments and evaluate the quantification of proteins using mass spectrometry. Unlike previous spike-in controls, pREF can be independently propagated and the synthetic mRNA and protein controls can be sustainably prepared by recipient laboratories using common molecular biology techniques. Together, this provides a universal synthetic standard able to integrate genomic, transcriptomic and proteomic methods.


Conflict of interest statement

The Garvan Institute has filed patents covering aspects of this study. T.R.M. and H.M.G. have received financial support from Oxford Nanopore Technologies for travel, accommodations and research costs. The other authors declare no competing interests.

Figures

Fig. 1
Fig. 1. Design of pREF.
a Overview of pREF shows the organization of synthetic conu, gece, repe and proco genes that are suitable for DNA and RNA sequencing, and mass spectrometry. b The digestion of pREF (with EcoRI) generates a DNA fragment size ladder (nt = nucleotides). c conu genes are represented at multiple copy-numbers in pREF so that when sequenced, they form a staggered reference ladder able to measure quantitative features of DNA and RNA sequencing libraries (n = 1 biologically independent samples). Box plot extends from 25th to 75th percentiles, centre line is the median, and whiskers cover the 10th and 90th percentiles. d gece and repe genes can act as sequencing controls that measure accuracy at difficult GC-rich or repetitive sequences, respectively (n = 1 biologically independent samples). Box plot extends from 25th to 75th percentiles, centre line is the median, and whiskers cover the 10th and 90th percentiles. e In vitro transcription of conu, gece, proco and repe synthetic genes generate matched mRNA controls for use in RNAseq experiments. f In vitro translation of proco genes generates synthetic protein controls for use in proteomic experiments. Source data are provided in a Source Data File.
Fig. 2
Fig. 2. Using pREF to measure errors in Illumina and ONT sequencing.
a Annotations of conu, gece and repe genes in pREF, with heat maps showing k-mer coverage, GC-content and repetitiveness. Error profile of (b) Illumina and (c) ONT alignments across the pREF sequence. d Histogram of individual k-mers ranked according to error rate for Illumina and ONT sequencing. e Individual error profiles for selected k-mers (ONT = Oxford Nanopore Technologies). ae A single replicate from each sequencing method was used to create each plot. Source data are provided in a Source Data File.
Fig. 3
Fig. 3. Measuring the quantitative accuracy of synthetic conu genes.
a Schematic diagram illustrates the design and use of conu genes as quantitative controls. b Density histogram from k-mer counts for conu gene families illustrates the distribution of technical variation in 31-mer normalised read count, calculated using a sliding window approach. Bounds of technical variation are a visual representation of read count variation and are not based on a statistical calculation. c Quantitative accuracy of simulated, DNA and RNA sequencing using Illumina and ONT sequencing technologies as measured from conu genes (ONT = Oxford Nanopore Technologies). d Density plots show the spread of technical variation in conu read counts in DNA and RNA libraries, prepared for ONT and Illumina sequencing. Source data are provided in a Source Data File.
Fig. 4
Fig. 4. In vitro transcription of pREF mRNA controls.
a Synthetic control genes are preceded by a T7 promoter that enables in vitro transcription into matched mRNA controls. b Scatter plots indicate the fold-differences in k-mer sequencing error rates between RNA and DNA libraries for Illumina and ONT sequencing. c Violin plot illustrates the enrichment of sequencing errors at k-mers that form hairpins. d Use of synthetic conu gene during differential gene analysis of lung adenocarcinoma cells with torkinib. The synthetic RNA controls (coloured points) indicate the accuracy for detecting fold change differences in gene expression (grey) between treated and untreated cells. Source data are provided in a Source Data File.
Fig. 5
Fig. 5. In vitro translation of synthetic proco protein controls.
a Schematic illustrates the design of proco genes that are translated to form protein controls. Trypsin digestion of the proco proteins then liberates control peptides of differing size, charge and retention time, enabling the calibration of LC-MS/MS. b Quantification of each fully cleaved proco peptide. Relative peptide abundance is measured by the proportion of detected peptides relative to all peptides in the proco protein. Data are presented as mean values +/- SD (n = 3 biologically independent samples). c Schematic diagram indicates how peptides are also present at differing copy-number, thereby forming a staggered quantitative reference ladder for evaluating quantitative performance of proteomic experiments. Data plots are for illustrative purposes only, and are not based on Mass Spectrometric measurements. d Measurement of relative peptide abundance for proco proteins and housekeeping E. coli proteins (where each peptide is expected to be in equal abundance) in replicate (n = 3). Source data are provided in a Source Data File.

References

    1. Buccitelli C, Selbach M. mRNAs, proteins and the emerging principles of gene expression control. Nat. Rev. Genet. 2020;21:630–644. doi: 10.1038/s41576-020-0258-4. - DOI - PubMed
    1. Liu Y, Beyer A, Aebersold R. On the dependency of cellular protein levels on mRNA abundance. Cell. 2016;165:535–550. doi: 10.1016/j.cell.2016.03.014. - DOI - PubMed
    1. Bowden R, et al. Sequencing of human genomes with nanopore technology. Nat. Commun. 2019;10:1869. doi: 10.1038/s41467-019-09637-5. - DOI - PMC - PubMed
    1. Treangen TJ, Salzberg SL. Repetitive DNA and next-generation sequencing: computational challenges and solutions. Nat. Rev. Genet. 2012;13:36–46. doi: 10.1038/nrg3117. - DOI - PMC - PubMed
    1. Goldfeder RL, et al. Medical implications of technical accuracy in genome sequencing. Genome Med. 2016;8:24. doi: 10.1186/s13073-016-0269-0. - DOI - PMC - PubMed

LinkOut - more resources