

The Arctic Plant Aboveground Biomass Synthesis Dataset
- PMID: 38509110
- PMCID: PMC10954756
- DOI: 10.1038/s41597-024-03139-w
The Arctic Plant Aboveground Biomass Synthesis Dataset
Abstract
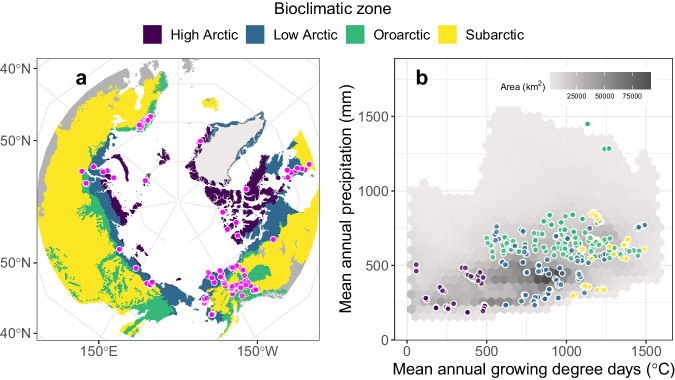
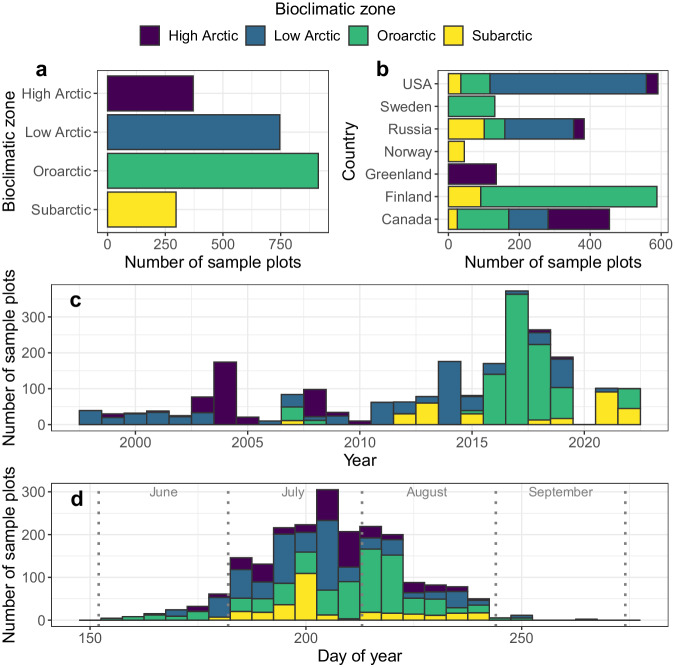
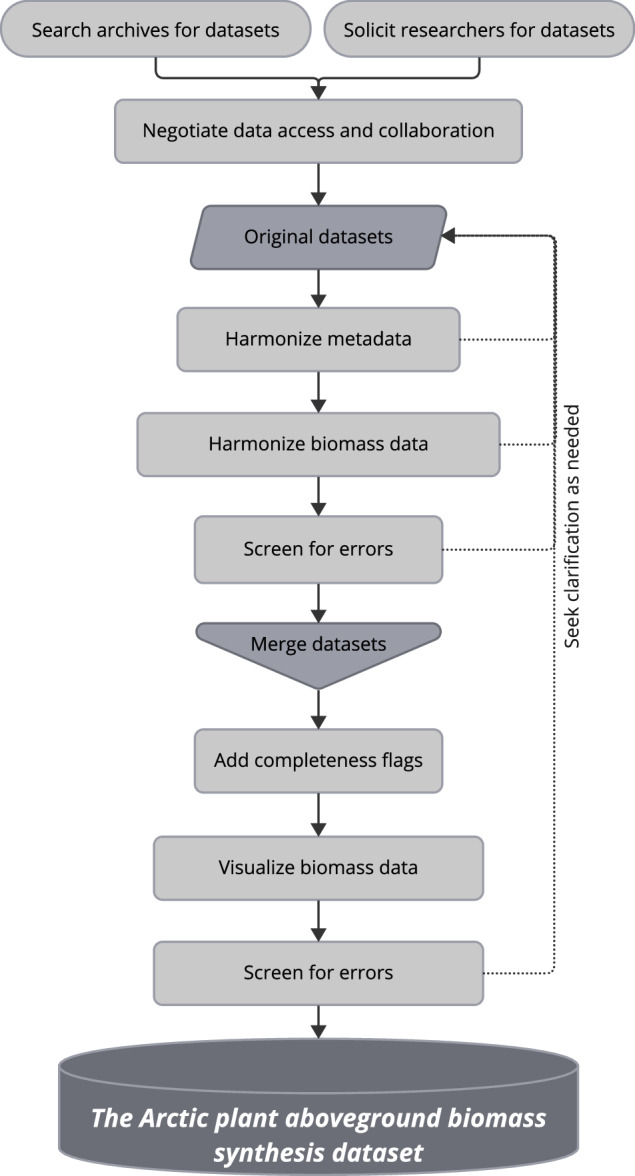
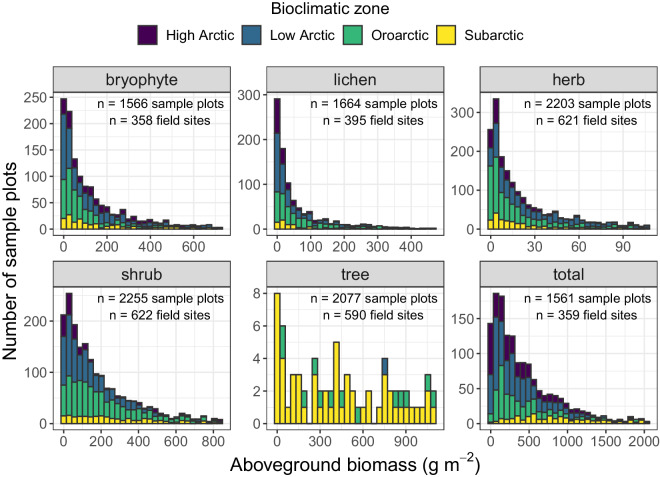
Plant biomass is a fundamental ecosystem attribute that is sensitive to rapid climatic changes occurring in the Arctic. Nevertheless, measuring plant biomass in the Arctic is logistically challenging and resource intensive. Lack of accessible field data hinders efforts to understand the amount, composition, distribution, and changes in plant biomass in these northern ecosystems. Here, we present The Arctic plant aboveground biomass synthesis dataset, which includes field measurements of lichen, bryophyte, herb, shrub, and/or tree aboveground biomass (g m-2) on 2,327 sample plots from 636 field sites in seven countries. We created the synthesis dataset by assembling and harmonizing 32 individual datasets. Aboveground biomass was primarily quantified by harvesting sample plots during mid- to late-summer, though tree and often tall shrub biomass were quantified using surveys and allometric models. Each biomass measurement is associated with metadata including sample date, location, method, data source, and other information. This unique dataset can be leveraged to monitor, map, and model plant biomass across the rapidly warming Arctic.
© 2024. The Author(s).
Conflict of interest statement
The authors declare no competing interests.
Figures
References
-
- Downing A, Cuerrier A. A synthesis of the impacts of climate change on the First Nations and Inuit of Canada. Indian Journal of Traditional Knowledge. 2011;10:57–70.
-
- Burkhard B, Müller F. Indicating human-environmental system properties: Case study northern Fenno-Scandinavian reindeer herding. Ecological Indicators. 2008;8:828–840. doi: 10.1016/j.ecolind.2007.06.003. - DOI
-
- Pearson RG, et al. Shifts in Arctic vegetation and associated feedbacks under climate change. Nature Climate Change. 2013;3:673–677. doi: 10.1038/nclimate1858. - DOI
-
- Epstein HE, et al. Dynamics of aboveground phytomass of the circumpolar Arctic tundra during the past three decades. Environmental Research Letters. 2012;7:015506. doi: 10.1088/1748-9326/7/1/015506. - DOI
Publication types
MeSH terms
Grants and funding
- 80NSSC21K1364/National Aeronautics and Space Administration (NASA)
- 80NSSC22K1247/National Aeronautics and Space Administration (NASA)
- 80NSSC22K1247/National Aeronautics and Space Administration (NASA)
- NNX12AK83G/National Aeronautics and Space Administration (NASA)
- NNX15AP04H/National Aeronautics and Space Administration (NASA)
- 2127273/National Science Foundation (NSF)
- 1417745/National Science Foundation (NSF)
- 1636476/National Science Foundation (NSF)
- 2224776/National Science Foundation (NSF)
- 2127273/National Science Foundation (NSF)
- 330319/Academy of Finland (Suomen Akatemia)
- 330319/Academy of Finland (Suomen Akatemia)
- 330845/Academy of Finland (Suomen Akatemia)
- 1342890/Academy of Finland (Suomen Akatemia)
- 256991/Academy of Finland (Suomen Akatemia)
- 2021-05767/Vetenskapsrådet (Swedish Research Council)
- FRQNT-2018-PR-208107/Fonds de Recherche du Québec - Nature et Technologies (Quebec Fund for Research in Nature and Technology)
- FRQNT-2018-PR-208107/Fonds de Recherche du Québec - Nature et Technologies (Quebec Fund for Research in Nature and Technology)
LinkOut - more resources
Full Text Sources
