. 2024 Mar 20;15(1):2358.
doi: 10.1038/s41467-024-46384-8.

Epigenetic modulators link mitochondrial redox homeostasis to cardiac function in a sex-dependent manner

Affiliations

Epigenetic modulators link mitochondrial redox homeostasis to cardiac function in a sex-dependent manner

Zaher ElBeck et al. Nat Commun. .

Abstract

While excessive production of reactive oxygen species (ROS) is a characteristic hallmark of numerous diseases, clinical approaches that ameliorate oxidative stress have been unsuccessful. Here, utilizing multi-omics, we demonstrate that in cardiomyocytes, mitochondrial isocitrate dehydrogenase (IDH2) constitutes a major antioxidative defense mechanism. Paradoxically reduced expression of IDH2 associated with ventricular eccentric hypertrophy is counterbalanced by an increase in the enzyme activity. We unveil redox-dependent sex dimorphism, and extensive mutual regulation of the antioxidative activities of IDH2 and NRF2 by a feedforward network that involves 2-oxoglutarate and L-2-hydroxyglutarate and mediated in part through unconventional hydroxy-methylation of cytosine residues present in introns. Consequently, conditional targeting of ROS in a murine model of heart failure improves cardiac function in sex- and phenotype-dependent manners. Together, these insights may explain why previous attempts to treat heart failure with antioxidants have been unsuccessful and open new approaches to personalizing and, thereby, improving such treatment.


Conflict of interest statement

F.K., J.L., A.W., R.J., R.B., T.J., E.F., M.F., A.D., Cl.B. and R.M. are current employees or were employees of AstraZeneca and may own stock or stock options. The rest of the authors declare no competing interests.

Figures
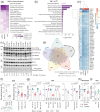
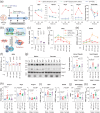
Fig. 1
Fig. 1. Mitochondrial dysfunction and downregulation of IDH2 expression in association with eccentric hypertrophy.
a Selected pathways from IPA enrichment analysis on published transcriptomic data from left ventricle (LV) myocardium of patients with dilated cardiomyopathy (DCM). b Selected pathways from IPA enrichment analysis on transcriptomic data from LV of Mlp−/− mice (males + females). c Western blotting of OXPHOS complexes and IDH2 in the LV of patients with eccentric genetic DCM (the bands are quantified in Supplementary Fig. 1d, and the samples’ metadata are described in Supplementary Table 1). d Venn diagram of genes encoding mitochondrial metabolic enzymes, and differentially expressed genes (DEGs) in the LV of patients with DCM (described in Fig. 1a) or Mlp−/− mice. Only DEGs with p < 0.05 and adjusted P value < 0.01 were included in this analysis. e List of genes encoding for mitochondrial metabolic enzymes that were commonly dysregulated in all data sets analyzed in panel (d). f IDH2 expression in LV of patients with genetic DCM described in Fig. (1a), and in LV of patients with idiopathic DCM and ischemic cardiomyopathy (ICM). g Idh2 expression in LV of Mlp−/− mice analyzed by qPCR; or inferred from published transcriptomic data from LV of Pln-R14Δ/Δ mice; mice with myocardial infarction (MI) surgery, 8 weeks after the surgery; and rat model of diabetic cardiomyopathy induced by streptozotocin (STZ). h Quantification of Western blotting of Idh2 normalized to Gapdh in LV of Mlp−/− mice. Blots are shown in Supplementary Fig. 1k. i qPCR analysis of Idh2 expression in the LV of male Mybpc3−/− mice. Bars represent mean ± SEM, analyzed with unpaired two-tailed t-test. The sample size is indicated in all figures. Source data and uncropped blots are available in the Source Data file.
Fig. 2
Fig. 2. Redox status modulates the expression and the activity of IDH2.
a Experimental scheme depicting the treatment of NRCMs with increasing concentrations of H2O2, and qPCR analysis of Idh2, Hmox1, Nqo1 and Osgin1 expression, normalized to untreated control. Equal amounts (5 ng) of total RNA were utilized for all qPCR reactions. Total RNA depicts the recovered amount of extracted RNA from the wells of H2O2-treated NRCMs, compared to untreated control. Horizontal dashed lines mark the mean levels in control samples. Values represent the average of 4 individual wells ±SEM. b Volcano plot for differentially succinylated peptides of mitochondrial metabolic enzymes in the LV of patients with ICM, obtained from publicly available mass spectroscopic data. c Idh2 activity in cardiac mitochondria isolated from frozen LV myocardium of male Mlp-/- with or without the Idh2-activity-inhibitor, N-ethylmaleimide (NEM). d 2OG levels in the LV of male Mlp-/-. Bars represent mean ± SEM, analyzed with unpaired two-tailed t-test. The sample size is indicated on all figures. Source data are available in the Source Data file.
Fig. 3
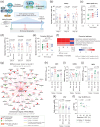
Fig. 3. Antioxidative role of L2-hydroxyglutarate (L2HG) in the heart.
a, b Targeted LC-MS/MS analysis of L-malate, L2HG, and D2HG in the left ventricle (LV) of male and female Mlp-/-, normalized to tissue weight. c Scheme depicting metabolic remodeling of Krebs cycle and LDH leading to L2HG production. dg NRCMs transduced with ShRNA targeting L2hgdh were analyzed for L2hgdh expression by qPCR in panel (d), L2HG levels by a targeted LC-MS in panel (e), Idh2 mRNA expression by qPCR in panel (f), and protein level by western blotting in panel (g). h Selected pathways from IPA comparison analysis on transcriptomic data from NRCMs transduced with ShRNA targeting L2hgdh or D2hgdh. i IPA upstream regulator analysis of Nrf2 in NRCMs transduced with ShRNA targeting L2hgdh with Right-Tailed Fisher’s Exact Test. j Proposed molecular mechanism for the antioxidative role of L2HG in the heart. Values in figures d-i are the average of n (numbers indicated on the figures) individual wells. Bars represent mean ± SEM with unpaired two-tailed t-test. Source data and uncropped blots are available in Source Data file.
Fig. 4
Fig. 4. Sex associated differences in response to oxidative stress.
a Scheme depicting the experimental approach for treating NRCMs with sulforaphane (SF), N-acetyl cysteine (NAC) or in combinations, qPCR analysis of Idh2, Hmox1, Nqo1 and Osgin1 expression in treated NRCMs normalized to untreated control, and recovered amount of total RNA extracted from the treated-NRCMs, compared to untreated controls. b Proposed molecular mechanism for the IDH2-NRF2 mutual regulation. c qPCR analysis of Idh2 expression in treated NRCMs with increasing concentrations of SF, normalized to untreated control. d, e Targeted LC-MS/MS analysis of GSH and GSSG levels in NRCMs, hiPSC-CMs, and hFF1 cells treated with increasing concentrations of SF for 48 h, p-values and individual data points are displayed in Supplementary fig. (4c, d, and h). f Targeted LC-MS/MS analysis of MDA levels in NRCMs treated with increasing concentrations of SF for 48 h, compared to untreated control. g Western blotting of Hmox1 and Nqo1 in the LV of Mlp-/-, and their subsequent quantification, normalized to Gapdh. h qPCR analysis of Hmox1, Nqo1 and Osgin1 expression in LV myocardium of Mlp-/-. ik Targeted LC-MS/MS analysis of GSH, GSSG and MDA levels in the LV of male and female Mlp-/-, normalized to soluble proteins. Values in figures af are the average values of 4 or 5 individual wells/plates ±SEM. Depicted p-values on all figures represent two-tailed unpaired t-tests. Horizontal dashed lines in figures (a) and (cf) mark the mean value in the control samples. Bars in figures (gk) represent the mean ± SEM. Source data and uncropped blots are available in Source Data file.
Fig. 5
Fig. 5. Redox-associated sex dimorphism in cardiac phenotype.
a Pearson correlation between left ventricle ejection fraction (LVEF) of Mlp-/- mice with reduced LVEF (EF < 40%) and cardiac expression of Hmox1 estimated by qPCR. The p-value was derived from a two-tailed Pearson correlation analysis. b Thickness of the left ventricle anterior wall (LVAW) or posterior wall (LVPW), normalized to LV diameter, in male and female Mlp-/- mice. The values are the average of systolic and diastolic states. Bars represent mean ± SEM with unpaired two-tailed t-test. c LVEF in male and female Mlp-/- mice at the age of 10 weeks. The median is shown on the plot, with the interquartile range and unpaired two-tailed t-test. d Changes in LVEF of male and female Mlp-/- mice over time. Bars represent mean ± SEM with paired two-tailed t-test. e Neonatal rat cardiomyocytes (NRCMs) stained for α-actinin and imaged with a spinning disk confocal microscope to visualize the effect of SF and NAC treatments on cell shape and structure, and subsequent ImageJ analysis of cell surface area and the minimum caliper diameter of the SF or NAC-treated NRCMs, measured in pixel (px). The median is shown on the plot, with the interquartile range and unpaired one-tailed t-test. Source data are available in the Source Data file.
Fig. 6
Fig. 6. Activation of Nrf2 improves cardiac function in male, but not in female Mlp-/- mice.
a Experimental settings of the in vivo Keap1 chelator (Nrf2 activator) study and the proposed underlying molecular mechanism. be Left ventricle ejection fraction (LVEF) of male (b) and female (d) Mlp-/- mice treated with Nrf2 activator or with scrambled (scr.) control. The changes over time in LVEF for individual animals treated with Nrf2 activator are shown for males in (c) and for females in (e). Bars represent mean ± SEM with unpaired one-tailed t-test (in b and d) or paired one-tailed t-test (in c and e). f, g Selected pathways from IPA comparison analysis (in f), and IPA upstream regulator analysis of the downstream targets of Nrf2 with Right-Tailed Fisher’s Exact Test (in g) on transcriptomic data from the LV of Mlp-/- mice treated with Nrf2 activator or scrambled control. hj Targeted LC-MS/MS analysis of GSH, GSSG, and MDA levels in the LV of Mlp-/- treated with Nrf2 activator or scrambled control normalized to soluble proteins. k qPCR analysis of Idh2 expression in the LV of Mlp-/- treated with Nrf2 activator, normalized to scrambled controls. Values in hk are the mean fold change ± SEM with unpaired two-tailed t-test. l Pearson’s correlation between baseline LVEF of male and female Mlp-/- mice and Δ LVEF after 14 days of treatment with Nrf2 activator. The p-value was derived from a two-tailed Pearson correlation analysis. Sample size is provided on all figures. Source data are available in Source Data file.
Fig. 7
Fig. 7. Unique epigenetic control of Idh2 expression and redox response.
a Percentages of whole genome 5mC or 5hmC-methylated CpGs in the myocardium of Mlp-/- mice. Bars represent mean ± SEM with unpaired two-tailed t-test. b Principal component (PC) analysis of the distribution of whole genome 5mC and 5hmC (n = 3 in each group). c Spearman correlation between the expression of individual genes and the proportion of methylation in each adjacent functional region (CDS, coding regions; CTCF, transcriptional repressor CTCF binding sites; TF, transcription factors binding sites.). Values presented are an average of three biological replicates in WT and Mlp-/-, or 6 replicates in combined WT and Mlp-/-. d Screenshot from the Integrative Genomic Viewer for actual methylation levels in Idh2 locus in chromosome 7 of murine genome. e qPCR analysis of Idh2 expression in NRCMs transduced with ShRNA targeting Tet1-3 and/or L2hgdh. The values are normalized to their respective scrambled control. Bars represent mean ± SEM with unpaired two-tailed t-test. f Selected pathways from IPA comparison analysis on transcriptomic data of NRCMs transduced with ShRNA targeting Tet1-3, L2hgdh, D2hgdh, or Tet1-3 combined with L2hgdh or D2hgdh. g A summary of the proposed molecular mechanism. Source data are available in Source Data file.

References

    1. Bertero E, Maack C. Metabolic remodelling in heart failure. Nat. Rev. Cardiol. 2018;15:457–470. doi: 10.1038/s41569-018-0044-6. - DOI - PubMed
    1. Ide T, et al. Mitochondrial electron transport complex I is a potential source of oxygen free radicals in the failing myocardium. Circulation Res. 1999;85:357–363. doi: 10.1161/01.RES.85.4.357. - DOI - PubMed
    1. Ide T, et al. Direct evidence for increased hydroxyl radicals originating from superoxide in the failing myocardium. Circulation Res. 2000;86:152–157. doi: 10.1161/01.RES.86.2.152. - DOI - PubMed
    1. Bertero E, Maack C. Calcium signaling and reactive oxygen species in mitochondria. Circulation Res. 2018;122:1460–1478. doi: 10.1161/CIRCRESAHA.118.310082. - DOI - PubMed
    1. Nickel A, Kohlhaas M, Maack C. Mitochondrial reactive oxygen species production and elimination. J. Mol. Cell. Cardiol. 2014;73:26–33. doi: 10.1016/j.yjmcc.2014.03.011. - DOI - PubMed