. 2024 Mar 20;14(1):6732.
doi: 10.1038/s41598-024-57238-0.

Estimating actual SARS-CoV-2 infections from secondary data

Affiliations

Estimating actual SARS-CoV-2 infections from secondary data

Wolfgang Rauch et al. Sci Rep. .

Abstract

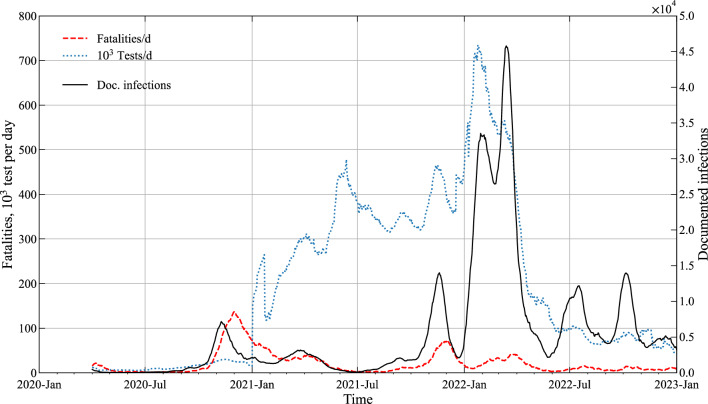
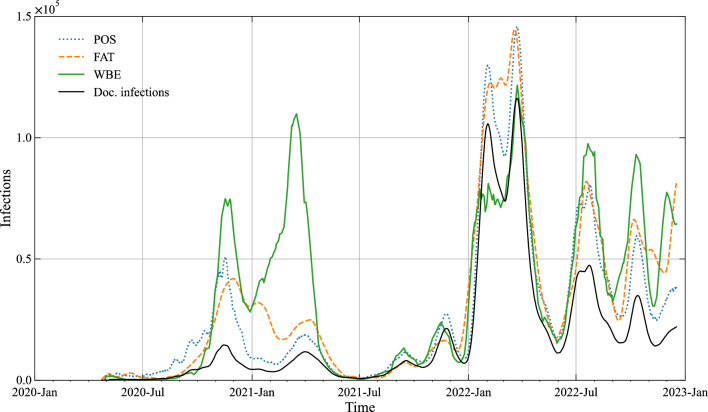
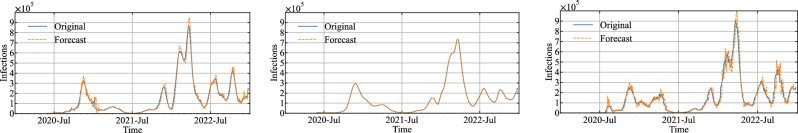
Eminent in pandemic management is accurate information on infection dynamics to plan for timely installation of control measures and vaccination campaigns. Despite huge efforts in diagnostic testing of individuals, the underestimation of the actual number of SARS-CoV-2 infections remains significant due to the large number of undocumented cases. In this paper we demonstrate and compare three methods to estimate the dynamics of true infections based on secondary data i.e., (a) test positivity, (b) infection fatality and (c) wastewater monitoring. The concept is tested with Austrian data on a national basis for the period of April 2020 to December 2022. Further, we use the results of prevalence studies from the same period to generate (upper and lower bounds of) credible intervals for true infections for four data points. Model parameters are subsequently estimated by applying Approximate Bayesian Computation-rejection sampling and Genetic Algorithms. The method is then validated for the case study Vienna. We find that all three methods yield fairly similar results for estimating the true number of infections, which supports the idea that all three datasets contain similar baseline information. None of them is considered superior, as their advantages and shortcomings depend on the specific case study at hand.


Conflict of interest statement

The authors declare no competing interests.

Figures

Figure 1
Figure 1
Timeseries of SARS-CoV-2 surveillance data—national situation in Austria. Fatalities (NFAT), number of Tests (NTEST) and number of documented new infections (NINF) are given as daily values, averaged over 7/21 days.
Figure 2
Figure 2
Timeline of wastewater samples expressed as virus load Lvirus in 106 gene copies per Person per day for Austria. For comparison active documented infections (Id) are plotted on the secondary axis.
Figure 3
Figure 3
Upper and lower bounds of credible intervals for Left: total infection number and Right: total Seroprevalence for 2 data points each. The timelines of documented infections/seroprevalence are plotted for comparison.
Figure 4
Figure 4
Estimated interval of true infections by means of the 3 models POS, FAT and WBE. Uncertainty in the estimates is plotted by using the 5 and 95 percentile values from ABC. The timeline of documented infections is plotted for comparison.
Figure 5
Figure 5
R-value of the estimated true infections (50 percentile values) with the 3 models and R-value computed for the documented infections.
Figure 6
Figure 6
Estimated true infections by means of the 3 models POS, FAT and WBE for the city of Vienna. Parameters chosen as above, i.e. 50 percentile values from ABC for national data. The timeline of documented infections is plotted for comparison.
Figure 7
Figure 7
Rolling window analysis of the autoregressive model. The consecutive 7-day forecasts are plotted against the original data. Left: POS model, Middle: FAT model and Right: WBE model.

References

    1. Mathieu E. et al. Coronavirus Pandemic (COVID-19). https://ourworldindata.org/coronavirus.
    1. Li R, et al. Substantial undocumented infection facilitates the rapid dissemination of novel coronavirus (SARS-CoV-2) Science (New York, N.Y.) 2020;368(6490):489–493. doi: 10.1126/science.abb3221. - DOI - PMC - PubMed
    1. Albani V, Loria J, Massad E, Zubelli J. COVID-19 underreporting and its impact on vaccination strategies. BMC Infect. Dis. 2021;21(1):1111. doi: 10.1186/s12879-021-06780-7. - DOI - PMC - PubMed
    1. Giattino, C. How Epidemiological Models of COVID-19 Help us Estimate the True Number of Infections. https://ourworldindata.org/covid-models. Accessed 23 Sept 2023.
    1. Oran DP, Topol EJ. The proportion of SARS-CoV-2 infections that are asymptomatic: A systematic review. Ann. Intern. Med. 2021;174(5):655–662. doi: 10.7326/M20-6976. - DOI - PMC - PubMed