. 2024 Oct;20(10):1294-1304.
doi: 10.1038/s41589-024-01583-8. Epub 2024 Mar 20.

Sulfide oxidation promotes hypoxic angiogenesis and neovascularization

Affiliations

Sulfide oxidation promotes hypoxic angiogenesis and neovascularization

Roshan Kumar et al. Nat Chem Biol. 2024 Oct.

Abstract

Angiogenic programming in the vascular endothelium is a tightly regulated process for maintaining tissue homeostasis and is activated in tissue injury and the tumor microenvironment. The metabolic basis of how gas signaling molecules regulate angiogenesis is elusive. Here, we report that hypoxic upregulation of ·NO in endothelial cells reprograms the transsulfuration pathway to increase biogenesis of hydrogen sulfide (H2S), a proangiogenic metabolite. However, decreased H2S oxidation due to sulfide quinone oxidoreductase (SQOR) deficiency synergizes with hypoxia, inducing a reductive shift and limiting endothelial proliferation that is attenuated by dissipation of the mitochondrial NADH pool. Tumor xenografts in whole-body (WBCreSqorfl/fl) and endothelial-specific (VE-cadherinCre-ERT2Sqorfl/fl) Sqor-knockout mice exhibit lower mass and angiogenesis than control mice. WBCreSqorfl/fl mice also exhibit decreased muscle angiogenesis following femoral artery ligation compared to control mice. Collectively, our data reveal the molecular intersections between H2S, O2 and ·NO metabolism and identify SQOR inhibition as a metabolic vulnerability for endothelial cell proliferation and neovascularization.


Figures

Figure 1.
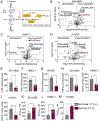
Figure 1.. Hypoxic track switching in the transsulfuration pathway.
(A) Scheme showing radiolabel transfer from [35S]-methionine to GSH (asterisks) via the canonical transsulfuration pathway (blue arrows), H2S synthesis (red arrows) and the mitochondrial oxidation reactions. Cyst, TST and ETHE1 are cystathionine, thiosulfate sulfurtransferase and persulfide dioxygenase, respectively. (B-D) Volcano plots reveal that GSH is significantly decreased in EA.hy926 (B), HMEC-1 (C), and HUVEC (D) cells grown under hypoxia versus normoxia (n=4). (E-G) [35S]-methionine incorporation into GSH is lower in hypoxia versus normoxia in the indicated cell lines. n = 3-6; *p=0.02, **p=0.007, and ***p=0.0002. (H-J) GSH levels are lower in the indicated cell lines. n = 3-6; *p=0.02 and **p=0.007, and ****p<0.0001. (K-M) Extracellular thiosulfate levels are higher in the indicated cell lines under hypoxia versus normoxia. n =3-5. *p= 0.017, ***p=0.0006, and ****p<0.0001. Samples in E-M were collected either at 24 h (Ea.hy926, HMEC-1) or at 16 h (HUVEC). Data represent mean ± S.D.
Figure 2.
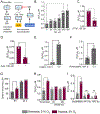
Figure 2.. Intersection of NO and HIF signaling in hypoxic regulation of H2S homeostasis.
(A) Scheme showing NO-induced switching at CTH from cysteine- (left) to H2S-generation (right). (B) Concentration-dependent increase in extracellular thiosulfate [S2O32−]ex accumulation by DETA NONOate in EA.hy926 cells under normoxia (4 h, n=3, **p=0.005). (C, D) Hypoxic thiosulfate accumulation after 24 h is decreased by the NO scavenger cPTIO (C) (n=3, *p=0.014) and by cystathionine (D, n=3, **p=0.003). (E,F) Cystine and homocystine increase [S2O32−]ex at 24 h in EA.hy926 cells (n=3 ***p=0.0006 and *p=0.013). (G) EA.hy926 scrambled controls show faster extracellular cystine consumption at 8 h (n=3 **p=0.006) (H,I) Knockdown of eNOS (H, using shRNA sequences 1 and 2, n=3, **p=0.008) or HIF1 or HIF2 (I, n=3, *p=0.002), in EA.hy926 cells decreased hypoxic [S2O32−]ex accumulation at 24 h. Error bars represent ± S.D.
Figure 3.
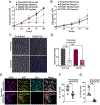
Figure 3.. SQOR knockdown decreases endothelial cell proliferation.
(A, B) SQOR KD decreases proliferation of EA.hy926 cells, which is more pronounced under hypoxic conditions (*p=0.0470,**p=0.0056) (A), while ETHE1 KD has no effect (B). (C, D) SQOR KD leads to defective tube formation (C) as evidenced by decreased vessel length (D). n=3, ***p=0.0004, ****p<0.0001. (E,F,G) Representative images for VEGF (10 ng/ml) induced sprouting of Ea.hy926 cells (E), quantitation of the number of tip cells (F,****p<0.0001) and Edu+ proliferating cells (G, p<0.0001). The dashed red line in E indicates the edge of the parent vessel. n=15 (F and G) and error bars are ± S.D.
Figure 4.
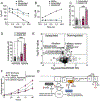
Figure 4.. Reductive shift in the mitochondrial NADH pool limits endothelial cell proliferation.
(A,B) Kinetics of H2S consumption (A) and thiosulfate production (B) by 10% (w/v) EA.hy926 cell suspensions (n=3) revealed a 2:1 H2S:S2O32− ratio for scrambled but not SQOR KD cells. (C, D) Comparison of glucose consumption (n=3, ****p<0.0001) (C), and lactate production (n=3 *p=0.0345, ****p<0.0001) (D) by Ea.hy926 grown for 48 h in 2 versus 21% O2. (E) Metabolomics data reveal increased levels of NADH-sensitive metabolites under normoxia in SQOR KD cells. (F) Expression of mt-LbNOX alleviates the growth restriction of SQOR KD EA.hy926 cells under normoxic and hypoxic conditions. Error bars are ± S.D. (G) Model explaining how SQOR KD exacerbates reductive stress due to increased hypoxic H2S synthesis, which can be alleviated by mtLbNOX.
Figure 5.
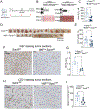
Figure 5.. SQOR activity supports tumor growth and angiogenesis.
(A) Scheme showing induction of SQOR KO and syngeneic tumor generation. (B) Western blot analysis validating SQOR KO in colon and liver of WBCre Sqrdlfl/fl mice. (C) Urinary thiosulfate is lower in WBCre Sqrdlfl/fl versus controls. (D) Tumors harvested from WBCre Sqrdfl/fl (n=10) versus Sqrdlfl/fl (n=14) mice. (E) Comparison of tumor mass in the two groups (**p=0.0093). (F,G) Representative Ki67 staining of tumor sections (F) and quantitation (G) (n=4 mice from each group, **p=0.0023). (H,I) Representative CD31 staining of tumor sections (H) and quantitation (I) (n= 3 mice from each group, two different areas, **p=0.0086). Error bars are ± S.D.
Figure 6.
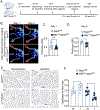
Figure 6.. Loss of SQOR decreases angiogenesis in a hind limb ischemia model.
(A) Experimental design for induction of hind limb ischemia by femoral artery ligation in SQOR KD versus control mice. (B) Laser doppler perfusion imaging at days 1 and 3 post hind limb ischemia. The top non-ischemic (NI) and bottom ischemic (I) limbs are labeled. The white ovals outline the distal regions where angiogenesis is stimulated following ischemia. (C and D) Blood perfusion is plotted as the ratio of ischemic:non-ischemic limb. (E) CD31 staining of gastrocnemius muscle harvested on day 9. Scale bar represents 50 μm. (F) Quantitation of CD31 staining as the ratio of capillaries:fiber from 6 different areas in 4 mice. Error bars are ± S.D.

Update of

References

    1. Carmeliet P. Angiogenesis in health and disease. Nat Med 9, 653–60 (2003). - PubMed
    1. Carmeliet P. Angiogenesis in life, disease and medicine. Nature 438, 932–6 (2005). - PubMed
    1. Folkman J. Angiogenesis. Annu Rev Med 57, 1–18 (2006). - PubMed
    1. Hurwitz H. et al. Bevacizumab plus irinotecan, fluorouracil, and leucovorin for metastatic colorectal cancer. N Engl J Med 350, 2335–42 (2004). - PubMed
    1. Ribatti D, Annese T, Ruggieri S, Tamma R & Crivellato E Limitations of Anti-Angiogenic Treatment of Tumors. Transl Oncol 12, 981–986 (2019). - PMC - PubMed

LinkOut - more resources