Comparative Study
. 2024 Apr;628(8006):186-194.
doi: 10.1038/s41586-024-07206-5. Epub 2024 Mar 20.

Compensatory evolution in NusG improves fitness of drug-resistant M. tuberculosis

Affiliations
Comparative Study

Compensatory evolution in NusG improves fitness of drug-resistant M. tuberculosis

Kathryn A Eckartt et al. Nature. 2024 Apr.

Abstract

Drug-resistant bacteria are emerging as a global threat, despite frequently being less fit than their drug-susceptible ancestors1-8. Here we sought to define the mechanisms that drive or buffer the fitness cost of rifampicin resistance (RifR) in the bacterial pathogen Mycobacterium tuberculosis (Mtb). Rifampicin inhibits RNA polymerase (RNAP) and is a cornerstone of modern short-course tuberculosis therapy9,10. However, RifR Mtb accounts for one-quarter of all deaths due to drug-resistant bacteria11,12. We took a comparative functional genomics approach to define processes that are differentially vulnerable to CRISPR interference (CRISPRi) inhibition in RifR Mtb. Among other hits, we found that the universally conserved transcription factor NusG is crucial for the fitness of RifR Mtb. In contrast to its role in Escherichia coli, Mtb NusG has an essential RNAP pro-pausing function mediated by distinct contacts with RNAP and the DNA13. We find this pro-pausing NusG-RNAP interface to be under positive selection in clinical RifR Mtb isolates. Mutations in the NusG-RNAP interface reduce pro-pausing activity and increase fitness of RifR Mtb. Collectively, these results define excessive RNAP pausing as a molecular mechanism that drives the fitness cost of RifR in Mtb, identify a new mechanism of compensation to overcome this cost, suggest rational approaches to exacerbate the fitness cost, and, more broadly, could inform new therapeutic approaches to develop drug combinations to slow the evolution of RifR in Mtb.


Conflict of interest statement

The authors declare no competing interests.

Figures

Fig. 1
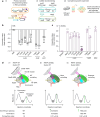
Fig. 1. A genetic screen to identify differential vulnerabilities in βS450L RifR Mtb.
a, Structural model of an Mtb RNAP transcription initiation complex bound to Rif. The sigma factor is shown as an orange outline. Inset, βSer450 is shown in pink. T-DNA, template DNA; NT-DNA, non-template DNA. b, Quantification of differential vulnerabilities (V). (1) An anhydrotetracycline (ATc)-inducible CRISPRi library was transformed into RifS and βS450L Mtb. Genes essential for in vitro growth were targeted with sgRNAs of varying predicted knockdown efficiencies. (2) Cultures were passaged and sgRNA abundance was assessed by deep sequencing at multiple timepoints. (3) A Bayesian model was then used to model the expression–fitness relationship (black and purple curved lines) for each gene. In brief, the x axis depicts predicted sgRNA strength (a proxy for the magnitude of target knockdown) and the y axis depicts bacterial fitness (predicted sgRNA log2-transformed fold change (log2FC) at 25 generations in the competitive growth experiment). The area above the expression–fitness curve was calculated to quantify gene vulnerability. Genes were called differentially vulnerable when the 95% credible region of the difference in gene vulnerabilities did not overlap 0. ΔV is differential vulnerability. Sth1 dCas9, Streptococcus thermophilus CRISPR1 dCas9. c, Scatter plot showing gene vulnerability (circles) in RifS and βS450L Mtb. Genes with significantly different vulnerabilities are shown in blue. CV, collateral vulnerability—that is, more vulnerable in βS450L; CI, collateral invulnerability—that is, less vulnerable in βS450L. df, Expression–fitness relationships for an example non-hit gene (nadB) (d), collateral vulnerability (ppk1) (e) and collateral invulnerability (clpB) (f). Light coloured lines represent the fits determined by 1,000 samples from the posterior distributions; dark lines represent the mean fits. g, Histogram showing the gene-level mean differences in the fitness cost imposed by the weakest possible sgRNAs (Fmin) between RifS and βS450L Mtb. Dashed lines mark two s.d. from the mean. h, Histograms showing the Fmin distributions for nadB and secE1 between RifS and βS450L Mtb.
Fig. 2
Fig. 2. Pathway analysis identifies differentially vulnerable processes in βS450L Mtb.
a, Bubble plot of enriched (P ≤ 0.05) pathways for the genes identified as differential vulnerabilities in βS450L. Pathways highlighted in blue are related to translation. P values and odds ratios were determined by Fischer’s exact test. b, The distribution of nusG Fmin values in RifS (grey) and βS450L (purple) Mtb. Dashed lines represent the 95% credible region. c, Phenotypic consequences of strong and hypomorphic knockdown of nusG (sgRNA predicted strength = 0.81 and 0.10, respectively, where 1.0 represents the strongest possible sgRNA) in RifS and βS450L Mtb. NT, non-targeting sgRNA. d, Structure of paused Mtb RNAP bound to NusG. The RNAP swivel module was defined by Delbeau et al..
Fig. 3
Fig. 3. NusG mutations are associated with RifR in clinical Mtb isolates.
a, Manhattan plot showing the genetic association with RifR among 3,252 clinical Mtb isolates from Peru. Each circle represents a gene or intergenic region in the Mtb genome. The y axis represents uncorrected phyOverlap P values (blue, P ≤ 0.05). Circle sizes are scaled by the number of independent mutations observed for that gene or intergenic region. P values were derived from 50,000 permutations of mutations events, as described in Methods. b, Phylogenetic tree of Peruvian Mtb isolates from a. Mycobacterium canetti was included as an outgroup; isolates from lineages 2 and 4 (L2 and L4) are indicated. Purple lines represent isolates identified as RifR by genotypic drug susceptibility testing (gDST). Yellow triangles mark isolates with a known compensatory (comp) mutation in rpoA/C (Supplementary Table 2) and blue triangles mark isolates harbouring a nonsynonymous (NS) mutation in nusG. ce, Box plots showing the ratio of nonsynonymous to synonymous mutations (dN/dS) for nusG and rpoC in genotypically predicted RifS (nusG, n = 1,365; rpoC, n = 15,834) and RifR (nusG, n = 350; rpoC, n = 10,418) Mtb (c), restricting the analysis to only RifR strains with mutations in Ser450 (nusG, n = 270; rpoC, n = 7,898) (d), or restricting the analysis to only RifR strains with mutations in His445 (nusG, n = 26; rpoC, n = 996) (e). X indicates any amino acid except Ser (S450) or His (H445). The centre line represents the mean, box edges delineate top and bottom quartiles, and whiskers indicate the minimum and maximum dN/dS values. P values by independent two-sample t-test. Two-sided P values: **P = 1.14 × 10−3, ***P ≤ 0.0001.
Fig. 4
Fig. 4. Clinical strain mutations decrease the pro-pausing activity of NusG.
a, Cryo-EM structure of a NusG-bound paused elongation complex from Mtb. The boxed area shows the location of mutations observed in RifR clinical Mtb isolates. Interactions between NusG and the β-protrusion or non-template DNA are shown in green dashed lines. b, Promoter template with the Mtb rrf termination sequence for in vitro transcription assays. The experimental schematic was followed for data shown in cf. c, In vitro termination by Mtb RNAP on a promoter-initiated template with or without wild-type (WT) NusG. The U26, C-less halt site is labelled (Halt), as well as approximately +150 base termination site (Term) and +263 base runoff (Runoff). d, Termination efficiencies of wild-type and βS450L RNAP in the presence (two-sided adjusted P value = 0.039) or absence (two-sided adjusted P value = 0.002) of wild-type NusG. Data are mean ± s.d. from three experimental replicates. e, Fold change in termination (∆T) relative to wild-type RNAP plus wild-type NusG. Data are mean ± s.d. from three experimental replicates. ∆T for each NusG protein was calculated from kinetics of the elongation versus termination process as described by von Hippel and Yager, based on the relationships between termination efficiency and the rates and activation energies of termination (Methods). Left to right, two-sided adjusted P value: 0.009, 0.006, 0.024 and 0.057. f, Fold change in termination as in e, relative to βS450L RNAP plus wild-type NusG. Left to right, two-sided adjusted P value: 0.009, 0.006, 0.038 and 8.7 × 10−4. (df) Independent two-sample t-test, with multiple hypothesis correction by Benjamini, Krieger and Yekutieli method. *P ≤ 0.05, **P ≤ 0.01, ***P ≤ 0.001; NS, not significant.
Fig. 5
Fig. 5. Compensatory mutations in nusG increase the fitness of βS450L Mtb.
a, Experimental design to quantify the competitive fitness of nusG, rpoB and rpoC mutants in RifS and βS450L Mtb. (1) Generation of barcode (BC) library; asterisk indicates premature stop codon. (2) ssDNA recombineering to generate mutants of interest. (3) Pooled, competitive growth experiment. Oligo, oligonucleotide. b,c, Competitive index (mean ± s.d. from 3 biological replicates) of each mutant relative to the RifS base strain (no mutations in nusG, rpoB or rpoC). The competitive index of each mutant was normalized to its respective base strain, RifS or βS450L, by subtracting the competitive index of the base strain. nusG-T200A is a control mutation not associated with RifR in clinical isolates and is thus not expected to restore fitness to βS450L Mtb. For reference, the fitness of βS450L relative to RifS in this experiment is 0.96. Paired two-sided t-test. **P ≤ 0.01, ***P ≤ 0.001. d, Model explaining the mechanism of reduced fitness of βS450L Mtb and its compensation. The βS450L RNAP elongates more slowly and is thus more likely to swivel and enter the paused and termination states. This effect is exacerbated by the pro-pausing wild-type NusG, as illustrated by an increase in the activation barrier of elongation. These interactions decrease βS450L Mtb fitness. Note that the competitive index values shown here are not base-subtracted as they are in b,c. Compensatory mutations at the NusG–β-protrusion or NusG–NT-DNA interface reduce the ability of NusG to stabilize the swivelled state, as illustrated by a relative decrease in the activation barrier of elongation. These mutations restore βS450L RNAP pausing and termination levels closer to wild-type RNAP and increase βS450L Mtb fitness.

References

    1. Andersson, D. I. & Hughes, D. Antibiotic resistance and its cost: is it possible to reverse resistance? Nat. Rev. Microbiol.8, 260–271 (2010). - PubMed
    1. Björkholm, B. et al. Mutation frequency and biological cost of antibiotic resistance in Helicobacter pylori. Proc. Natl Acad. Sci. USA98, 14607–14612 (2001). - PMC - PubMed
    1. Andersson, D. I. & Levin, B. R. The biological cost of antibiotic resistance. Curr. Opin. Microbiol.2, 489–493 (1999). - PubMed
    1. Björkman, J., Hughes, D. & Andersson, D. I. Virulence of antibiotic-resistant Salmonella typhimurium. Proc. Natl Acad. Sci. USA95, 3949–3953 (1998). - PMC - PubMed
    1. Billington, O. J., McHugh, T. D. & Gillespie, S. H. Physiological cost of rifampin resistance induced in vitro in Mycobacterium tuberculosis. Antimicrob. Agents Chemother.43, 1866–1869 (1999). - PMC - PubMed

Publication types

MeSH terms