. 2024 Apr;628(8008):612-619.
doi: 10.1038/s41586-024-07202-9. Epub 2024 Mar 20.

Venous-plexus-associated lymphoid hubs support meningeal humoral immunity

Affiliations

Venous-plexus-associated lymphoid hubs support meningeal humoral immunity

Zachary Fitzpatrick et al. Nature. 2024 Apr.

Abstract

There is increasing interest in how immune cells in the meninges-the membranes that surround the brain and spinal cord-contribute to homeostasis and disease in the central nervous system1,2. The outer layer of the meninges, the dura mater, has recently been described to contain both innate and adaptive immune cells, and functions as a site for B cell development3-6. Here we identify organized lymphoid structures that protect fenestrated vasculature in the dura mater. The most elaborate of these dural-associated lymphoid tissues (DALT) surrounded the rostral-rhinal confluence of the sinuses and included lymphatic vessels. We termed this structure, which interfaces with the skull bone marrow and a comparable venous plexus at the skull base, the rostral-rhinal venolymphatic hub. Immune aggregates were present in DALT during homeostasis and expanded with age or after challenge with systemic or nasal antigens. DALT contain germinal centre B cells and support the generation of somatically mutated, antibody-producing cells in response to a nasal pathogen challenge. Inhibition of lymphocyte entry into the rostral-rhinal hub at the time of nasal viral challenge abrogated the generation of germinal centre B cells and class-switched plasma cells, as did perturbation of B-T cell interactions. These data demonstrate a lymphoid structure around vasculature in the dura mater that can sample antigens and rapidly support humoral immune responses after local pathogen challenge.


Conflict of interest statement

Competing interests J.S.R. and V.C. are affiliated with NeuroSimplicity, which is a medical device and technology company focused on medical image processing.

Figures

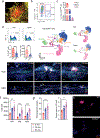
Extended Data Fig. 1 |
Extended Data Fig. 1 |. DALT stromal cell populations, immune aggregate expansion with aging and absence in RORγt−/− mice.
a, Confocal image of the rostral-rhinal hub from a representative naïve mouse shows staining of podoplanin (yellow) and CD45 (red) (scale bar, 50 μm) (n = 3). b, Representative flow cytometric plot of stromal cell populations in a representative rostral-rhinal hub sample. c, Quantification of fibroblastic reticular, blood endothelial and lymphatic endothelial cells in steady-state rostral-rhinal hub samples (n = 5 mice; mean ± SD). d, Representative flow cytometric plots show the percentage of CD45+ cells isolated from the rostral-rhinal hub versus the meningeal lobes of naïve B6 mice at 13 weeks of age. Bars depict the frequency and absolute number of CD45+ cells from each location. UMAPs show the immune subsets found in the rostral-rhinal hub and lobes combined (centre) versus each individual location (far right). B cells (TCRβB220+CD19+), CD4+ T cells (TCRβ+CD3+CD8CD4+), CD8+ T cells (TCRβ+CD3+CD8+CD4), type 2 innate lymphoid cells (ILC2s) (TCRβCD3CD127+ST2+), plasmacytoid dendritic cells (pDCs) (CD11c+Ly6C+B220+), monocyte-derived DCs (moDCs) (CD11b+F4/80loCD11c+Ly6Clo), inflammatory monocytes (CD11+CX3CR1loLy6Chi), patrolling monocytes (CD11+CX3CR1hiLy6Clo), and neutrophils (CD11b+Ly6G+) are labelled (n = 5 mice per group; **p = 0.0018, unpaired two-tailed Student’s t-test; one of two independent experiments; mean ± SEM). e, Representative confocal images of rostral-rhinal hubs (scale bar, 70 μm) and SSS (scale bar, 50 μm) immunolabeled for CD4 (green), CD8 (white), B220 (red) and CD45 (blue) from 8-, 26-, and 60-week-old naïve mice (yellow arrows denote immune clusters f, Quantification of CD4+, CD8+ and B220+ cells in meningeal whole-mount tissue from indicated age groups (n = 4–5 mice per group; 8-week-old vs. 60-week-old mice, CD4: **p = 0.0047; CD8: ***p = 0.0004; B220: ****p = 0.00002, unpaired two-tailed Student’s t-test; mean ± SD). g, Quantification of total lymphoid cluster number (n = 4–5 mice per group; 8-week-old vs. 60-week-old mice, ***p = 0.0006, unpaired two-tailed Student’s t-test) and average area (n = 4–5 mice per group; 8-week-old vs. 60-week-old mice, **p = 0.0014, unpaired two-tailed Student’s t-test; mean ± SD) in indicated age groups (one of two replicated experiments). h, Confocal images of rostral-rhinal hubs from wild-type (WT) and RORγt−/− mice (scale bar, 50 μm) (n = 4 WT and n = 3 RORγt−/−).
Extended Data Fig. 2 |
Extended Data Fig. 2 |. Development of the rostral-rhinal venolymphatic hub.
Representative images are shown. Gross evaluation of the mouse head at post-natal day 9 (P9 mouse, gross) under 2X magnification reveals that the superior sagittal sinus has not yet developed. Rather, the rostral rhinal confluence (red box) is the main venous drainage of the head at this stage, connecting to the olfactory sinus, rostral rhinal veins, developing diploic veins, and developing superior sagittal sinus. Micro-computed tomography (Micro-CT) of the intact mouse head at post-natal day 8 (P8) following terminal vascular casting with Microfil® polymer, fixation, decalcification, and 3-day immersion in phosphotungstic acid (PTA), which binds protein, shows the rostral rhinal venous hub (red box) (n = 3 mice per group). The developing superior sagittal sinus and olfactory sinus are connected to this hub. The developing caudal confluence of sinuses, median vein, and tentorial sinuses, all providing venous drainage to the posterior aspect of the head are appreciated. In this Micro-CT of the P8 mouse head, the polymer is hyper-dense, as is the bone, which has bound PTA. Volumetric reconstruction and three-dimensional render of the Micro-CT of the P8 mouse head (3D visualization of Micro-CT of polymer-casted P8 mouse) shows the relationships of this anatomy. Gross evaluation of the mouse head at post-natal day 12 (P12) (n = 3 mice per group), shows that the rostral rhinal hub (red box) is the main site of continued post-natal initial development and organization of veins bridging from the intracranial space, e.g., dural sinuses, to the diploic veins entering the calvarial bone marrow, which can be seen throughout the anterior aspect of the head here. The superior sagittal sinus at this stage is still developing, as is the caudal confluence of sinuses. The olfactory and rostral rhinal sinuses have also increased in this period from P9 to P12. Micro-CT of the adult mouse following vascular casting, decalcification, and immersion in PTA (2 weeks) allows visualization of bone, all soft tissues, and vessels. In the axial view, lymphatic vessels, which are hyper-dense due to the binding of PTA to protein within these vessels, within the wall of the superior sagittal and olfactory sinuses are seen coalescing at the dura lining the rostral rhinal venolymphatic hub (red box); this is the dural-associated lymphoid tissue (DALT). The sagittal view shows falcine lymphatic vessels (arrowhead) between the olfactory bulb and cortex connecting to the DALT (arrow) lining the rostral-rhinal venolymphatic hub (asterisk), which resides in the depression in the calvarium; this depression enters the diploic space between the inner and outer table of the bone. The coronal view also shows the falcine lymphatic vessels arising between the olfactory bulbs and travelling into the wall of the olfactory sinus; there are also falcine lymphatic vessels connecting to the dural lining the olfactory venous plexus inferiorly. Sagittal view of the three-dimensional visualization of vessels, brain, and bone from iterative micro-CT of the adult mouse head shows the rostral-rhinal venolymphatic hub (red box) within the depression in the calvarium (left) (n = 5 mice per group). The superior sagittal sinus has two components—one dural and one within the diploic space, which can be appreciated when the bone is removed (right). This visualization is obtained by registration of a bone mesh (blue) from micro-CT before processing, vessels (white) extracted from the micro-CT following decalcification, and brain extracted from micro-CT following immersion in PTA; the Allen Atlas CCF v.3 are registered to the brain and shown in multicolour.
Extended Data Fig. 3 |
Extended Data Fig. 3 |. Rostral-rhinal and basal olfactory venous hubs under homeostasis and bead acquisition by hub lymphatics.
a, Representative confocal image of a sagittal brain section from a VE-Cadherincre/+ Stopfl/fl TdTomato (red) mouse immunolabelled for Lyve1 (green), CD45 (white), and E-cadherin. Nuclei are blue. Bone marrow (BM), skull bone, bone recess, the rostral-rhinal hub (hub), arachnoid mater, and olfactory bulb are labelled in the merged image (scale bar, 100 μm) (n = 3 mice). b, Representative confocal images of the basal olfactory venous plexus immunolabeled for CD4 (blue), B220 (white), CD45 (red) in a naive CX3CR1gfp/+ (green) mouse (scale bar, 400 μm); right, high-magnification image of highlighted box (scale bar, 50 μm) (n = 3 mice). c, Confocal images of the rostral-rhinal hub of a mouse 6 and 16 hrs following intravenous injection of 0.2 μm beads (green). Hub is immunolabeled for CD45 (blue) and Lyve1 (red). White arrows denote beads inside Lyve1+ lymphatic vessels. (scale bar, 20 μm) (n = 3 mice per group; one of two independent experiments).
Extended Data Fig. 4 |
Extended Data Fig. 4 |. Identification of DALT in human dura samples.
a, Confocal images of human dural tissue immunolabelled for CD3 (magenta), CD20 (green), and CD31 (red), with nuclei shown in cyan (scale bar, 50 μm). b, Confocal images of human dural tissue immunolabelled for CD3 (magenta), and CD19 (green), with nuclei shown in blue (scale bar, 40 μm). c, Confocal image of human dural tissue immunolabelled for CD3 (red), CD20 (green), and Lyve1 (cyan), with nuclei shown in blue (scale bar, 25 μm). d, A representative section of human dura mater including the superior sagittal sinus (SSS) was immunolabeled with antibodies against IBA1 (myeloid cells), CD4, CD8, and CD20 (B cells). The fluorescent channel for each immunolabel is overlayed on a brightfield image of the tissue. The magnified images at the bottom are denoted with a yellow box in the lower power view above. (upper scale bar, 250 μm; lower scale bar, 31 μm). The images shown in panels a to d were captured from four different patient samples.
Extended Data Fig. 5 |
Extended Data Fig. 5 |. Dextran uptake, DALT disorganization in LTα-deficient animals, IL21-expression and B cell distribution after VSV infection.
a, Super resolution confocal image of the vascular network (CD31, red) within the rostral-rhinal hub of a mouse following intravenous administration of 2,000 kDa dextran (green) (scale bar, 100 μm) (n = 6). b, Confocal image of the rostral-rhinal hub following 2,000 kDa dextran (green) administration (scale bar, 20 μm). Inset shows high power image of a macrophage (F4/80, red) with internalized dextran (scale bar, 4 μm) (n = 6). c, Representative confocal images of rostral-rhinal hubs immunostained for CD4 (red) and B220 (green) from IL21 reporter (white) mice 8 days post intranasal VSV infection (scale bar, 100 μm); bottom, higher magnification image of highlighted box (scale bar, 20 μm) (blue arrows indicate IL21-mCherry-expressing CD4+ cells within a B cell cluster) (n = 4 mice total from two independent experiments). d, Representative confocal images of rostral-rhinal hubs immunostained for CD4 (green) and B220 (red) from WT and LTα−/− animals 7 days after intranasal VSV inoculation (scale bar, 100 μm) (n = 4 mice per group; one of two independent experiments). e, Histo-cytometric dot plots of meningeal whole-mount tissue immunolabeled for IgA (blue) and IgG (red) from mice at the indicated timepoints post intranasal VSV inoculation. f, Quantification of IgA+ and IgG+ cells by meningeal whole-mount confocal imaging in rostral-rhinal hub and superior sagittal sinus at the indicated timepoints post-VSV infection (n = 4–5 mice per group; mean ± SD).
Extended Data Fig. 6 |
Extended Data Fig. 6 |. Analysis of gene expression in the rostral-rhinal hubs of naïve versus VSV-infected mice.
a, Mean expression dot plot of marker genes used to define cell type annotations in single cell RNAseq data from the rostral-rhinal hubs of naïve and d8 VSV-infected mice. See Fig. 4g and Extended Data Fig. 6c. Size of circles indicate proportion of cells expressing the gene, and increasing gradient from purple to blue to yellow corresponds to increasing mean expression (scaled from 0 to 1). b, Mean expression dot plot of B cell and Tfh related genes plotted for the denoted cell types. Size of circles indicate proportion of cells expressing the gene, and increasing gradient from white to blue corresponds to increasing mean expression (scaled from 0 to 1). c, Top: UMAP embedding of 10,839 cells from the rostral-rhinal hubs of naive and d8 VSV-infected mice coloured according to treatment group. Bottom: UMAP embedding of 812 developing B cells, plasmablast/plasma cell, GC B cells, Tfh cells, Tfr cells and B-T multiplets coloured according to experimental group. d, Mean expression dot plot of genes encoding surface receptors, BCR signalling molecules, Ig isotype, proliferation and transcriptions factors in B GC cells and B plasmablast/plasma cells from the rostral-rhinal hubs of naïve versus VSV-infected mice. A dot plot is also shown for Tfh associated genes in Tfh cells. Size of circles indicate proportion of cells expressing the gene and increasing gradient from white to blue corresponds to increasing mean expression (scaled from 0 to 1).
Extended Data Fig. 7 |
Extended Data Fig. 7 |. Analysis of BCR clones in the superior sagittal sinus and skull bone marrow.
a, Representative BCR clone network plots in sagittal sinus and skull bone marrow coloured by immunoglobulin isotype in naïve, week 1 and week 3 of VSV infection. Networks were down-sampled to the same sequencing depth (per tissue type; n = 2500 and n = 5000 UMI counts for sagittal sinus and skull bone marrow, respectively) before plotting. Each node represents a unique BCR, and each connected component represents a single clone. Edges between nodes are due to non-indel differences between pairs of BCRs. Sizes of nodes are scaled according to UMI count. b, Stacked bar charts of isotype usage amongst clones in the sagittal sinus and skull bone marrow in naïve, week 1 and week 3 of VSV infection. BCR networks were down-sampled to the same sequencing depth, and clone isotype usage was tabulated per sample and represented as a percentage out of 100%. (n = 4–5 mice per group).
Extended Data Fig. 8 |
Extended Data Fig. 8 |. Analysis of BCR clonal overlap in the rostral-rhinal hub, skull bone marrow, and superior sagittal sinus.
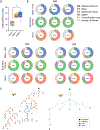
a, Unique rostral-rhinal hub BCRs in naïve, week 1 and week 3 of VSV infection (all isotypes considered) per sample (n = 4–5 mice per group; non-parametric Kruskal-Wallis test with Dunn’s multiple comparisons correction; **p = 0.0327). Boxes capture the first to third quartiles, and whiskers span from minima to maxima on each side of the box, respectively. b, Pie charts of IgM, IgG, and IgA clone overlaps in rostral-rhinal hub, skull bone marrow and sagittal sinus in naïve, week 1 and week 3 of VSV infection. For each tissue type, the proportion in each pie chart is a proportion of clones within that tissue. The largest slice of each pie chart corresponds to the proportion of clones that are found unique to the main tissue type, and smaller slices represent the proportion of clones found overlapping between the main tissue type and the other respective tissues. A singular grey slice is used for clones that are found to overlap between more than 2 tissue types. c, Representative reconstructed BCR lineage trees for clones found to be shared between the rostral-rhinal hub and superior sagittal sinus. Each coloured node is a unique BCR sequence found in a clone, coloured according to tissue source. Black nodes are germline sequences and white nodes are inferred nodes. Numbers of edges indicate the distance (mutation count) away from the parent nodes.
Extended Data Fig. 9 |
Extended Data Fig. 9 |. Germinal centre B cell depletion following transcranial CD40L blockade.
a, Representative flow cytometric plots of GL7+Fas+ germinal centre B cells in rostral-rhinal hub samples from mice 10 days after intranasal VSV inoculation with a sub-scalp (transcranial) course of either isotype control or αCD40L neutralizing antibody. Graphs show quantification of percent GL7+Fas+ germinal centre B cells of total B cells in rostral-rhinal hubs following transcranial CD40L blockade versus control (n = 4–5 mice per group; **p = 0.0010, unpaired two-tailed Student’s t-test; mean ± SD) and total cell counts (n = 4–5 mice per group; *p = 0.0145, unpaired two-tailed Student’s t-test; mean ± SD) (one of two independent experiments). b, Quantification of percent GL7+Fas+ germinal centre B cells (n = 4–5 mice per group; ****p < 0.0001, unpaired two-tailed Student’s t-test) and total cell counts in spleens of mice treated transcranially with either isotype control or αCD40L (n = 4–5 mice per group; **p = 0.0081, unpaired two-tailed Student’s t-test; mean ± SD). c, Confocal images of rostral-rhinal hubs immunolabeled for IgA (blue), IgG (green) and B220 (red) from mice 8 days after intranasal challenge with VSV during transcranial CD40L blockade (scale bar, 100 μm). d, Quantification of IgA+ and IgG+ cells in rostral-rhinal hubs 8 days post intranasal challenge with VSV (n = 7 mice per group; IgA: **p = 0.0092, IgG: *p = 0.0150, unpaired two-tailed Student’s t-test; mean ± SD). e, Relative expression of VSV-specific mRNA in olfactory bulbs of animals treated transcranially with isotype control or αCD40L neutralizing antibody 8 days after intranasal VSV infection (n = 8–10 mice per group; ****p < 0.0001, two-tailed Mann-Whitney test; mean ± SD). f, Representative flow cytometric plots show the frequency of B220+TFP+ VSV-specific (VI10YEN) B cells in the rostral-rhinal hubs of uninfected (n = 6 mice per group) versus day 21 post-VSV infection mice. VSV infected mice received anti-LFA1/VLA4 (n = 4 mice per group) or isotype control (n = 5 mice per group) antibodies beginning at day 6 and VSV-specific B cells adoptively transferred at day 7. g, Bar graphs depict the absolute number of VI10YEN B cells (left; **p = 0.0024 and 0.0011, one-way ANOVA multiple comparisons) and of GL7+Fas+ GC VI10YEN B cells (right; **p = 0.0039 and 0.0015, one-way ANOVA multiple comparisons; mean ± SEM) (one of two independent experiments).
Extended Data Fig. 10 |
Extended Data Fig. 10 |. Gating strategy used to identify rostral-rhinal hub B cells and bead acquisition by hub immune cells.
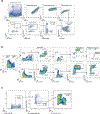
a, Representative flow cytometry plots depict to the gating strategy used to identify and characterize B cells extracted from the rostral-rhinal hub. b, Representative flow cytometry plots show the gating strategy used to identify immune cells in the rostral-rhinal hub that acquired 0.2 μm beads injected intravenously. See Fig. 3g. c, Representative flow cytometry plots show the gating strategy used to identify GC B cells for the plots shown in Fig. 4k.
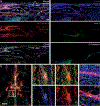
Fig. 1 |
Fig. 1 |. DALT is localized to the rostral-rhinal hub.
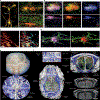
a, Confocal images of dural whole-mount tissue from naive Cx3cr1GFP/+ mice. Immune cells (CD45+, red) and mononuclear phagocytes (CX3CR1+, green) identified along the transverse sinus (TS) and superior sagittal sinus (SSS) (left) (n = 3 mice). The white square denotes a major aggregate of immune cells (rostral-rhinal hub), which is shown at a higher magnification at the top right. Smaller aggregates of CD45+ immune cells evident along the SSS are shown at the bottom right. Scale bars, 1,000 μm (left), 150 μm (top right) and 50 μm (bottom right). b, The rostral-rhinal hub (top) and SSS (bottom) contain cells expressing CD45 (red), B220 (white), CD3 (blue) and CD11c (green). The white dashed line delineates the wall of the SSS (n = 3 mice). Scale bars, 50 μm. c,d, Immunostaining of the rostral-rhinal hub for PV1 (green), CD31 (red) and CD45 (cyan) (c; n = 6), and LYVE1 (green), CD4 (blue), B220 (white) and CD45 (red) (d; n = 4). Scale bars, 35 μm (c) and 70 μm (d). e, Gross evaluation of the underside of the calvarium revealed a bony recess (red box) at the location of the rostral confluence of sinuses (n = 5) (top). Bottom, WT adult C57BL/6J mice (aged 5 months) were iteratively imaged using micro-CT analysis of the whole head after terminal vascular casting, decalcification and immersion in phosphotungstic acid to visualize the bone, vasculature and soft tissue, including the meninges and brain. An axial section of 3D volumetric rendering of registered micro-CT images, segmented vessels (white) and bone mesh (blue) matching the gross dissection of the calvarium reveals that the bony recess contains the rostral confluence of sinuses (red box), which receives the olfactory sinus, superior sagittal sinus, rostral-rhinal sinuses, bridging veins and diploic veins. n = 7. f, Gross view of the 3D visualization of the whole head with brain regions from the Allen reference atlas CCF v.3 (multicolour) registered to the same space. The red box and corresponding inset in the axial view show the rostral confluence of sinuses that we have found to be a venolymphatic hub with dural-associated lymphatic tissue. This hub is continuous with the olfactory sinus, diploic veins, rostral-rhinal sinuses, superior sagittal sinus and cortical veins, which receive drainage from the leptomeningeal veins. g, The coronal view shows the connections of the rostral-rhinal sinuses and cortical veins of the olfactory bulbs to this hub (red box). This hub is also connected to the olfactory venous plexus at the skull base through falcine veins (top). Bottom, raw data from the micro-CT imaging after vascular casting, decalcification and immersion in phosphotungstic acid reveals lymphatic vessels (arrowheads) surrounding the superior sagittal sinus and connected to the dural associated lymphatic tissue in the coronal views. Lymphatic vessels within the falx between the olfactory bulbs is also seen on the coronal view.
Fig. 2 |
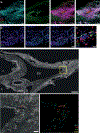
Fig. 2 |. The rostral-rhinal hub contains GC cells during steady state.
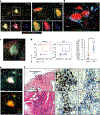
a, Representative confocal images of rostral-rhinal hub from young (aged 15 weeks) and old (aged 55 weeks) mice immunostained for B220 (red), CD4 (green), Ki-67 (white) and GL7 (blue). Bottom, higher-magnification images of the highlighted boxes. n = 4–5 mice per group. Scale bars, 50 μm (top) and 30 μm (bottom). b, Confocal image of the rostral-rhinal hub from an old (aged 60 weeks) Blimp1eYFP/+ (green) mouse immunostained for B220 (red) and CD138 (blue). Scale bar, 50 μm. n = 4 mice. c, Immunostaining of the rostral-rhinal hub for CD138 (red), B220 (white), CD3 (green) and IgA (blue). Scale bar, 30 μm. n = 4. d, Representative flow cytometry plots of meningeal CD19+ cells, co-expressing GC markers GL7 and FAS (CD95) and quantification of GL7+FAS+ meningeal B cells from young versus old naive mice. n = 6–7 mice per group. Statistical analysis was performed using a two-tailed Mann–Whitney U-test; P = 0.0012. Two independent experiments. Data are mean ± s.d. e, Confocal image of a B cell cluster in the rostral-rhinal hub immunolabelled for BAFF (green), B220 (red) and CD45 (cyan). Scale bar, 50 μm. n = 5. f, Sections of human dura mater obtained from the anterior cranial fossa of one patient was stained with haematoxylin and eosin (H&E; left) or immunolabelled using antibodies against CD68 (macrophages), CD79α (B cells), CD3 (T cells) and IgA (middle and right). Scale bars, 355 μm (top left), 88 μm (bottom left) and 15 μm (right). The region indicated by a black box in the top left image is magnified at the bottom left. The dotted black lines delineate the brain- and skull-interfacing surfaces of the dural tissue.
Fig. 3 |
Fig. 3 |. Circulating antigens are deposited within DALT and can activate and expand resident B cells.
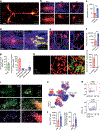
a,b, Representative confocal image of a meningeal whole-mount from a mouse 90 min after intravenous injection with fluorescently labelled 0.2 μm beads (green), immunolabelled for CD45 (red) (scale bar, 1,000 μm) (a), and high-magnification images of the rostral-rhinal hub (scale bar, 100 μm), SSS (scale bar, 50 μm) and TS (scale bar, 70 μm) with collagen IV immunostain (blue) (b). c, Quantification of total beads in the meningeal lobe versus sinus regions normalized to area. n = 4 mice per group. Statistical analysis was performed using an unpaired two-tailed Student’s t-test; **P = 0.0028. One out of two independent experiments. Data are mean ± s.d. d,e, Confocal images of rostral-rhinal hubs from mice that received either 2.0 μm or 0.2 μm beads (green) intravenously, immunolabelled for CD45 (red) and collagen IV (blue) (scale bar, 150 μm) (d), and high-magnification confocal images of the rostral-rhinal hub from a mouse that was injected intravenously with 0.2 μm beads (green) and immunostained for CD45 (red) and ER-TR7 (blue) (scale bar, 10 μm) (e); a higher-magnification image of the region highlighted by a box is shown on the right (scale bar, 5 μm). f, Quantification of the total beads in the rostral-rhinal hub from mice that received either 2.0 μm or 0.2 μm beads intravenously. n = 4–5 mice per group. Statistical analysis was performed using an unpaired two-tailed Student’s t-test; **P = 0.0061. One out of two independent experiments. Data are mean ± s.d. g, The percentage of CD45+ leukocytes in the rostral-rhinal hub containing 0.2 μm beads (left). Right, the percentage bead-positive cells that are B cells, neutrophils, dendritic cells and macrophages. The flow cytometry gating strategy is shown in Extended Data Fig. 10b. n = 5 mice per group. One out of two independent experiments. Data are mean ± s.e.m. h, Representative confocal image of the rostral-rhinal hub from a mouse 60 min after an intravenous injection with S. aureus bioparticles (cyan) and immunolabelled for CD31 (green) and F4/80 (red) (left three images). Scale bar, 15 μm. n = 5. Right, quantification of bioparticle number per hub in mice receiving S. aureus bioparticles (n = 5 mice per group) versus a vehicle control group (n = 4 mice per group). Statistical analysis was performed using an unpaired two-tailed Student’s t-test; ****P < 0.0001. Data are mean ± s.e.m. i, Representative confocal images of rostral-rhinal hubs from mice 20 h after an intravenous injection of either PBS or LPS immunolabelled for B220 (red), CD4 (blue), Ki-67 (white) and CD45 (green) (scale bar, 150 μm) (top). Middle and bottom, higher-magnification images of the regions indicated by boxes (scale bar, 20 μm). j, UMAP of flow cytometry data showing the adaptive immune cell landscape in the rostral-rhinal hub 20 h after an intravenous injection of either PBS or LPS. k,l, Representative flow cytometry plot of CD86 expression on CD19+ hub B cells from mice injected with either PBS or LPS (k), quantification of total CD19+ hub B cells (n = 4–5 mice per group; **P = 0.0077, unpaired two-tailed Student’s t-test) and the percentage of cells expressing CD86 (n = 4–5 mice per group; **P = 0.0011, unpaired two-tailed Student’s t-test; one out of two independent experiments) (l). For l, data are mean ± s.d.
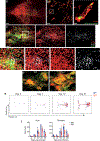
Fig. 4 |
Fig. 4 |. GC induction in the rostral-rhinal hub after intranasal VSV challenge.
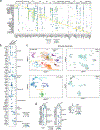
a, Representative confocal images of rostral-rhinal hubs immunolabelled for B220 (red) and CXCL13 (white) from a naive mouse and a mouse 7 days after intranasal challenge with VSV (top). Bottom, higher-magnification image of the region indicated by a box at the top, with CD4 (green) and CD45 (blue) immunolabelling. Scale bars, 100 μm (top) and 30 μm (bottom). b, Quantification of CXCL13-expressing cells in the rostral-rhinal hub 7 days after intranasal challenge with VSV. n = 3–4 mice per group. Statistical analysis was performed using an unpaired two-tailed Student’s t-test; *P = 0.0248. c, Representative flow cytometry analysis of CXCR5-expressing B cells from the rostral-rhinal hubs of either a naive or VSV-challenged mouse. d, Quantification of the total CXCR5+CD19+ B cells in rostral-rhinal hub samples from naive and VSV-challenged mice. n = 4–5 mice per group. Statistical analysis was performed using an unpaired two-tailed Student’s t-test; **P = 0.0028. Data are mean ± s.d. e, Representative flow cytometry analysis of the frequencies of endogenous versus TFP+ VI10YEN VSV-specific B cells in the rostral-rhinal hub expressing GL7 and FAS. The bar graphs show the percentage and number of endogenous versus VI10YEN B cells (top) as well as GC B cells. n = 5 mice per group. Statistical analysis was performed using unpaired two-tailed Student’s t-tests; ***P = 0.0008, ****P < 0.0001. One out of two independent experiments. Data are mean ± s.e.m. f, Representative confocal images of the rostral-rhinal hub from day-10 VSV-infected mice that received CD45.1+ KL25 (left) or CD45.1+ VI10YEN (right) B cells on day −1. Hubs were immunolabelled for CD45.1 (green) and vimentin (red). Scale bar, 30 μm. n = 5 mice per group. One out of two independent experiments. g, UMAP showing scRNA-seq data of 10,839 cells from the rostral-rhinal hubs of naive and day-8 VSV-infected mice (top). Each dot represents a single cell and is coloured according to cell type annotation based on canonical marker genes. Bottom, UMAP embedding of 812 developing B cells, plasmablast/plasma cells, GC B cells, TFH cells, TFR cells and B–T multiplets from the hubs of naive and day-8 VSV-infected mice. cDC1, type 1 conventional dendritic cells; gdT, γδ T cells; moDC, monocyte-derived dendritic cells; prolif. T, proliferating T cells; Teff/em, T effector and effector memory cells; TNV/EM, naive T cells and effector memory T cells; Treg, regulatory T cells; Tfh, T follicular helper cell; Tfr, T follicular regulatory cell; ILC2, innate lymphoid cell type 2; pDC, plasmacytoid dendritic cell; NKT, NK T cell; B GC, germinal center B cells; NK, natural killer cells; mregDC, mature dendritic cells enriched in immunoregulatory molecules. h, The proportions of developing B cells, plasmablast/plasma cells, GC B cells, TFH cells, TFR cells and B–T multiplets from the hub scRNA-seq data of naive and day-8 VSV-infected mice. i, Interaction dot plot of CellPhoneDB receptor–ligand analysis. The size and colour gradient of circles correspond to the mean interaction score between cell types (scaled from 0 to 1). The red outlines indicate significant interactions. j, Representative BCR clone network plots in the rostral-rhinal hub coloured by immunoglobulin isotype in naive, week 1 and week 3 of VSV infection. BCR networks were downsampled to the same sequencing depth (n = 2,500 UMI counts) before plotting. Each node represents a unique BCR, and each connected component represents a single clone. Edges between nodes are due to non-indel differences between pairs of BCRs. The sizes of nodes are scaled according to UMI count. The stacked bar chart (right) shows the isotype usage among clones in the rostral-rhinal hub in naive mice and at week 1 and week 3 of VSV infection. BCR networks were downsampled to the same sequencing depth, and clone isotype usage was tabulated per sample and represented as a percentage. n = 4–5 mice per group. k, The total number of CD19+ B cells and GL7+ FAS+ GC B cells in the rostral-rhinal hubs of naive versus day-10 VSV-infected mice. VSV-infected mice were treated at the time of infection with anti-LFA1/VLA4 or isotype control antibodies. The gating strategy is shown in Extended Data Fig. 10c. n = 5–7 mice per group. Statistical analysis was performed using one-way analysis of variance (ANOVA) with correction for multiple comparisons; **P = 0.0022, ***P = 0.0002. One out of two independent experiments. Data are mean ± s.e.m. l, Isotype usage among clones in the rostral-rhinal hub in the naive, day-6 VSV-infected, day-21 VSV-infected + isotype control antibody and day-21 VSV-infected + anti-LFA1/VLA4 groups. Both groups of day-21 VSV-infected mice were treated with antibodies beginning at day 6 after infection. BCR networks were downsampled to the same sequencing depth, and clone isotype usage was tabulated per sample and represented as a percentage. n = 4–5 mice per group. m, Representative confocal images of rostral-rhinal hubs from day-21 VSV-infected mice treated with isotype or anti-LFA1/VLA4 antibodies starting at day 6. Hubs were immunolabelled for vimentin (white) and CD138 (green). Scale bar, 50 μm. n = 8 per group. d.p.i., days post-infeciton.

References

    1. Kipnis J Multifaceted interactions between adaptive immunity and the central nervous system. Science 353, 766–771 (2016). - PMC - PubMed
    1. Rua R & McGavern DB Advances in meningeal immunity. Trends Mol. Med 24, 542–559 (2018). - PMC - PubMed
    1. Korin B et al. High-dimensional, single-cell characterization of the brain’s immune compartment. Nat. Neurosci 20, 1300–1309 (2017). - PubMed
    1. Brioschi S et al. Heterogeneity of meningeal B cells reveals a lymphopoietic niche at the CNS borders. Science 373, eabf9277 (2021). - PMC - PubMed
    1. Schafflick D et al. Single-cell profiling of CNS border compartment leukocytes reveals that B cells and their progenitors reside in non-diseased meninges. Nat. Neurosci 24, 1225–1234 (2021). - PubMed

MeSH terms