. 2024 Apr;628(8007):433-441.
doi: 10.1038/s41586-024-07217-2. Epub 2024 Mar 20.

Transcription-replication conflicts underlie sensitivity to PARP inhibitors

Affiliations

Transcription-replication conflicts underlie sensitivity to PARP inhibitors

Michalis Petropoulos et al. Nature. 2024 Apr.

Abstract

An important advance in cancer therapy has been the development of poly(ADP-ribose) polymerase (PARP) inhibitors for the treatment of homologous recombination (HR)-deficient cancers1-6. PARP inhibitors trap PARPs on DNA. The trapped PARPs are thought to block replisome progression, leading to formation of DNA double-strand breaks that require HR for repair7. Here we show that PARP1 functions together with TIMELESS and TIPIN to protect the replisome in early S phase from transcription-replication conflicts. Furthermore, the synthetic lethality of PARP inhibitors with HR deficiency is due to an inability to repair DNA damage caused by transcription-replication conflicts, rather than by trapped PARPs. Along these lines, inhibiting transcription elongation in early S phase rendered HR-deficient cells resistant to PARP inhibitors and depleting PARP1 by small-interfering RNA was synthetic lethal with HR deficiency. Thus, inhibiting PARP1 enzymatic activity may suffice for treatment efficacy in HR-deficient settings.


Conflict of interest statement

T.D.H. and S.K.S. are founders and stockholders of FoRx Therapeutics. S.K.S., G.G.R., A.F. and L.G.I. are employees of FoRx Therapeutics. The other authors declare no competing interests.

Figures

Fig. 1
Fig. 1. TIMELESS and TIPIN suppress the occurrence of TRCs.
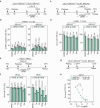
ac, DNA damage response in HeLa cells depleted for TIMELESS (TIM) or TIPIN (TIP). a, Outline of the experiment. b, Representative immunofluorescence (IF) images; the nuclei were counterstained with DAPI. c, Means ± 1 s.d. of percentage of cells with more than 20 γH2AX, more than 20 53BP1 or more than 10 RAD51 foci; n = 3 replicates; more than 259 cells per group (range 259–414); analysis of variance (ANOVA). A residual DNA damage response in cells treated with DRB could reflect TRC-independent mechanisms or transcription elongation complexes that had already escaped the promoter when DRB was added. df, Detection of TRCs by PLA. d, Outline of the experiment with camptothecin (CPT) as positive control. e, Immunofluorescence images of PCNA-RNAPII PLA foci; the nuclei were counterstained with DAPI. f, Number of PLA foci per cell; plots show medians and value ranges of 25–75 and 10–90%; filled circles indicate the cells in the top and bottom deciles; n = 2 replicates; more than 51 cells per group (range 51–106); ANOVA. g,h, Increased fork progression following depletion of TIMELESS or TIPIN. g, Outline of the experiment. h, Average EdUseq signal over large (more than 300 kb) transcribed genes 90 and 120 min after release into S phase. The genes were aligned by their transcription start site with their 5′–3′ orientation from left to right. Lower panels show the gene annotation and EUseq signal for each genomic locus used to generate the EdUseq plot. Scale bars in microscopy images, 5 μm. Span of genomic regions, 1 Mb. CTRL, control; EU, 5-ethynyl uridine; NS, not significant; σ, sigma value; Thy, thymidine; transf., transfection.
Fig. 2
Fig. 2. PARP inhibitors induce TRCs.
ae, DNA damage response and TRCs in HeLa cells treated with PARP inhibitors (PARPi). a, Outline of the experiment. b, Means ± 1 s.d. of percentage of cells with more than 20 γH2AX foci; n = 3 replicates; more than 232 cells per group (range 232–461); analysis of variance (ANOVA). c, Representative immunofluorescence (IF) images; the nuclei were counterstained with DAPI. d, Number of RAD51 and 53BP1 foci per cell; plots show medians and value ranges of 25–75 and 10–90%; filled circles indicate the cells in the top decile; n = 3 replicates; more than 142 cells per group (range 142542); ANOVA. e, Number of PLA foci per cell plotted as in d; n = 2 replicates; more than 51 cells per group (range 51–99); ANOVA. Scale bar in microscopy images, 5 μm. NS, not significant; Olap, olaparib; Sar, saruparib; Tal, talazoparib; Thy, thymidine; Vel, veliparib.
Fig. 3
Fig. 3. Inhibiting PARP enzymatic activity induces TRCs.
a,b, PARP enzymatic activity in cells treated with PARP inhibitors (PARPi). a, Outline of the experiment. b, Dose–response curves and calculated IC50 values for inhibition of PARP enzymatic activity. One of n = 2 replicates is shown; 100 cells per data point. c,d, PARP1 trapping in cells treated with PARP inhibitors. c, Outline of the experiment. d, Dose–response curves and calculated EC50 values for PARP1 trapping; means ± 1 s.d. shown; n = 2 replicates; for HeLa, more than 1,905 (range 1,905–9,368) cells per data point; for DLD1, more than 1,789 (range 1,789–10,815) cells per data point. e,f, DNA damage response in cells treated with PARP inhibitors. e, Outline of the experiment. f, Dose–response curves and calculated EC50 values for induction of γH2AX; means ± 1 s.d. shown; n = 2 replicates; for HeLa, more than 7,597 (range 7,597–10,114) cells per data point; for DLD1, more than 5,512 (range 5,512–9,353) cells per data point. g,h, DNA damage response in cells transfected with siRNA targeting PARP1 and/or PARP2. g, Outline of the experiment and immunoblotting to monitor PARP1 and PARP2 depletion; PCNA is loading control. h, Means ± 1 s.d. of percentage of cells with more than 20 γΗ2ΑΧ or more than 20 53BP1 foci; n = 3 replicates; more than 148 cells per group (range 148–243); analysis of variance (ANOVA). CTRL, control; IF, immunofluorescence; NS, not significant; Olap, olaparib; r.u., relative units; Sar, saruparib; Tal, talazoparib; Thy, thymidine; transf., transfection; Vel, veliparib.
Fig. 4
Fig. 4. The TIMELESS–PARP1 interaction is required to avert TRCs.
a,b, PAR chain formation following depletion of TIMELESS (TIM) by siRNA. a, Outline of the experiment. b, Means ± 1 s.d. of percentage of PAR positive cells; n = 3 replicates; more than 512 cells per group (range 512–921); analysis of variance (ANOVA). cf, The TIMELESS–PARP1 interface is important for averting TRCs. c, Outline of the experiment. Transfected plasmids drove expression of exogenous wild-type (TIMWT) or mutant (TIMR1081G) TIMELESS, while endogenous TIMELESS was depleted by siRNA (TIMb). d, Immunoblot monitoring TIMELESS levels. Ectopic TIMELESS has a higher molecular weight than endogenous TIMELESS. The TIMb siRNA targets only the endogenous TIMELESS gene. PCNA served as loading control. e, Means ± 1 s.d. of percentage of cells with more than 20 γΗ2ΑΧ or more than 20 53BP1 foci; n = 3 replicates; more than 97 cells per group (range 97–445); ANOVA. f, Number of PLA foci per cell; plots show medians and value ranges of 25–75 and 10–90%; filled circles indicate the cells in the top and bottom deciles; n = 2 replicates; more than 89 cells per group (range 89–138); ANOVA. g,h, Increased fork progression following depletion of PARP1, but not PARP2. g, Outline of the experiment. h, Average EdUseq signal over large (more than 300 kb) transcribed genes 120 min after release into S phase. Data from three independent replicates have been merged; the individual replicates are shown in Extended Data Fig. 6. The genes were aligned by their transcription start site with their 5′–3′ orientation from left to right. The lower panel shows gene annotation for each genomic locus used to generate the EdUseq plot. Span of genomic regions, 1 Mb. Async, asynchronous; CTRL, control; IF, immunofluorescence; NS, not significant; PARGi, poly(ADP-ribose) glycohydrolase inhibitor; σ, sigma value; Sync, synchronized; Thy, thymidine; transf., transfection.
Fig. 5
Fig. 5. Inhibition of transcription elongation confers resistance to PARP inhibitors.
af, DNA damage by PARP inhibitors (PARPi) is suppressed by inhibiting transcription elongation. a, Outline of the experiment. PARP inhibitors and, optionally, DRB were administered during early or late S phase (0–3.5 or 7–10.5 h after release from a thymidine (Thy) block, respectively). b,c, Representative images of cells treated with olaparib (Olap, 10 μΜ) during early S phase showing micronuclei (b) and γΗ2ΑΧ foci (c) 24 h after release from the thymidine block. df, Means ± 1 s.d. of percentage of cells with micronuclei (d,f) or more than 20 γΗ2ΑΧ foci (e) after treatment with PARP inhibitors in early (d,e) or late (f) S phase; n = 3 replicates; more than 250 cells per group (range 250–400); analysis of variance (ANOVA). g,h, Synthetic lethality induced by PARP inhibitors is alleviated by inhibiting transcription elongation. g, Outline of the experiment. h, Means ± 1 s.d. of percentage of surviving cells, as assessed by colony formation assay (CFA); DMSO-treated cells serve as reference; n = 3 replicates; ANOVA. i,j, Synthetic lethality induced by PARP1 depletion is alleviated by inhibiting transcription elongation. i, Outline of the experiment. j, Means ± 1 s.d. of percentage of surviving cells, as assessed by CFA; non-transfected cells serve as reference; n = 3 replicates; ANOVA. km, Depletion of TIMELESS (TIM) or TIPIN (TIP) are synthetic lethal with HR deficiency. k, Outline of the experiments. l, Means ± 1 s.d. of percentage of cells with pan-nuclear γΗ2ΑΧ staining; n = 3 replicates; ANOVA. m, Means ± 1 s.d. of percentage of surviving cells, as assessed by CFA; control-transfected cells serve as reference; n = 3 replicates; ANOVA. Scale bars for microscopy images, 10 μm. CTRL, control; EF, epifluorescence; FACS, fluorescence-activated cell sorting; IF, immunofluorescence; NS, not significant; Sar, saruparib (1 μΜ); Tal, talazoparib (100 nM); transf., transfection; Vel, veliparib (10 μΜ).
Fig. 6
Fig. 6. PARP trapping reduces the selectivity of PARP inhibitors for HR deficiency.
a,b, Sensitivity of DLD1 BRCA2+/+ and DLD1 BRCA2−/− cells to PARP inhibitors (PARPi). a, Outline of the experiment. Survival was assessed using the CellTiter-Glo (CTG) assay. b, Dose–response survival curves and calculated EC50 values for the various PARP inhibitors. Data from one of n = 2 replicates. c,d, TMZ enhances trapping of PARP1 and PARP2. c, Outline of the experiment. d, Dose–response curves and calculated EC50 values for trapping of PARP1 and PARP2; data from one of n = 2 replicates; for PARP1 > 120 (range 120–4,848) cells per data point; for PARP2 > 2,293 (range 2,293–5,377) cells per data point. e,f, TMZ reduces the selectivity of talazoparib (Tal) for HR deficiency. e, Outline of the experiment. f, Dose–response survival curves and calculated EC50 values for talazoparib-mediated lethality of DLD1 BRCA2+/+ and DLD1 BRCA2−/− cells with and without added TMZ. Horizontal arrows indicate the fold-change in EC50 values as a result of administering 50 μM TMZ. Data from one of n = 2 replicate experiments. g,h, Depletion of PARP1 renders HR-proficient cells resistant to talazoparib. g, Outline of the experiment. h, Dose–response survival curves and calculated EC50 values for induction of lethality of DLD1 BRCA2+/+ and DLD1 BRCA2−/− cells by talazoparib following depletion of PARP1 in the absence and presence of TMZ. Horizontal arrows indicate the fold-change in EC50 values as a result of depleting PARP1; n = 2 replicates. CTRL, control; IF, immunofluorescence; ND, EC50 values not determined; Olap, olaparib; r.u., relative units; Sar, saruparib; transf., transfection; Vel, veliparib.
Extended Data Fig. 1
Extended Data Fig. 1. Depletion of TIMELESS or TIPIN by siRNAs induces a TRC-dependent DNA damage response in normal and cancer cells.
a, Efficiency of siRNA-mediated depletion of TIMELESS and TIPIN in HeLa cells by immunoblotting. PCNA and α-tubulin served as loading controls. b-c, Inhibition of transcription elongation by DRB. b, Outline of the experiment. c, Representative images of HeLa cells indicating inhibition of EU incorporation by DRB; the nuclei were counterstained with Hoechst 33342. Scale bar: 10 μm. d, Induction of a DNA damage response in U2OS and hTERT-RPE1 cells transfected with control siRNA or siRNAs targeting TIMELESS or TIPIN. γH2AX levels were determined by flow cytometry; bars indicate means ± 1 s.d.; n = 3 replicates; ANOVA. e-h, Transcription inhibitors cordycepin (CORD) and triptolide (TLP) suppress the DNA damage response induced by depletion of TIMELESS or TIPIN. e, Outline of the experiment. f, Flow cytometry profiles for EdU incorporation and DNA content. g, Quantification of EU incorporation; plots show medians and value ranges of 25-75% and 10-90%, filled circles indicate the individual cells in the top and bottom deciles; n = 2 replicates; >2624 cells per group (range: 2624-2899); ANOVA. h, Quantification of γH2AX mean intensity and number of 53BP1 foci per cell; plots show medians and value ranges of 25–75% and 10–90%, filled circles indicate the individual cells in the top and bottom deciles; n = 2 replicates; >66 cells per group (range: 66–194); ANOVA. i-k, Ongoing DNA replication is required for induction of a DNA damage response by depletion of TIMELESS or TIPIN. i, Outline of the experiment. j, γH2AX levels and DNA content ascertained by flow cytometry. k, Quantification of γH2AX positive cells determined separately for the EdU-positive and EdU-negative cells; bars indicate means ± 1 s.d.; n = 3 replicates; ANOVA. CTRL, control; TIM, TIMELESS; TIP, TIPIN; transf., transfection; Thy, thymidine; IF, immunofluorescence; PI, propidium iodide; r.u., relative units; NS, not significant.
Extended Data Fig. 2
Extended Data Fig. 2. Induction of R-loops, MiDAS and increased replication fork speed following depletion of TIMELESS or TIPIN.
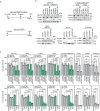
a-c, Induction of R-loops in cells after depletion of TIMELESS or TIPIN. a, Outline of the experiment. The U2OS cells used in this experiment expressed GFP-RNaseH1D210N in a doxycycline (DOX)-dependent manner. b, Induction of expression of GFP-RNaseH1D210N by DOX, as monitored by immunoblotting; PCNA served as loading control. c, Quantification of the number of GFP-RNaseH1D210N foci following depletion of TIMELESS or TIPIN; plots show medians and value ranges of 25–75% and 10–90%, filled circles indicate the individual cells in the top decile; n = 2 replicates; >212 cells per group (range: 212–221); ANOVA. d-f, The DNA damage response induced by depletion of TIMELESS or TIPIN is suppressed by expression of RNase H1. d, Outline of the experiment. The HeLa cells used in this experiment expressed FLAG-RNaseH1 in a DOX-dependent manner. e, Induction of expression of FLAG-RNaseH1 by DOX, as monitored by immunoblotting. f, Quantification of the number of 53BP1 foci per cell and of γH2AX mean intensity; plots show medians and value ranges of 25–75% and 10–90%, filled circles indicate the individual cells in the top and bottom deciles; n = 2 replicates; >199 cells per group (range: 199–557); ANOVA. g-i, Induction of MiDAS in prometaphase cells following depletion of TIMELESS or TIPIN. g, Outline of the experiment; the Cdk1 inhibitor RO−3306 inhibited entry into mitosis; nocodazole (Noco) prevented exit from mitosis. h, Representative images of prometaphase cells with MiDAS; the DNA was counterstained with DAPI. Scale bar: 5 μm. i, Quantification of the percentage of prometaphase cells with >3 EdU foci; bars indicate means ± 1 s.d.; n = 3 replicates; >294 prometaphase cells per group (range: 294–315); ANOVA. j-k, Increased rates of fork progression over transcribed genes following depletion of TIMELESS or TIPIN in HeLa cells. The outline of the experiment is shown in Fig. 1g. The experiment shown here is a replicate of the experiment shown in Fig. 1h. j, EdUseq profiles at five representative genomic regions. Replication timing (RT): blue, early S phase; green, mid S phase. Genes (Ge): green, forward-transcribed genes; red, reverse-transcribed genes; yellow, overlap of forward and reverse-transcribed genes. Intergenic regions (iG): gray. Bin resolution: 10 kb; ruler scale: 100 kb. k, Average nascent DNA replication signal (EdUseq) at large (>300 kb) transcribed genes 120 min after release in S phase. The genes are aligned by their transcription start site and all genes are shown with their 5’-3’ orientation from left to right. Lower panels: heatmaps showing gene annotation and EUseq signal for each genomic locus used to generate the average EdUseq signal. Span of genomic regions: 1 Mb. transf., transfection; Thy, thymidine; IF, immunofluorescence; RNH1, RNase H1; r.u., relative units; CTRL, control; TIM, TIMELESS; TIP, TIPIN; σ, sigma value; NS, not significant.
Extended Data Fig. 3
Extended Data Fig. 3. PARP inhibitors induce TRC-dependent DNA damage in early S phase and activate MiDAS.
a-b, Transcription inhibitors cordycepin (CORD) and triptolide (TLP) suppress the DNA damage response induced by PARP inhibitors. a, Outline of the experiment. b, Quantification of γH2AX mean intensity; plots show medians and value ranges of 25–75% and 10–90%, filled circles indicate the individual cells in the top and bottom deciles; n = 2 replicates; >1668 cells per group (range: 1668–2282); ANOVA. c-d, The induction of a DNA damage response by PARP inhibitors depends on whether cells are exposed to these inhibitors in early, mid or late S phase. c, Outline of the experiment. Cells were exposed to PARP inhibitors 0−3.5, 3.5–7 or 7–10.5 h after release from a thymidine block, corresponding to early, mid or late S phase, respectively. d, Quantification of the percentage of γH2AX positive cells by flow cytometry; bars indicate means ± 1 s.d.; n = 3 replicates; ANOVA. e, Distribution of human genes according to replication timing (early, mid or late S phase) and level of nascent transcription (High Tx, upper tertile of all expressed genes; Mid Tx, middle tertile; Low Tx, lower tertile; No Tx, non-expressed genes). Nascent transcription was determined by EUseq analysis of HeLa cells. f-h, Induction of MiDAS in prometaphase cells following treatment of cells with PARP inhibitors in early or late S phase (0–3.5 or 7–10.5 h after release from a thymidine block). f, Outline of the experiment; the Cdk1 inhibitor RO-3306 inhibited entry into mitosis; nocodazole (Noco) prevented exit from mitosis. g, Representative images of prometaphase cells with MiDAS; the DNA was counterstained with DAPI. Scale bar: 5 μm. h, Quantification of the percentage of prometaphase cells with >3 EdU foci; bars indicate means ± 1 s.d.; n = 3 replicates; >127 prometaphase cells per group (range: 127–400); ANOVA. i-j, Induction of R-loops in cells treated with PARP inhibitors. i, Outline of the experiment. The U2OS cells used in this experiment express GFP-RNaseH1D210N in a doxycycline (DOX)-dependent manner. j, Quantification of the number of GFP-RNaseH1D210N foci following treatment with PARP inhibitors; plots show medians and value ranges of 25–75% and 10–90%, filled circles indicate the individual cells in the top and bottom deciles; n = 2 replicates; >192 cells per group; ANOVA. k-l, The DNA damage response induced by PARP inhibitors is suppressed by expression of RNase H1. k, Outline of the experiment. The HeLa cells used in this experiment express FLAG-RNaseH1 in a DOX-dependent manner. l, Quantification of the number of 53BP1 foci per cell and of γH2AX mean intensity; plots show medians and value ranges of 25–75% and 10–90%, filled circles indicate the individual cells in the top and bottom deciles; n = 2 replicates; >141 cells per group (range: 141–206); ANOVA. Thy, thymidine; PARPi, PARP inhibitor; r.u., relative units; Olap, olaparib (10 μΜ); Tal, talazoparib (100 nM); NS, not significant.
Extended Data Fig. 4
Extended Data Fig. 4. Characterization of PARP inhibition and PARP trapping activities of the four PARP inhibitors used in this study.
a, Dose-response curves and calculated IC50 values for inhibition of PARP1 and PARP2 enzymatic activities in vitro by the indicated PARP inhibitors. One of n = 2 replicates is presented. The IC50 values determined by this assay might be inaccurate, due to the assay not being sensitive enough for the most potent inhibitors; these inhibitors might appear less potent than they actually are. b, Examples of images of HeLa cells treated with PARP inhibitors and H2O2 that were used to assess inhibition of PARP enzymatic activity in cells. The cells were treated as shown in Fig. 3a and were immunostained for poly(ADP-ribose) (PAR) chains; the nuclei were counterstained with DAPI. Scale bar: 10 μm. c, Representative images of HeLa cells treated with different PARP inhibitors, pre-extracted and immunostained for PARP1 or PARP2; the nuclei were counterstained with DAPI. Scale bar: 10 μm. d, Dose-response curves and calculated EC50 values for PARP2 trapping in HeLa and DLD1 BRCA2+/+ cells; means ± 1 s.d.; n = 2 replicates; for HeLa >2204 (range: 2204–10543), for DLD1 > 1605 (range: 1605–11936) cells per data point. e, Representative images of HeLa cells treated with talazoparib and optionally with DRB and immunostained for γH2AX; the nuclei were counterstained with DAPI. Scale bar: 10 μm. r.u., relative units; Tal, talazoparib; Sar, saruparib; Olap, olaparib; Vel, veliparib.
Extended Data Fig. 5
Extended Data Fig. 5. PARP inhibitors function in the same pathway as TIMELESS and TIPIN to prevent a TRC-induced DNA damage response.
a, Outline of the experiment. b, Quantification of the percentage of cells with γH2AX and 53BP1 foci following depletion of TIMELESS or TIPIN or treatment with PARP inhibitors and/or combinations thereof; γΗ2ΑΧ and 53BP1-positive cells: >20 foci; bars indicate means ± 1 s.d.; n = 3 replicates; >207 cells per group (range: 207–403). Olap, olaparib (10 μM); Tal, talazoparib (100 nM). CTRL, control; TIM, TIMELESS; TIP, TIPIN. c-d, Substitutions targeting the TIMELESS-PARP1 interface compromise the function of these proteins in averting TRC-dependent DNA damage responses. c, Levels of endogenous and ectopically-expressed PARP1 proteins in cells transfected with siRNAs (CTRL or PARP1b) and plasmids (PARP1WT or PARP1D993G). A representative immunoblot is shown; PCNA served as loading control. siPARP1b, siRNA targeting the endogenous PARP1 gene, but not the PARP1 genes expressed by the plasmids; PARP1WT, wild-type PARP1; PARP1D993G, D993G single amino acid substitution mutant. d, Quantification of the percentage of cells with 53BP1 or γΗ2ΑΧ foci; bars indicate means ± 1 s.d.; n = 3 replicates; for 53BP1 foci >246 (range: 246–657), for γΗ2ΑΧ foci >251 (range: 251–624) cells per group; ANOVA.
Extended Data Fig. 6
Extended Data Fig. 6. Increased replication fork progression rates within large, transcribed genes in HeLa cells depleted of PARP1.
The outline of the experiment, performed in triplicate, is shown in Fig. 4g. Here, the average nascent DNA replication signals over large (>300 kb) transcribed genes 120 min after release in S phase are shown separately for each replicate. The merged averages of all three replicates are shown in Fig. 4h. The genes are aligned by their transcription start site and all genes are shown with their 5’−3’ orientation from left to right. Lower panels: heatmaps showing gene annotation for each genomic locus used to generate the average EdUseq profiles. Span of genomic regions: 1 Mb; σ, sigma value; CTRL, control.
Extended Data Fig. 7
Extended Data Fig. 7. The sensitivity of HR-deficient cells to PARP inhibitors is affected by whether the cells are exposed to PARP inhibitors in early or late S phase.
a-b, Exposure of HR-deficient cells to PARP inhibitors in late S phase does not lead to induction of a DNA damage response. a, Outline of the experiment. b, Quantification of the percentage of cells with more than 20 γΗ2ΑΧ foci per cell. The bars indicate means ± 1 s.d.; n = 3 replicates; >283 cells per group (range: 283–521); ANOVA. c-d, Exposure of cells to PARP inhibitors in late S phase does not lead to synthetic lethality with HR deficiency. c, Outline of the experiment. d, Quantification of cell survival by a colony formation assay (CFA) with the DMSO-treated cells serving as reference. The bars indicate means ± 1 s.d.; n = 3 replicates; ANOVA. e-f, The synthetic lethality of HR-deficient PEO1 cells treated with PARP inhibitors in early S phase is alleviated by inhibiting transcription elongation. e, Outline of the experiment. PEO4 cells are HR-proficient revertant cells derived from the same cancer as PEO1 cells. f, Quantification of cell survival by CFA; bars indicate means ± 1 s.d.; n = 3 replicates; ANOVA. g-h, HR-deficient cells have increased sensitivity to camptothecin (CPT). g, Outline of the experiment. h, Dose-response survival curves and calculated EC50 values for DLD1 BRCA2+/+ and DLD1 BRCA2−/−cells following treatment with CPT. Olap, olaparib (10 μΜ); Tal, talazoparib (100 nM); Vel, veliparib (10 μM); Sar, saruparib (1 μΜ); CTG, CellTiter-Glo Cell Viability Assay; NS, not significant.
Extended Data Fig. 8
Extended Data Fig. 8. Depletion of PARP1 by siRNA is synthetic lethal with HR-deficiency.
a, Outline of the experiment. The cell lines were transfected with siRNA or exposed to PARP inhibitors. Viability was assessed by a colony formation assay (CFA). Note that in the siRNA-transfected cells, PARP1 and/or PARP2 were depleted for only a few days, whereas the PARP inhibitors were present over the entire 14 day-period. b, Assessment of the efficacy of depletion of BRCA2, PARP1 and PARP2 by immunoblotting. PCNA and GAPDH served as loading controls. The H1299-shBRCA2DOX cells induce expression of shRNA targeting BRCA2 in a doxycycline (DOX)-dependent manner. c, Quantification of cell survival; bars indicate means ± 1 s.d.; n = 3 replicates; ANOVA. PARPi, PARP inhibitor; transf., transfection; CTRL, control; Olap, olaparib (1 μΜ, except for DLD1 and OVSAHO cells: 5 μΜ); Sar, saruparib (100 nΜ); NS, not significant.
Extended Data Fig. 9
Extended Data Fig. 9. PARP trapping is dispensable for the synthetic lethality of PARP inhibitors with HR deficiency, yet toxic for HR-proficient cells.
a-b, Temozolomide (TMZ) reduces the selectivity of olaparib and saruparib for HR-deficient cells. a, Outline of the experiment. b, Dose-response survival curves and calculated EC50 values of olaparib and saruparib-mediated lethality of DLD1 BRCA2+/+ and DLD1 BRCA2−/− cells with and without added TMZ. Horizontal arrows indicate the fold-change in EC50 values as a result of administering 50 μM TMZ. Data from one of n = 2 replicates. c-e, Depletion of PARP1 suppresses the induction of a DNA damage response in HR-proficient, but not in HR-deficient cells, treated with talazoparib. c, Outline of the experiment. γΗ2ΑΧ intensity was monitored 48 h after talazoparib was administered. d, Dose-response curves and calculated EC50 values for induction of γΗ2ΑΧ. Data are from one of n = 2 replicates; for DLD1 BRCA2+/+ > 7732 (range: 7732-21772), for DLD1 BRCA2−/− > 3368 (range: 3368–5803) cells per datapoint. e, Quantification of γΗ2ΑΧ intensity in DLD1 BRCA2+/+ and DLD1 BRCA2 −/− cells transfected with control siRNA or siRNA targeting PARP1 and treated with talazoparib (1 μΜ) and optionally with TMZ (50 μΜ); plots show medians and value ranges of 25–75% and 10–90%, filled circles indicate the individual cells in the top and bottom deciles; n = 2 replicates; >17091 cells per group (range: 17091−31634); ANOVA. PARPi, PARP inhibitor; transf., transfection; CTRL, control; CTG, CellTiter-Glo Cell Viability Assay; NS, not significant.

References

    1. Fong PC, et al. Inhibition of poly(ADP-ribose) polymerase in tumors from BRCA mutation carriers. N. Engl. J. Med. 2009;361:123–134. doi: 10.1056/NEJMoa0900212. - DOI - PubMed
    1. Konstantinopoulos PA, Ceccaldi R, Shapiro GI, D’Andrea AD. Homologous recombination deficiency: exploiting the fundamental vulnerability of ovarian cancer. Cancer Discov. 2015;5:1137–1154. doi: 10.1158/2159-8290.CD-15-0714. - DOI - PMC - PubMed
    1. Pommier Y, O’Connor MJ, de Bono J. Laying a trap to kill cancer cells: PARP inhibitors and their mechanisms of action. Sci. Transl. Med. 2016;8:362ps17. doi: 10.1126/scitranslmed.aaf9246. - DOI - PubMed
    1. Lord CJ, Ashworth A. PARP inhibitors: synthetic lethality in the clinic. Science. 2017;355:1152–1158. doi: 10.1126/science.aam7344. - DOI - PMC - PubMed
    1. Bryant HE, et al. Specific killing of BRCA2-deficient tumours with inhibitors of poly(ADP-ribose) polymerase. Nature. 2005;434:913–917. doi: 10.1038/nature03443. - DOI - PubMed

MeSH terms