. 2024 Apr;56(4):675-685.
doi: 10.1038/s41588-024-01681-2. Epub 2024 Mar 20.

Increased enhancer-promoter interactions during developmental enhancer activation in mammals

Affiliations

Increased enhancer-promoter interactions during developmental enhancer activation in mammals

Zhuoxin Chen et al. Nat Genet. 2024 Apr.

Abstract

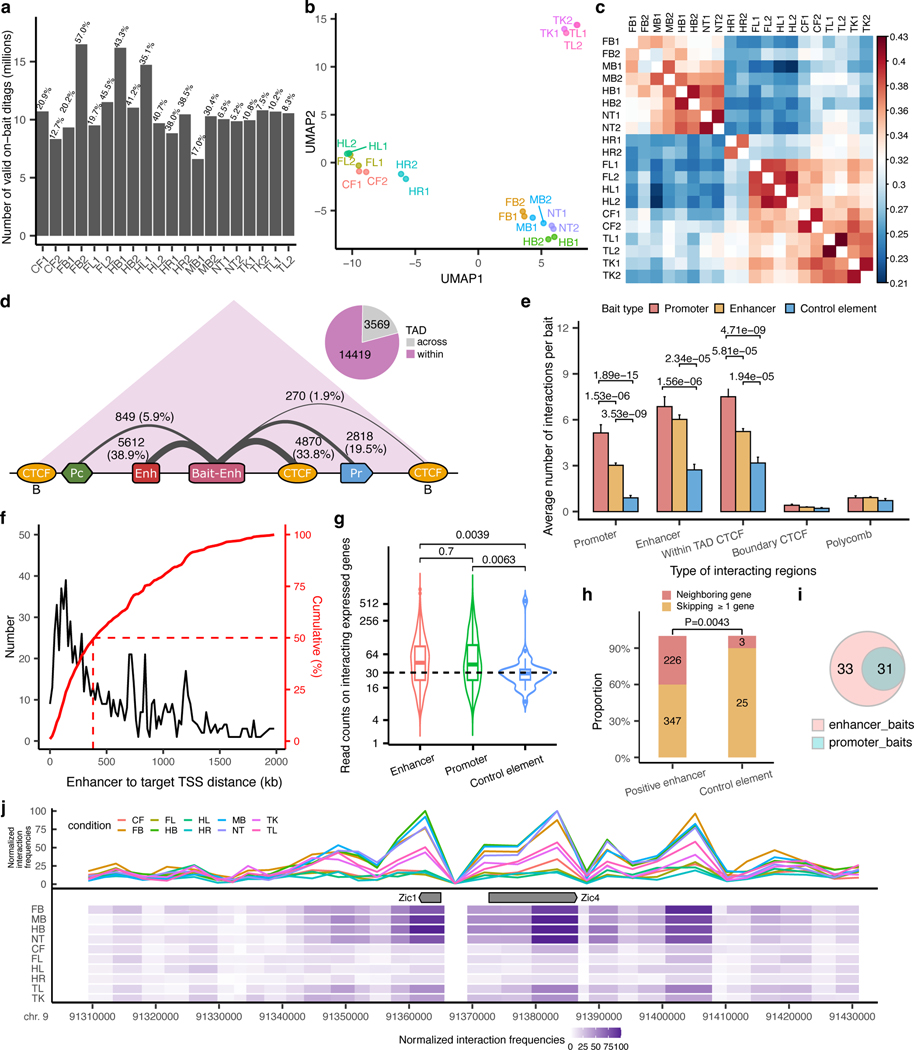
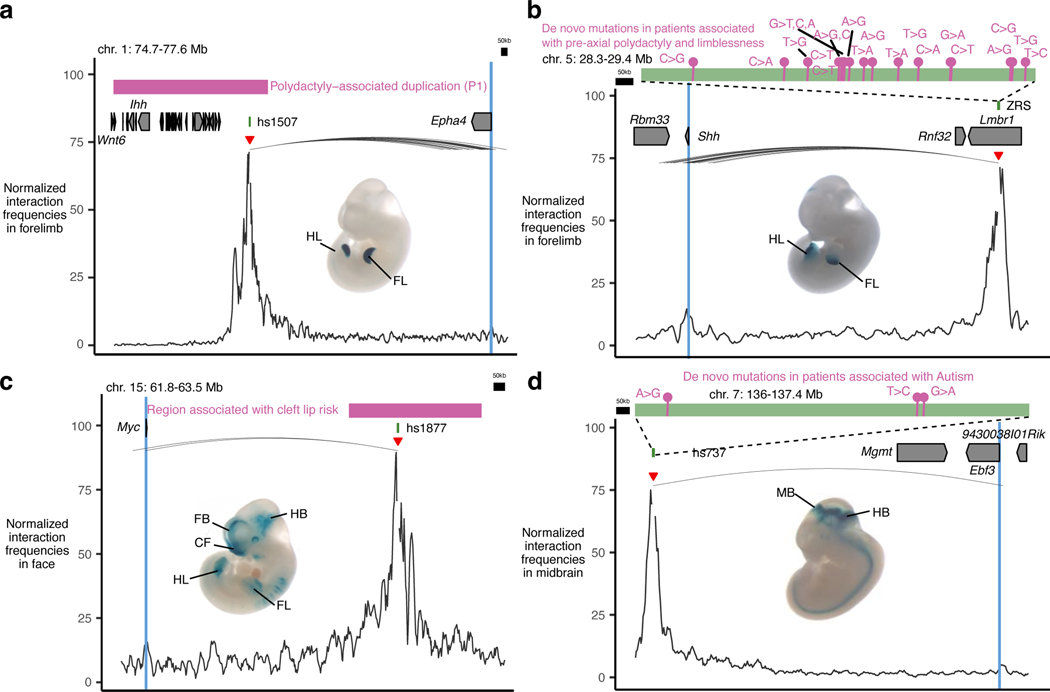
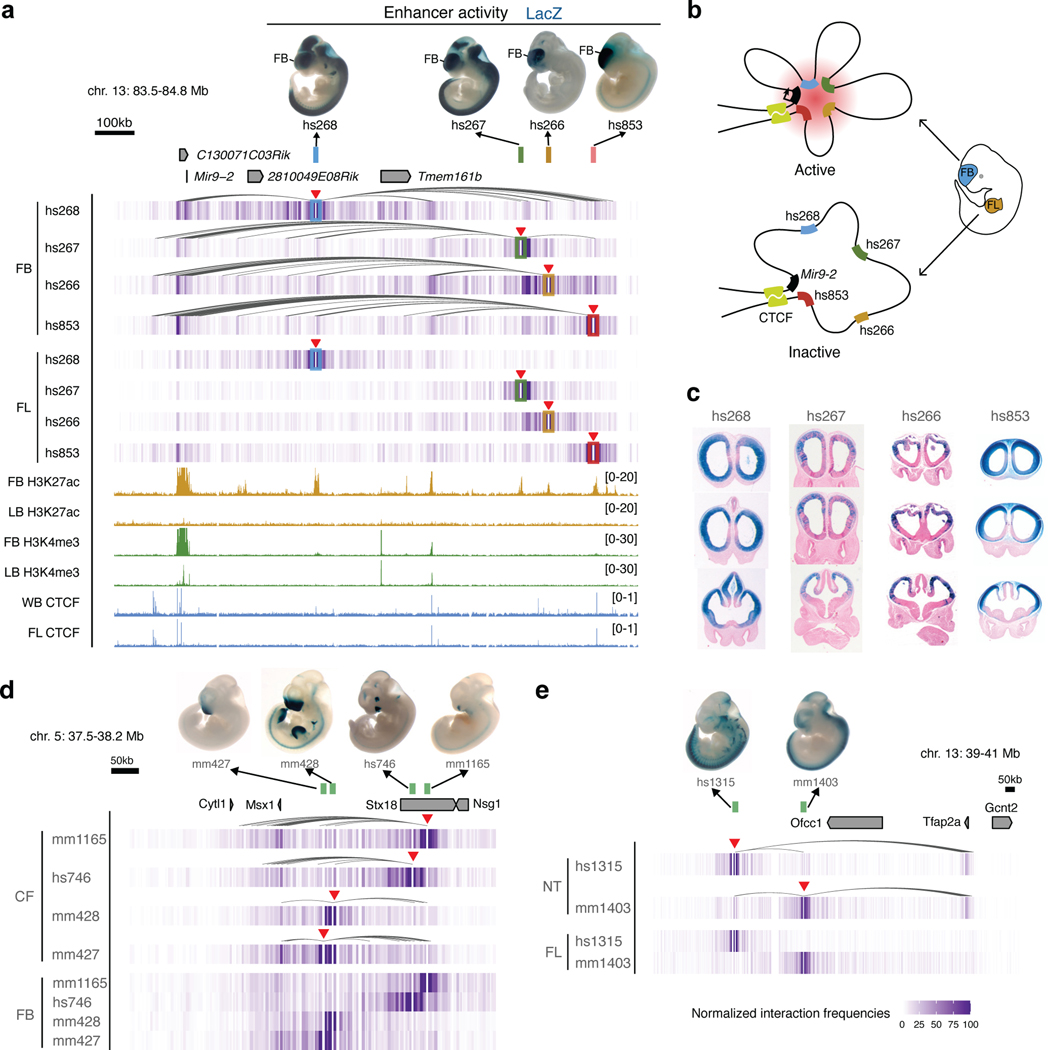
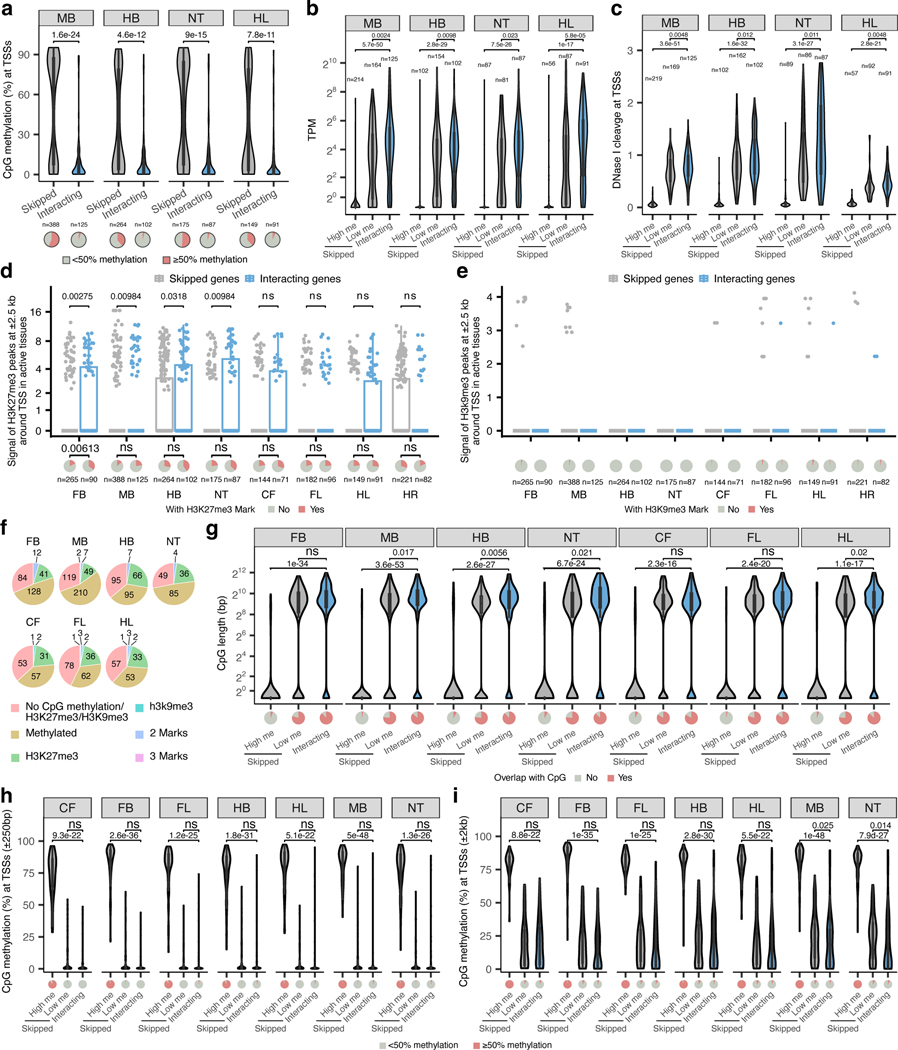
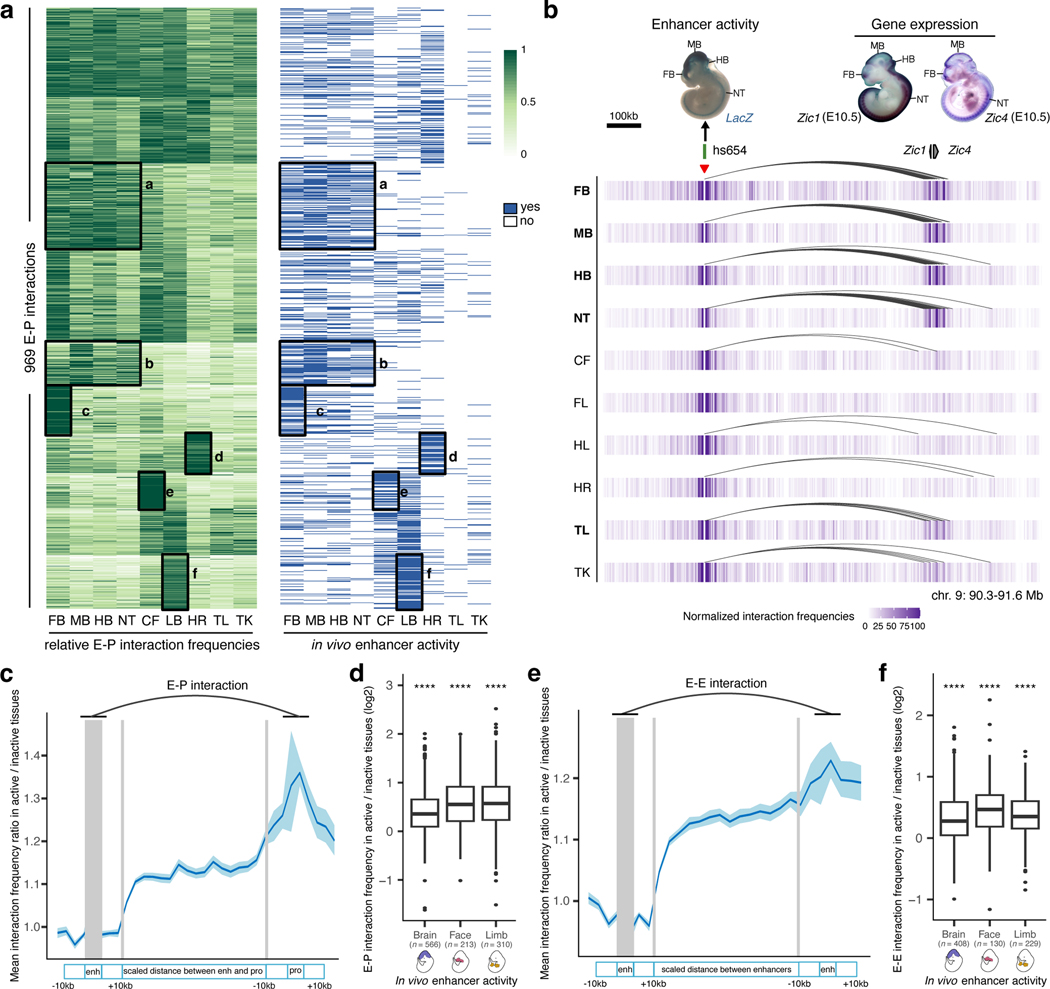
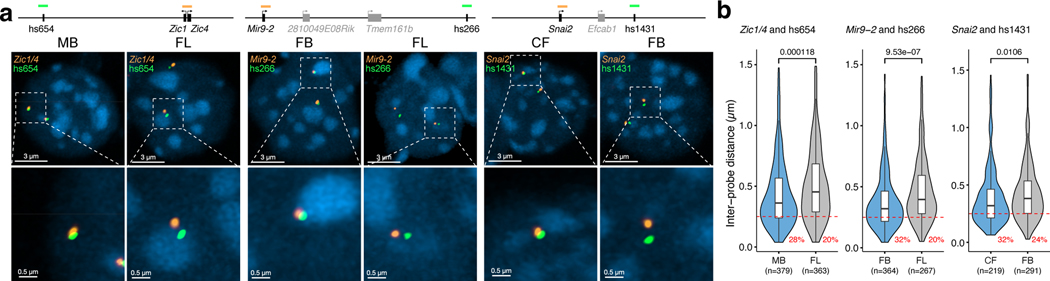
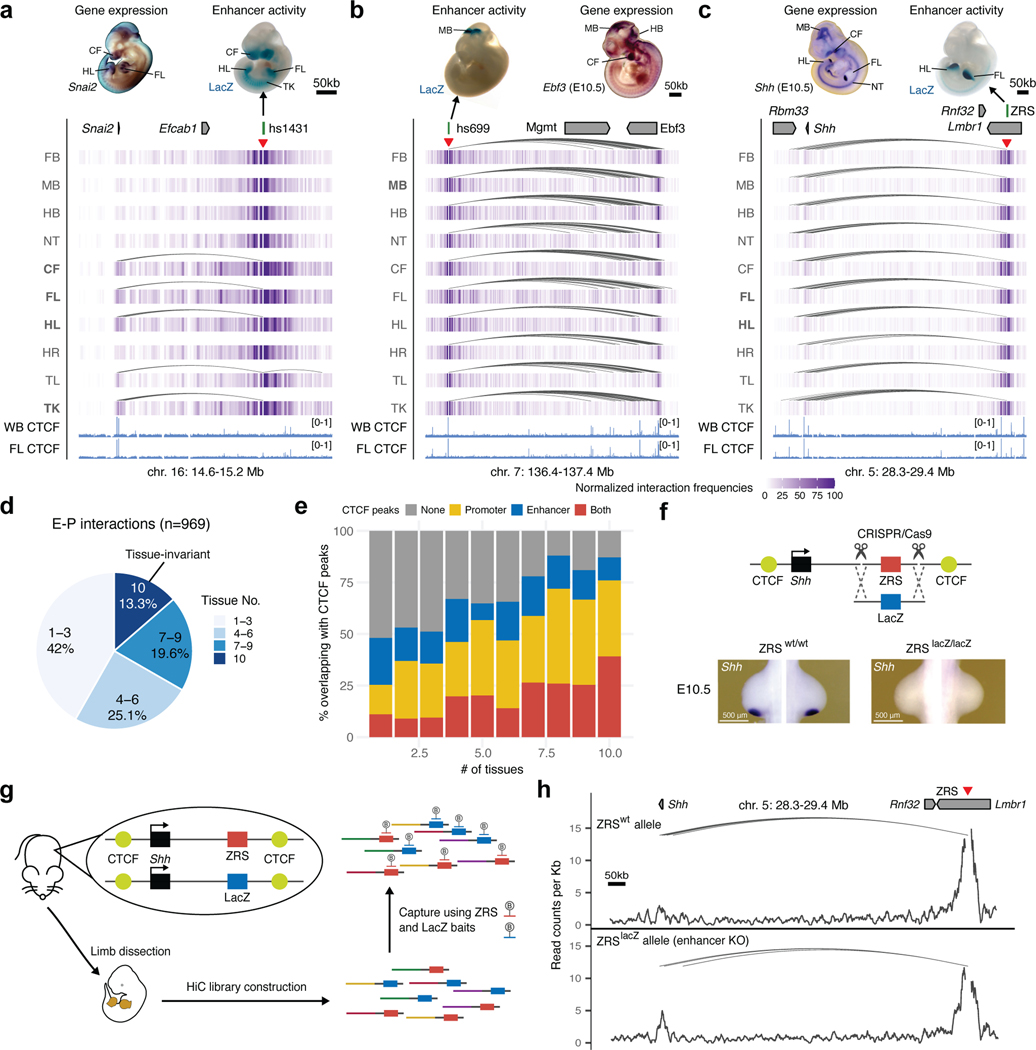
Remote enhancers are thought to interact with their target promoters via physical proximity, yet the importance of this proximity for enhancer function remains unclear. Here we investigate the three-dimensional (3D) conformation of enhancers during mammalian development by generating high-resolution tissue-resolved contact maps for nearly a thousand enhancers with characterized in vivo activities in ten murine embryonic tissues. Sixty-one percent of developmental enhancers bypass their neighboring genes, which are often marked by promoter CpG methylation. The majority of enhancers display tissue-specific 3D conformations, and both enhancer-promoter and enhancer-enhancer interactions are moderately but consistently increased upon enhancer activation in vivo. Less than 14% of enhancer-promoter interactions form stably across tissues; however, these invariant interactions form in the absence of the enhancer and are likely mediated by adjacent CTCF binding. Our results highlight the general importance of enhancer-promoter physical proximity for developmental gene activation in mammals.


Conflict of interest statement

Competing interests

The authors declare no competing interests.

Figures

Extended Data Fig. 1
Extended Data Fig. 1. Enhancer capture Hi-C identifies enhancer-centric chromatin interactions in mouse embryonic tissues.
a, Unique on-target read counts for each library. The percentages above indicate the capture rates for each library. b,c, Principal component analysis and hierarchical clustering of all replicates based on the presence of peaks called by CHiCAGO in each replicate (considering peaks with valid di-tags on neighboring fragments). d, Significant enhancer-centric chromatin interactions identified in this study. The number on each link represents the number of fragments falling into different annotation categories and the width of links is proportional to the percentage (in the parentheses) of different kinds of interactions. Only interactions within 2 Mb are included. CTCF sites with “B”: CTCF sites at TAD boundary; Pc: polycomb; Enh: enhancers; Bait-Enh: baited enhancers; Pr: promoters. e, An average number of interactions detected per bait for different kinds of baits (promoter (n=176), enhancer (n=935) and negative control elements (n=87)). Data are represented as mean ± s.e.m. f, Distribution of genomic distances between enhancers and the TSSs of interacting genes (black, frequencies; red, cumulative). g, Violin plots showing read counts on promoters of active genes that interact with enhancer baits (n=541), promoter baits (n=126) and control element baits (n=25). The central horizontal lines are the median, with the boxes extending from the 25th to the 75th percentiles. The whiskers further extend by ±1.5 times the interquartile range from the limits of each box. h, Histogram showing the proportion of bait regions that interact with proximal genes and distal genes. i, Venn diagram showing the overlap between significant interactions called from enhancer baits and corresponding promoter baits. All P values were calculated by a two-sided Wilcox test and adjusted for multiple testing. j, Zoom-in view on Zic1/Zic4 locus for hs654 interaction profiles across 10 tissues. The average size for each pooled fragment is ~3kb. FB, forebrain. MB, midbrain. HB, hindbrain. CF, craniofacial mesenchyme. HR, heart. FL, forelimb. HL, hindlimb. TK, trunk. TL, tail. NT, neural tube.
Extended Data Fig. 2
Extended Data Fig. 2. Examples of enhancer—promoter interactions linked to congenital disorders.
a, Hs1507 limb enhancer located in the non-coding region which is duplicated in patients with polydactyly (pink box indicates the homologous region in the mouse genome). Hs1507 forms significant chromatin interactions with the promoter of the Epha4 located ~1.5 Mb away. Shown is the Epha4 genomic region (chr1:74,788,119–77,634,678; mm10). b, Many de novo rare variants identified in patients with preaxial polydactyly are located in the ZRS limb enhancer which forms significant interactions with the promoter of Shh located ~850 kb away. Shown is the Shh genomic region (chr5:28,320,000–29,400,000; mm10). c, Hs1877 face enhancer located in the non-coding region containing 146 SNPs found in patients with cleft lip risk (pink box indicates the homologous region in the mouse genome). Hs1877 forms significant chromatin interactions with the promoter of the Myc located ~900 kb away in the face. The Myc genomic region (chr15:61,880,003–63,506,895; mm10). d, Three de novo rare variants identified in patients with autism are located in the hs737 midbrain/hindbrain enhancer,, which forms strong significant interactions with the promoter of Ebf3 located ~1,000 kb away in the midbrain. Shown is the Ebf3 genomic region (chr7:136,018,204–137,420,338; mm10).
Extended Data Fig. 3
Extended Data Fig. 3. Examples of enhancer—enhancer chromatin interactions.
a, The Mir9–2 genomic region (chr13:83,558,457–84,861,438; mm10) is shown with chromatin interaction heatmaps centered on hs268 (blue), hs267 (green), hs266 (yellow) and hs853 (red) enhancers in the forebrain (FB) and forelimb (FL). Shown on the top are hs268, hs267, hs266 and hs853 enhancer activities in a transgenic mid-gestation (E11.5) mouse embryo, which match with the expression profiles of Mir9 in the brain and neural tube at E11.5,. Red arrowheads indicate capture Hi-C viewpoints. Arches indicate significant interactions in the forebrain. Shown on the bottom are H3K27ac (yellow) and H3K4me3 (green) ChIP-seq tracks in forebrain and limb buds (LB) at E11.5, CTCF (light blue) ChIP-seq tracks in the whole brain (WB) and forelimb at E12.5,,,. b, Schematic depicting 3D chromatin interactions between enhancers and Mir9–2 gene in the forebrain and forelimb. c, Coronal sections of forebrain for hs268, hs267, hs266 and hs853 enhancer activity from VISTA enhancer database, which reproducibly label the same subregions in E11.5 forebrain as C130071C03Rik (Mir9–2 precursor) expression. d,e, Chromatin interaction heatmaps centered on mm1165, hs746, mm428 and mm427 enhancers in the face (CF) and forebrain (FB) for Msx1 genomic region (chr5: 37,554,764–38,206,723; mm10) (d) and hs1315 and mm1403 enhancers in the neural tube (NT) and forelimb (FL) for Tfap2a genomic region (chr13: 39,098,000–41,000,000; mm10) (e). Shown on the top are mm1165, hs746, mm428, mm427, hs1315 and mm1403 enhancer activities in a transgenic mid-gestation (E11.5) mouse embryos. Arches indicate significant interactions.
Extended Data Fig. 4
Extended Data Fig. 4. Properties of enhancer-interacting and skipped promoters.
a-c, The CpG methylation (a), mRNA expression levels (b) and DNase signal (c) of enhancer-interacting and skipped promoters in tissues where enhancers are active. High me, high methylation skipped promoters (>50% CpG methylation within ± 1 kb from TSS). Low me, low methylation skipped promoters (<50% CpG methylation within ± 1 kb from TSS). d,e, H3K27me3 (d), H3K9me3 (e) signal at ± 2.5 kb of enhancer-interacting and skipped promoters in tissues where enhancers are active. The pie charts below show the fraction of promoters marked with H3K27me3 or H3K9me3. f, Pie charts showing the fraction of skipped promoters marked by CpG methylation, H3K27me3, H3K9me3 or the combination of marks. g-i, Violin plot showing CpG length (g), or CpG methylation level at transcription start sites for enhancer-interacting and skipped genes with different window sizes ± 250bp (h) and ± 2kb (i)). The number of high and low methylated skipped as well as interacting promoters in CpG analysis are n =58, n =86 and n =71 (CF), n =138, n =126 and n =90 (FB), n =64, n =116 and n =96 (FL) and n =100, n =162 and n =102 (HB), n =55, n =92 and n =91 (HL), n =213, n =169 and n =125 (MB) and, n =87, n =86 and n =87 (NT). FB, forebrain. MB, midbrain. HB, hindbrain. CF, craniofacial mesenchyme. FL, forelimb. HL, hindlimb. NT, neural tube. HR, heart. P values are calculated by two-sided Wilcoxon rank test after adjusted for multiple testing (a-c, f-i) or by one-sided chi-squared test (d, e). A statistical test was not performed for H3K9me3 since most of the values are zero. The same DNA methylation, mRNA expression, DNaseI hypersensitivity, H3K27ac and H3K9me3 dataset (a mixture of fore- and hindlimb buds) were used for both fore- and hindlimb interaction analyses. For the boxplots in panels a-e and g-i, the central horizontal lines are the median, with the boxes extending from the 25th to the 75th percentiles. The whiskers further extend by ±1.5 times the interquartile range from the limits of each box.
Extended Data Fig. 5
Extended Data Fig. 5. Zic1/Zic4 and Mir9–2 brain enhancer knock-outs.
a, Map of the deleted region encompassing hs654 midbrain enhancer of Zic1/Zic4 together with H3K27ac, DNase-seq, ATAC-seq from midbrain and conservation track across 60 species. b, Sanger sequencing of the PCR product from hs654 knock-out mice (n = 4 biological replicates). c, representative PCR genotyping results of the hs654 enhancer knockout mice. Lanes in the gel were rearranged so that results for wild-type and heterozygous mice are adjacent to each other. d, Map of the deleted region encompassing hs267, hs266 and hs853 forebrain enhancers of Mir9–2 together with H3K27ac, DNase-seq, ATAC-seq from midbrain and conservation track across 60 species. e, Sanger sequencing of the PCR product from hs267–853 knock-out mice (n = 3 biological replicates). f, representative PCR genotyping results of the hs267–853 enhancer knockout mice. g, Genotype frequency data for enhancer knockout lines. Mice homozygous for either deletion were born at normal Mendelian ratios, and no gross phenotypes or impairments were observed. P-values were calculated using the one-sided chi-square test. h, Primer sequences used for genotyping of enhancer knock-out mice.
Extended Data Fig. 6:
Extended Data Fig. 6:. E–P interaction frequency in active and inactive tissues.
a, The ratio of E–P interaction frequency between active and inactive tissues. b, Univariate logistic regression for relative interaction frequencies and enhancer activity across all tissues. c, The ratio of E–P interaction frequency between active and inactive tissues for interactions within or across TADs. d, The distribution of distances between the closest TAD boundary and enhancer for enhancers acting within or across TADs. e, The ratio of interaction frequency between active and inactive tissues on interacting promoters or intervening regions before and after removing ENCODE annotated elements (±20kb). f, The ratio of E–P interaction frequency between active and inactive tissues for enhancers with different ranks. Only tissues with ≥10 interactions in each rank category are shown. g, The fold-change of gene expression levels between active state (baited enhancers interact with active promoters) and inactive state (baited enhancers don’t interact with promoters or in inactive tissues). Data are represented as mean ± s.e.m. h, The ratio of E–P interaction frequency between active and inactive tissues for expressed genes (TPM>=0.5) and lowly expressed or inactive genes (TPM<0.5). i, Chromatin interaction profiles in forebrain, midbrain and hindbrain centered on the enhancer hs1172 at Nr2f1 locus (chr13:78,057,768–78,705,499). j, The ratio of E–P interaction frequency between active and inactive brain regions for enhancers active in one of the brain domains. k-m, Cumulative frequency plots of inter-probe distances for the indicated loci and tissues. n-p, Frequency distribution of FISH inter-probe distances in 250 nm bins between Zic1/4 and hs654 (n), Mir9–2 and hs266 (o), Snai2 and hs1431 (p) in indicated tissues. P values are calculated by paired-sample (a, c, e, g, h, j) or unpaired-sample (d, f) two-sided Wilcoxon rank test and adjusted for multiple testing or by one-sided chi-squared test (b, n-p). For the boxplots in panels a, c-f, h and j, the central horizontal lines are the median, with the boxes extending from the 25th to the 75th percentiles. The whiskers further extend by ±1.5 times the interquartile range from the limits of each box.
Extended Data Fig. 7:
Extended Data Fig. 7:. Properties of invariant E–P interactions.
a, Metaplot showing average ratio of enhancer interaction frequency between active and inactive tissues for invariant (interactions present in all 7 main tissues: brain, face, limb, heart, neural tube, trunk and tail, n=171) and tissue-specific (≤ 6 main tissues, n=775) interactions. Light blue/orange shading indicates 95% confidence intervals estimated by non-parametric bootstrapping. b, The average ratio of invariant enhancer-promoter interaction frequency between active and inactive tissues for enhancers active in the brain, face, limb, heart and neural tube E–P. Data is shown only for tissues with at least 20 active enhancers that form invariant E–P interactions. P values were calculated by paired-sample two-sided Wilcox test and adjusted for multiple testing. c, The number of tissues in which enhancers forming invariant (10 tissues, n=98) or tissue-specific (≤ 4 tissues, n=196) E–P interactions are active in vivo. d, The average phyloP scores of enhancers forming invariant (10 tissues, n=98) or tissue-specific (≤ 4 tissues, n=196) E–P interactions. P values in panels c and d were calculated by two-sided Wilcox test. e, Gene Ontology enrichment for genes that form invariant (10 tissues) E–P interactions (Biological process and Molecular function). Q values were calculated by over-representation test and adjusted for multiple testing. For the boxplots in panels b-d, the central horizontal lines are the median, with the boxes extending from the 25th to the 75th percentiles. The whiskers further extend by ±1.5 times the interquartile range from the limits of each box.
Extended Data Fig. 8:
Extended Data Fig. 8:. Tissue specificity of enhancer-enhancer chromatin interactions.
a, Pie chart showing the fraction of E–E interactions present in different numbers of tissues. b, The average ratio of E–E interaction frequency between active and inactive tissues for enhancers active in neural tube, heart, tail and trunk. The number of E–E interactions for each tissue is indicated at the top. P values were calculated by paired-sample two-sided Wilcox test and adjusted for multiple testing. c, The average ratio of enhancer–enhancer interaction frequency between active and inactive tissues for enhancers of different ranks. The E–E interaction number for rank 3 to 5 are n=217, n=122 and n=69 (brain), n=53, n=59 and n=18 (cf), n=100, n=84 and n=45 (limb), n=80, n=51 and n=32 (nt), respectively. Cf: face. Nt: neural tube. P values were calculated by unpaired-sample two-sided Wilcox test with multiple testing. For the boxplots in panels b and c, the central horizontal lines are the median, with the boxes extending from the 25th to the 75th percentiles. The whiskers further extend by ±1.5 times the interquartile range from the limits of each box.
Extended Data Fig. 9:
Extended Data Fig. 9:. CRISPR/Cas9-mediated ZRS limb enhancer replacement with a fragment of the lacZ gene.
a, Schematic overview of the strategy for ZRS enhancer replacement. A 4.5 kb mouse genomic region containing the ZRS enhancer (red) is shown together with the vertebrate conservation track (dark blue). The donor vector contained two homology arms (gray) and an inactive fragment of the lacZ coding sequence (blue). The sgRNA recognition site is indicated in purple. PCR primers used for genotyping are shown as arrows. b, PCR genotyping analysis of heterozygous and wildtype mice using primer pairs LacZ-F1 and LacZ-R1 or LacZ-F2 and LacZ-R2. See Methods for details. c, Shh whole-mount in situ hybridization in E10.5 wild type (left) and ZRSlacZ/lacZ knock-in embryos (n ≥ 3 biological replicates for each genotype). Shh expression is not detectable in limb buds but is present elsewhere in the embryo. d, Primer sequences used for genotyping of ZRSlacZ/+ knock-in mice.
Fig. 1:
Fig. 1:. Identification of enhancer-centric chromatin interactions in 10 mouse embryonic tissues.
a, Experimental design. Ten tissue samples from E11.5 mouse embryos were used to prepare Hi-C libraries followed by oligonucleotide capture with probes targeting 1,198 baited regions, including 935 enhancers (representative enhancer activities are shown above), 176 promoters and 87 control elements. b, Enhancer capture Hi-C identifies chromatin interactions of enhancers. A 3 Mb region containing the hs654 midbrain enhancer (chr9:89500000–92500000; mm10) is shown with the following annotations from top to bottom: TADs (dashed lines outline TAD boundaries),; Refseq genes; normalized hs654-centered chromatin interaction frequencies in midbrain (MB) shown as plot and purple heat map below; normalized Zic1/Zic4-promoter-centered chromatin interaction frequencies; H3K27ac and H3K4me3 ChIP-seq profiles in midbrain at E11.5; CTCF ChIP-seq profile in whole brain (WB) at E12.5,,. The average bin size is ~3kb. Curved lines indicate significant interactions. c, Pie chart showing the percentage of enhancers interacting with different number of genes. d, The hs1428 limb enhancer (green box) is in a non-coding region (purple bar) which is duplicated in patients with radial ray deficiency (pink box indicates homologous region in the mouse genome). The hs1428 limb enhancer forms significant chromatin interactions with the promoter of Tbx15 (highlighted in blue) located ~400 kb away (chr3:99,000,000–99,900,000; mm10) in the forelimb (FL). e, Two de novo rare variants (purple boxes) identified in patients with neurodevelopmental disorders, are in the hs1523 (green bar) forebrain/midbrain enhancer which forms strong significant interactions with the promoter of Foxg1 (highlighted in blue) located ~700 kb away (chr12:49,121,092–50,469,462; mm10) in the forebrain (FB). Red arrowheads indicate capture Hi-C viewpoints.
Fig. 2:
Fig. 2:. Properties of promoters that are skipped by remote enhancers.
a, Barplot showing enhancers grouped by their genomic positions relative to the interacting genes. Diagram below shows corresponding schematic gene loci in which enhancer (blue oval) interacts with a neighboring gene (left), skips one gene (middle) or skips two or more genes (right). Arches indicate significant interactions. b, Normalized capture Hi-C data from the viewpoint of the hs271 enhancer (red arrowhead) is shown with significant interactions (black arches) in the forebrain at E11.5 (chr13:77,500,000– 78,500,000; mm10). Pou5f2 and Nr2f1 promoters are highlighted in grey and blue. c, CpG methylation, DNase-seq and RNA-seq profiles at Pou5f2 and Nr2f1 promoters in E11.5 forebrain,,. d-f, The CpG methylation (d), mRNA expression levels (e, transcript per million (TPM)) and DNase signal (f) of enhancer-interacting and skipped promoters in tissues where enhancers are active (FB, forebrain; CF, face; FL, forelimb). The number of skipped and interacting promoters in panel d are n=265 and n=90 (FB), n=144 and n=71 (CF) and n=182 and n=96 (FL) and the P values are 3.6×10⁻¹⁷, 3.9×10−07, 2.2×10⁻¹¹, respectively. The number of high and low methylated skipped as well as interacting promoters in panel e are n=134, n=121 and n=90 (FB), n=56, n=81 and n=71 (CF) and n=64, n=111 and n=96 (FL) and the P values are 1×10⁻³⁵, 1.3×10⁻¹⁸, 6.9×10⁻²² and 6.4×10⁻⁵, respectively. The number of high and low methylated skipped as well as interacting promoters in panel f are n=139, n=126 and n=90 (FB), n=58, n=86 and n=71 (CF) and n=66, n=116 and n=96 (FL) and the P values are 2.4×10⁻³⁴, 2.9×10⁻²² and 0.012, 7.8×10⁻²⁵ and 0.0039, respectively. High me / Low me, high / low methylation at skipped promoters (≥50% or <50% CpG methylation within ± 1 kb from TSS). P-values were calculated using the two-sided Wilcoxon rank test and adjusted for multiple testing. For the boxplots in panels d-f, the central horizontal lines are the median, with the boxes extending from the 25th to the 75th percentiles. The whiskers further extend by ±1.5 times the interquartile range from the limits of each box.
Fig. 3:
Fig. 3:. Enhancers are required for the expression of interacting genes.
Knock-out analysis of hs654 and hs267/hs266/hs853 enhancers. a,b, Predicted chromatin interactions (black arches) between enhancers (green boxes) and target genes (black boxes) are shown. Gene and enhancer models are not drawn to scale. c,d, Transcriptome-wide mRNA expression changes in E11.5 whole midbrain (MB) of hs654 knock-out mice (c) and in E11.5 forebrain (FB) of hs267/hs266/hs853 knockout mice (d) relative to wildtype mice (WT). Points indicate individual genes, with blue indicating statistically significant differences after adjustment for multiple comparisons (Padj < 0.05). N. S., not significant. P values were calculated using DESeq2.
Fig. 4:
Fig. 4:. Tissue specificity of developmental enhancer interactions.
a, Heatmap showing relative E–P chromatin interaction frequencies (scaled to the max value among tissues in each E–P interaction, green) and the in vivo enhancer activities (blue) of 969 E–P chromatin interactions. k-means clustering (k = 10) was performed on interaction frequencies. The six highlighted tissue-specific interaction clusters match in vivo enhancer activities. b, Interaction profiles across 10 tissues centered on the hs654 enhancer (red arrowhead indicates capture Hi-C viewpoint). The top left shows hs654 enhancer activity in a transgenic mid-gestation (E11.5) mouse embryo. Top right images show Zic1 and Zic4 mRNA whole-mount in situ hybridization (WISH) at E10.5 (Images reproduced with permission from Gene Expression Database (GXD; Zic4) and Embrys database (http://embrys.jp; Zic1). Heatmaps with normalized interaction frequencies in each of the 10 tissues are shown below. Curved lines indicate significant interactions. c, e, Average ratio of E–P or E–E interaction frequency between active and inactive tissues based on the analysis of 946 E–P or 640 E–E chromatin interactions are shown (see Methods for details of normalization procedure). Light blue shading indicates 95% confidence intervals estimated by non-parametric bootstrapping. d, f, Average ratio of E–P or E–E interaction frequency between active and inactive tissues for enhancers active in brain, face and limb (see Extended Data Fig. 6a and Extended Data Fig. 8b for other tissues). The P values for E–P interactions are 5.07×10−61 (Brain), 6.1×10⁻²⁸ (Face), 6.21×10−43 (Limb). The P values for E–E interactions are 3.3×10−38 (Brain), 1×10⁻¹⁷ (Face), 1.5×10⁻²⁹ (Limb). FB, forebrain. MB, midbrain. HB, hindbrain. CF, craniofacial mesenchyme. HR, heart. FL, forelimb. HL, hindlimb. TK, trunk. TL, tail. NT, neural tube. For the boxplots in panels d and f, the central horizontal lines are the median, with the boxes extending from the 25th to the 75th percentiles. The whiskers further extend by ±1.5 times the interquartile range from the limits of each box.
Fig. 5:
Fig. 5:. Imaging enhancer—promoter interactions in developing mouse embryo.
a, The genomic positions of probes labeling enhancers (green) and genes (orange) are shown on the top. Gene and enhancer models are not drawn to scale. Images of representative nuclei (DAPI, blue) from E11.5 midbrain (left) and forelimb (right) after FISH with Zic1/4 and hs654 probe pairs (left panel), E11.5 forebrain (left) and forelimb (right) after FISH with Mir9–2 and hs266 probe pairs (middle panel), E11.5 face (left) and forebrain (right) after FISH with Snai2 and hs1431 probe pairs (right panel) are shown. Corresponding zoomed in images are shown below. b, Violin plot showing the distribution of inter-probe distance (μm) between fosmid probe pairs in active and inactive tissues. Red dashed line indicates co-localization (<0.25 μm) and the numbers below represent the fraction of loci with co-localized probes. P values were calculated by paired-sample two-sided Wilcox test and adjusted for multiple testing for interaction frequencies comparison between active and inactive tissues, unpaired-sample two-sided Wilcox test was performed on comparison of inter-probe distance between different tissues. FB, forebrain. MB, midbrain. CF, craniofacial mesenchyme. FL, forelimb. For the boxplots in panel b, the central horizontal lines are the median, with the boxes extending from the 25th to the 75th percentiles. The whiskers further extend by ±1.5 times the interquartile range from the limits of each box.
Fig. 6:
Fig. 6:. Properties of tissue-invariant enhancer–promoter chromatin interactions.
a-c, Chromatin interaction profiles across 10 tissues centered on the hs1431 enhancer in the Snai2 locus (chr16:14,610,000–15,220,000; mm10) (a), the hs699 enhancer in the Dlx5/Dlx6 locus (chr7: 136,400,000–137,400,000; mm10) (b) and the ZRS enhancer in the Shh locus (chr5:28,320,000–29,400,000; mm10) (c). Shown above are corresponding enhancer activities in transgenic E11.5 mouse embryos and corresponding interacting gene mRNA WISH in E11.5 or E10.5 embryos. Heatmaps with normalized interaction frequencies in each of the 10 tissues are shown below. CTCF ChIP-seq profiles (blue) in the whole brain (WB) and forelimb (FL) at E12.5 are shown at the bottom. Arches indicate significant interactions. Red arrowheads depict capture Hi-C viewpoints. d, Pie chart showing the fraction of E–P interactions present in different numbers of tissues. e, Fraction of E–P interactions that overlap with CTCF peaks grouped by number of tissues in which interaction was detected. f, Schematic of the Cas9-mediated strategy for replacement of the mouse ZRS sequence (red box) with a fragment of bacterial LacZ gene (blue box) at the Shh (black) genomic locus. CTCF binding sites are indicated in yellow. Shh mRNA WISH analysis in wild type and ZRSLacZ/LacZ E10.5 mouse forelimb buds are shown below. See Extended Data Fig. 9 for details. g, Schematic overview of the capture Hi-C approach to detect chromatin interactions in the presence and absence of the ZRS in limbs of the same mouse using biotinylated RNA probes (B) targeting ZRS and LacZ. Limb buds from heterozygous transgenic mice were dissected followed by Capture Hi-C to enrich for ZRS and LacZ interactions. h, Allele-specific ZRS-region-centric chromatin interactions in limb buds of E11.5 ZRS+/LacZ mice. Arches indicate significant interactions. WISH images in A and B have been reproduced with permission from Gene Expression Database (GXD, Ebf3) and Embrys database (http://embrys.jp; Snai2).

References

    1. Lettice LA et al. Disruption of a long-range cis-acting regulator for Shh causes preaxial polydactyly. Proc. Natl. Acad. Sci. U. S. A 99, 7548–7553 (2002). - PMC - PubMed
    1. Long HK et al. Loss of Extreme Long-Range Enhancers in Human Neural Crest Drives a Craniofacial Disorder. Cell Stem Cell 27, 765–783.e14 (2020). - PMC - PubMed
    1. Shlyueva D, Stampfel G. & Stark A. Transcriptional enhancers: from properties to genome-wide predictions. Nat. Rev. Genet 15, 272–286 (2014). - PubMed
    1. Long HK, Prescott SL & Wysocka J. Ever-Changing Landscapes: Transcriptional Enhancers in Development and Evolution. Cell 167, 1170–1187 (2016). - PMC - PubMed
    1. Schoenfelder S. & Fraser P. Long-range enhancer–promoter contacts in gene expression control. Nat. Rev. Genet 20, 437–455 (2019). - PubMed

Methods Only References

    1. Dryden NH et al. Unbiased analysis of potential targets of breast cancer susceptibility loci by Capture Hi-C. Genome Res. 24, 1854–1868 (2014). - PMC - PubMed
    1. Hughes JR et al. Analysis of hundreds of cis-regulatory landscapes at high resolution in a single, high-throughput experiment. Nat. Genet 46, 205–212 (2014). - PubMed
    1. Orlando G, Kinnersley B. & Houlston RS Capture Hi-C Library Generation and Analysis to Detect Chromatin Interactions. Curr. Protoc. Hum. Genet e63 (2018). - PubMed
    1. Pennacchio LA et al. In vivo enhancer analysis of human conserved non-coding sequences. Nature 444, 499–502 (2006). - PubMed
    1. Wingett S. et al. HiCUP: pipeline for mapping and processing Hi-C data. F1000Res. 4, 1310 (2015). - PMC - PubMed