. 2024 Apr;56(4):697-709.
doi: 10.1038/s41588-024-01692-z. Epub 2024 Mar 20.

The homeobox transcription factor DUXBL controls exit from totipotency

Affiliations

The homeobox transcription factor DUXBL controls exit from totipotency

Maria Vega-Sendino et al. Nat Genet. 2024 Apr.

Abstract

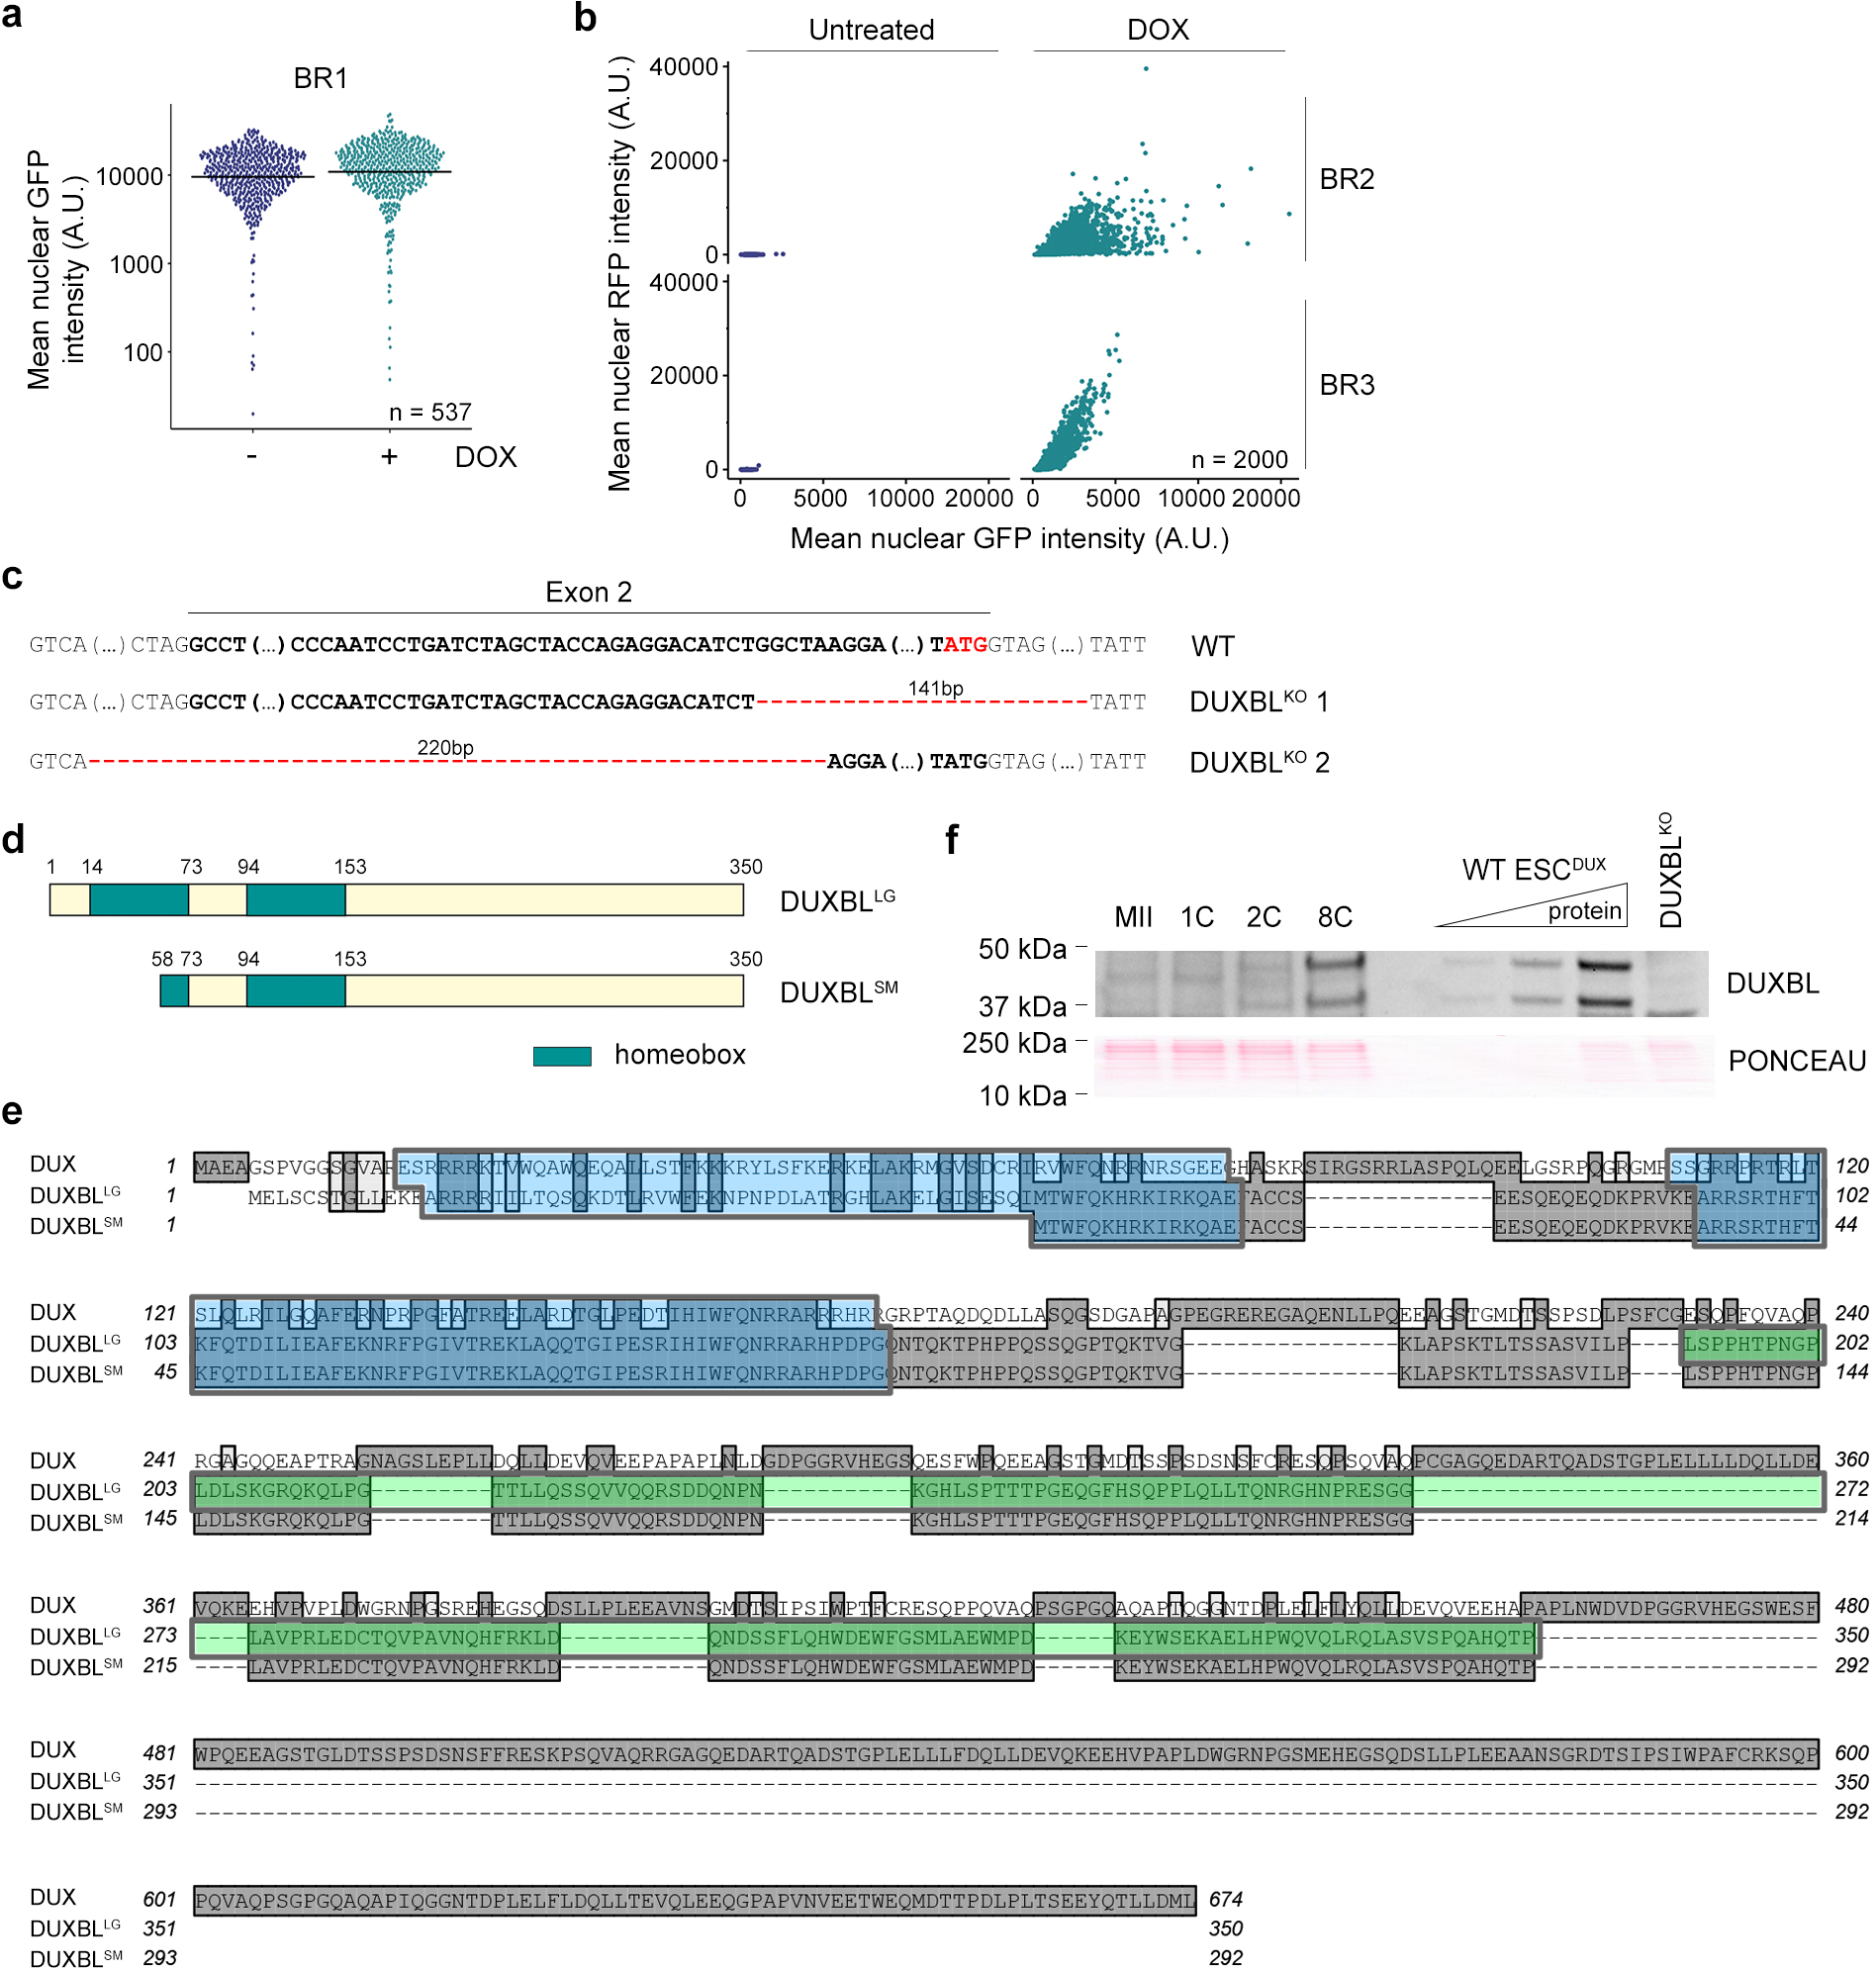
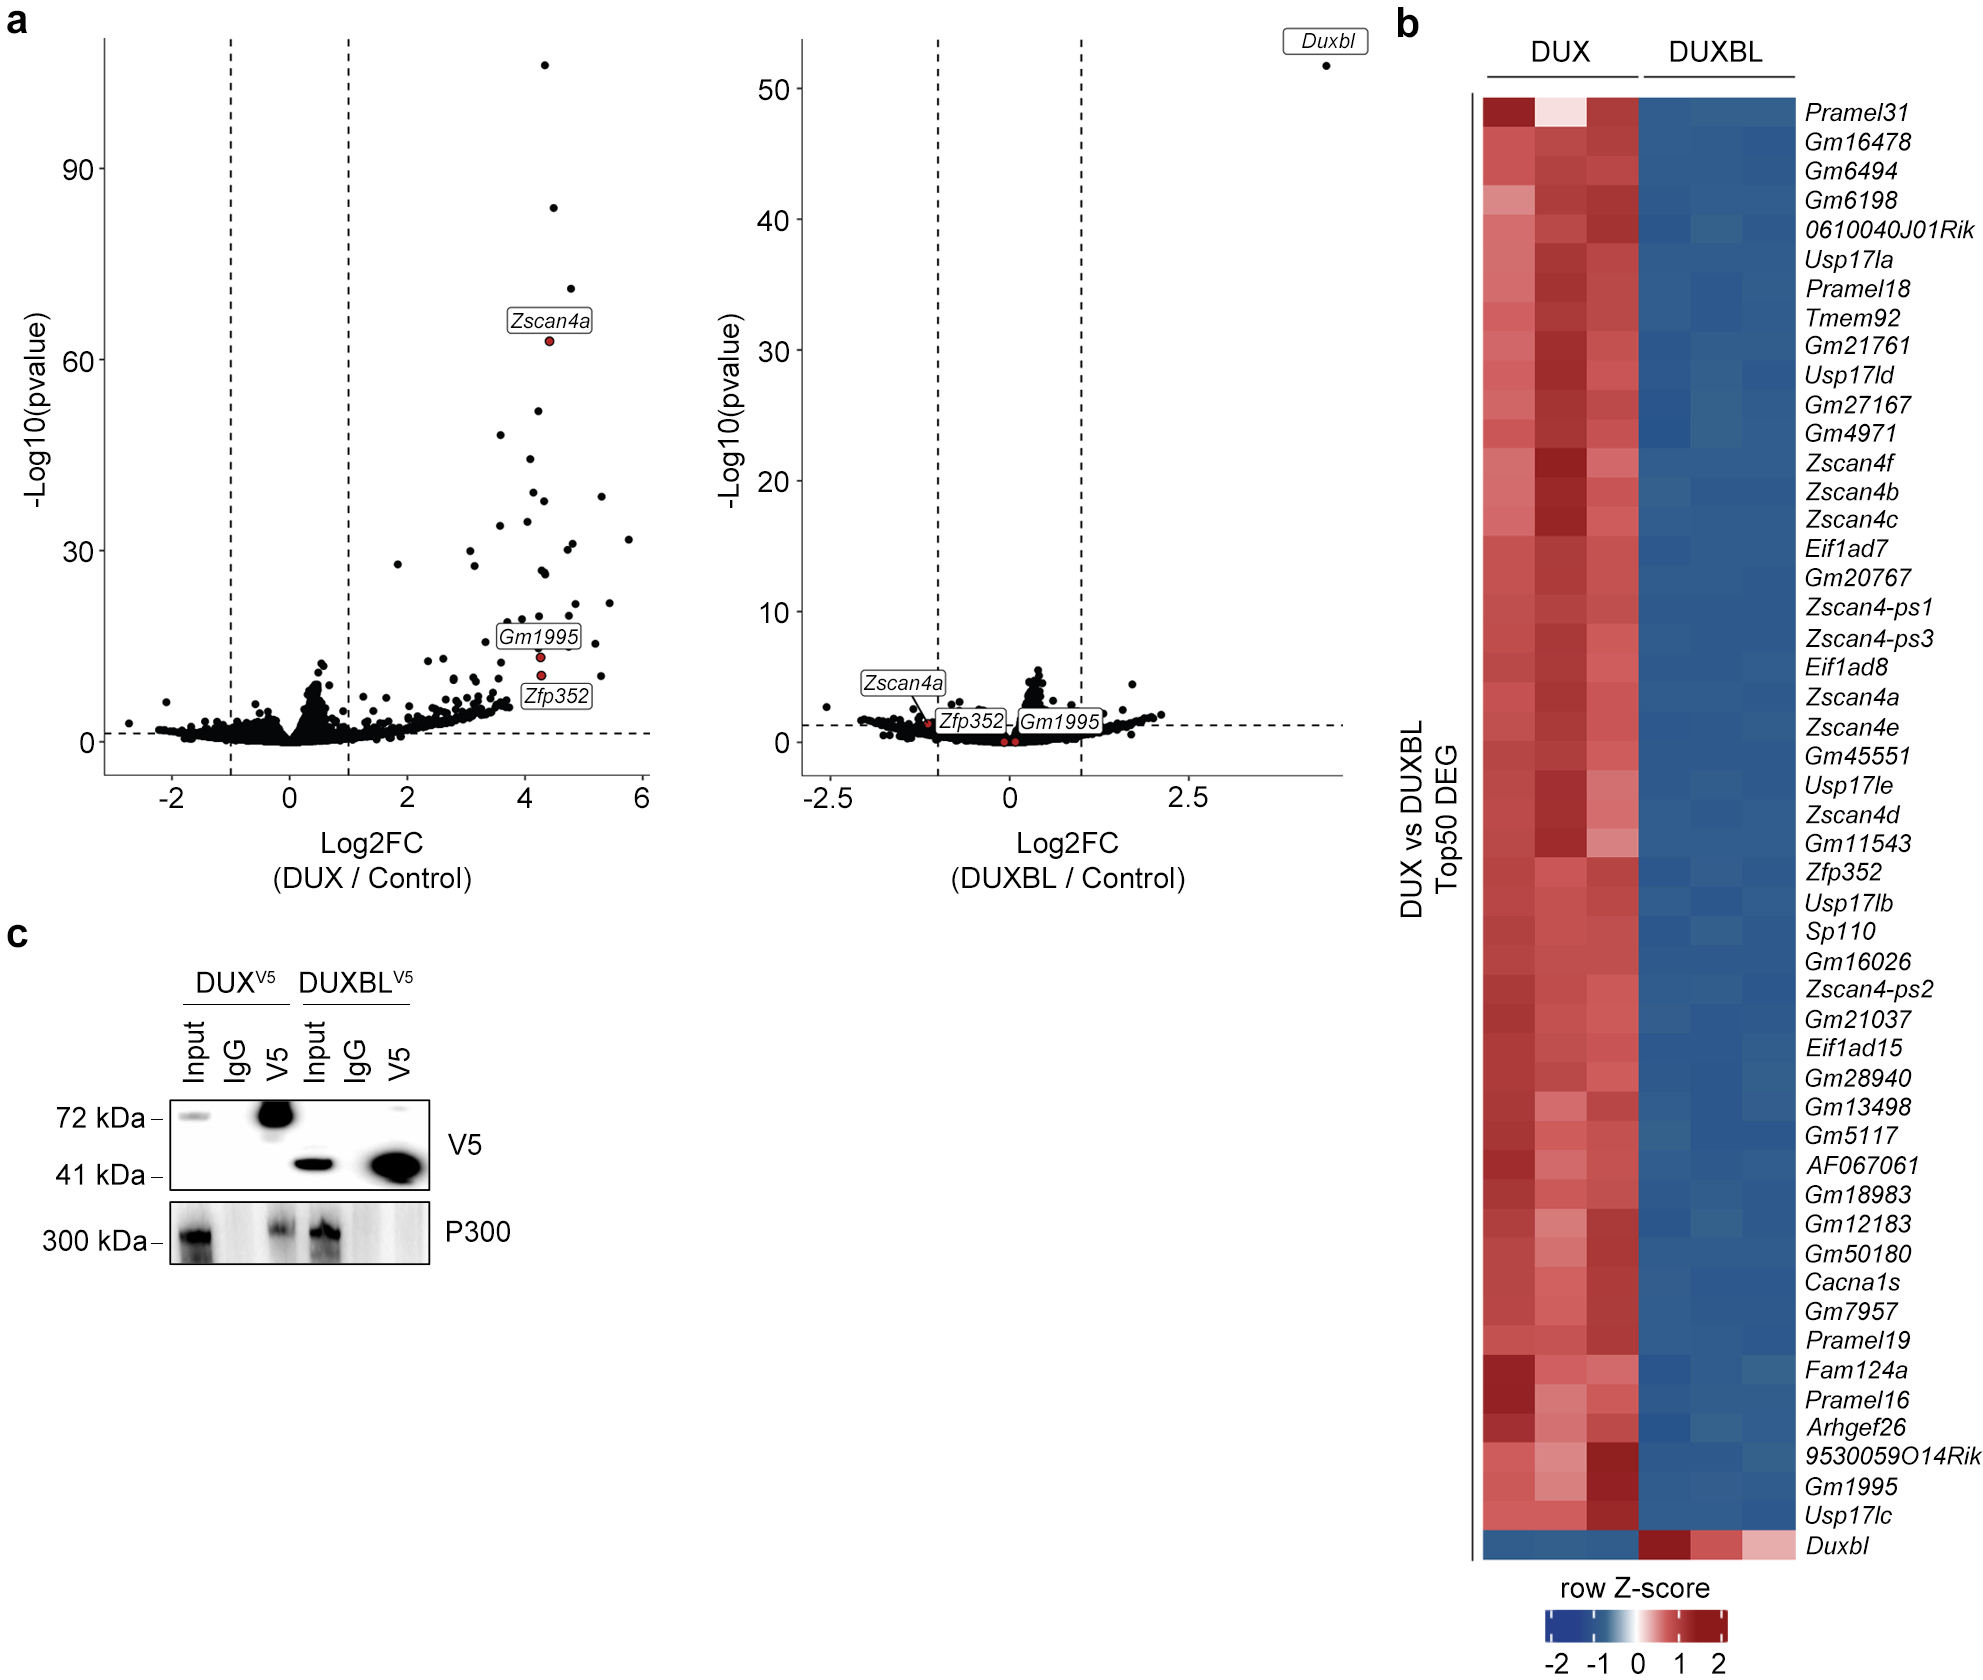
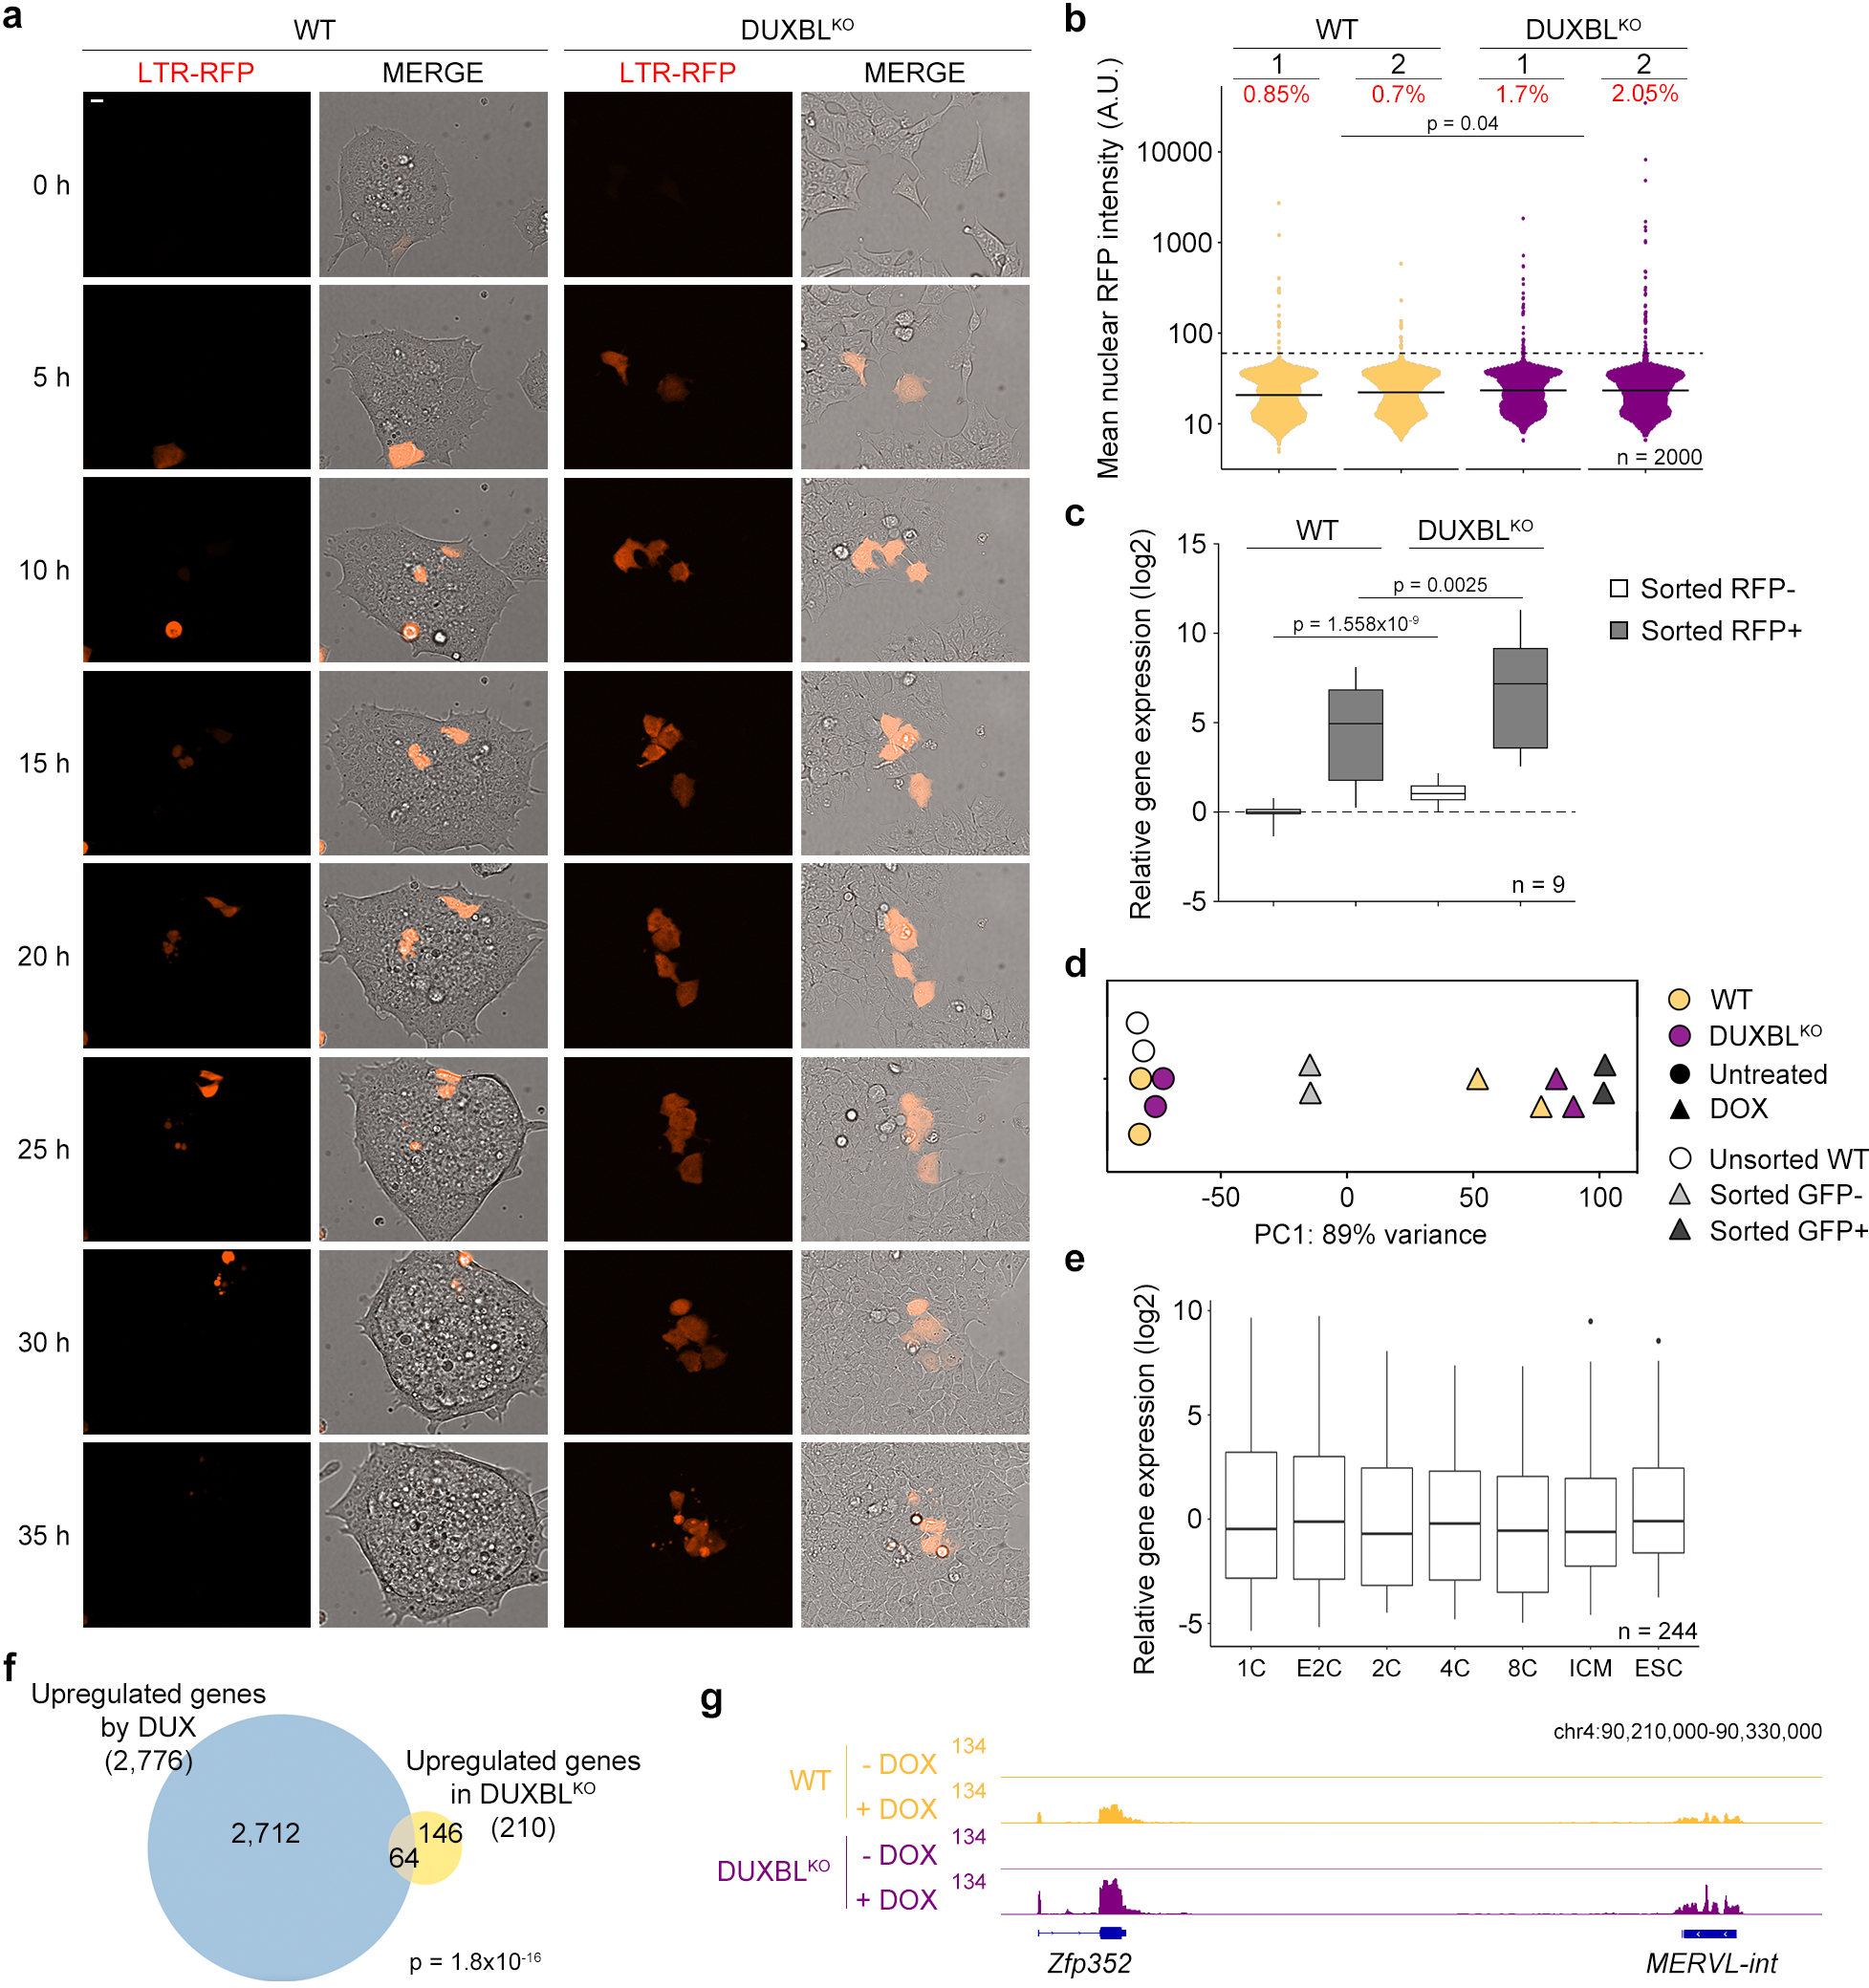
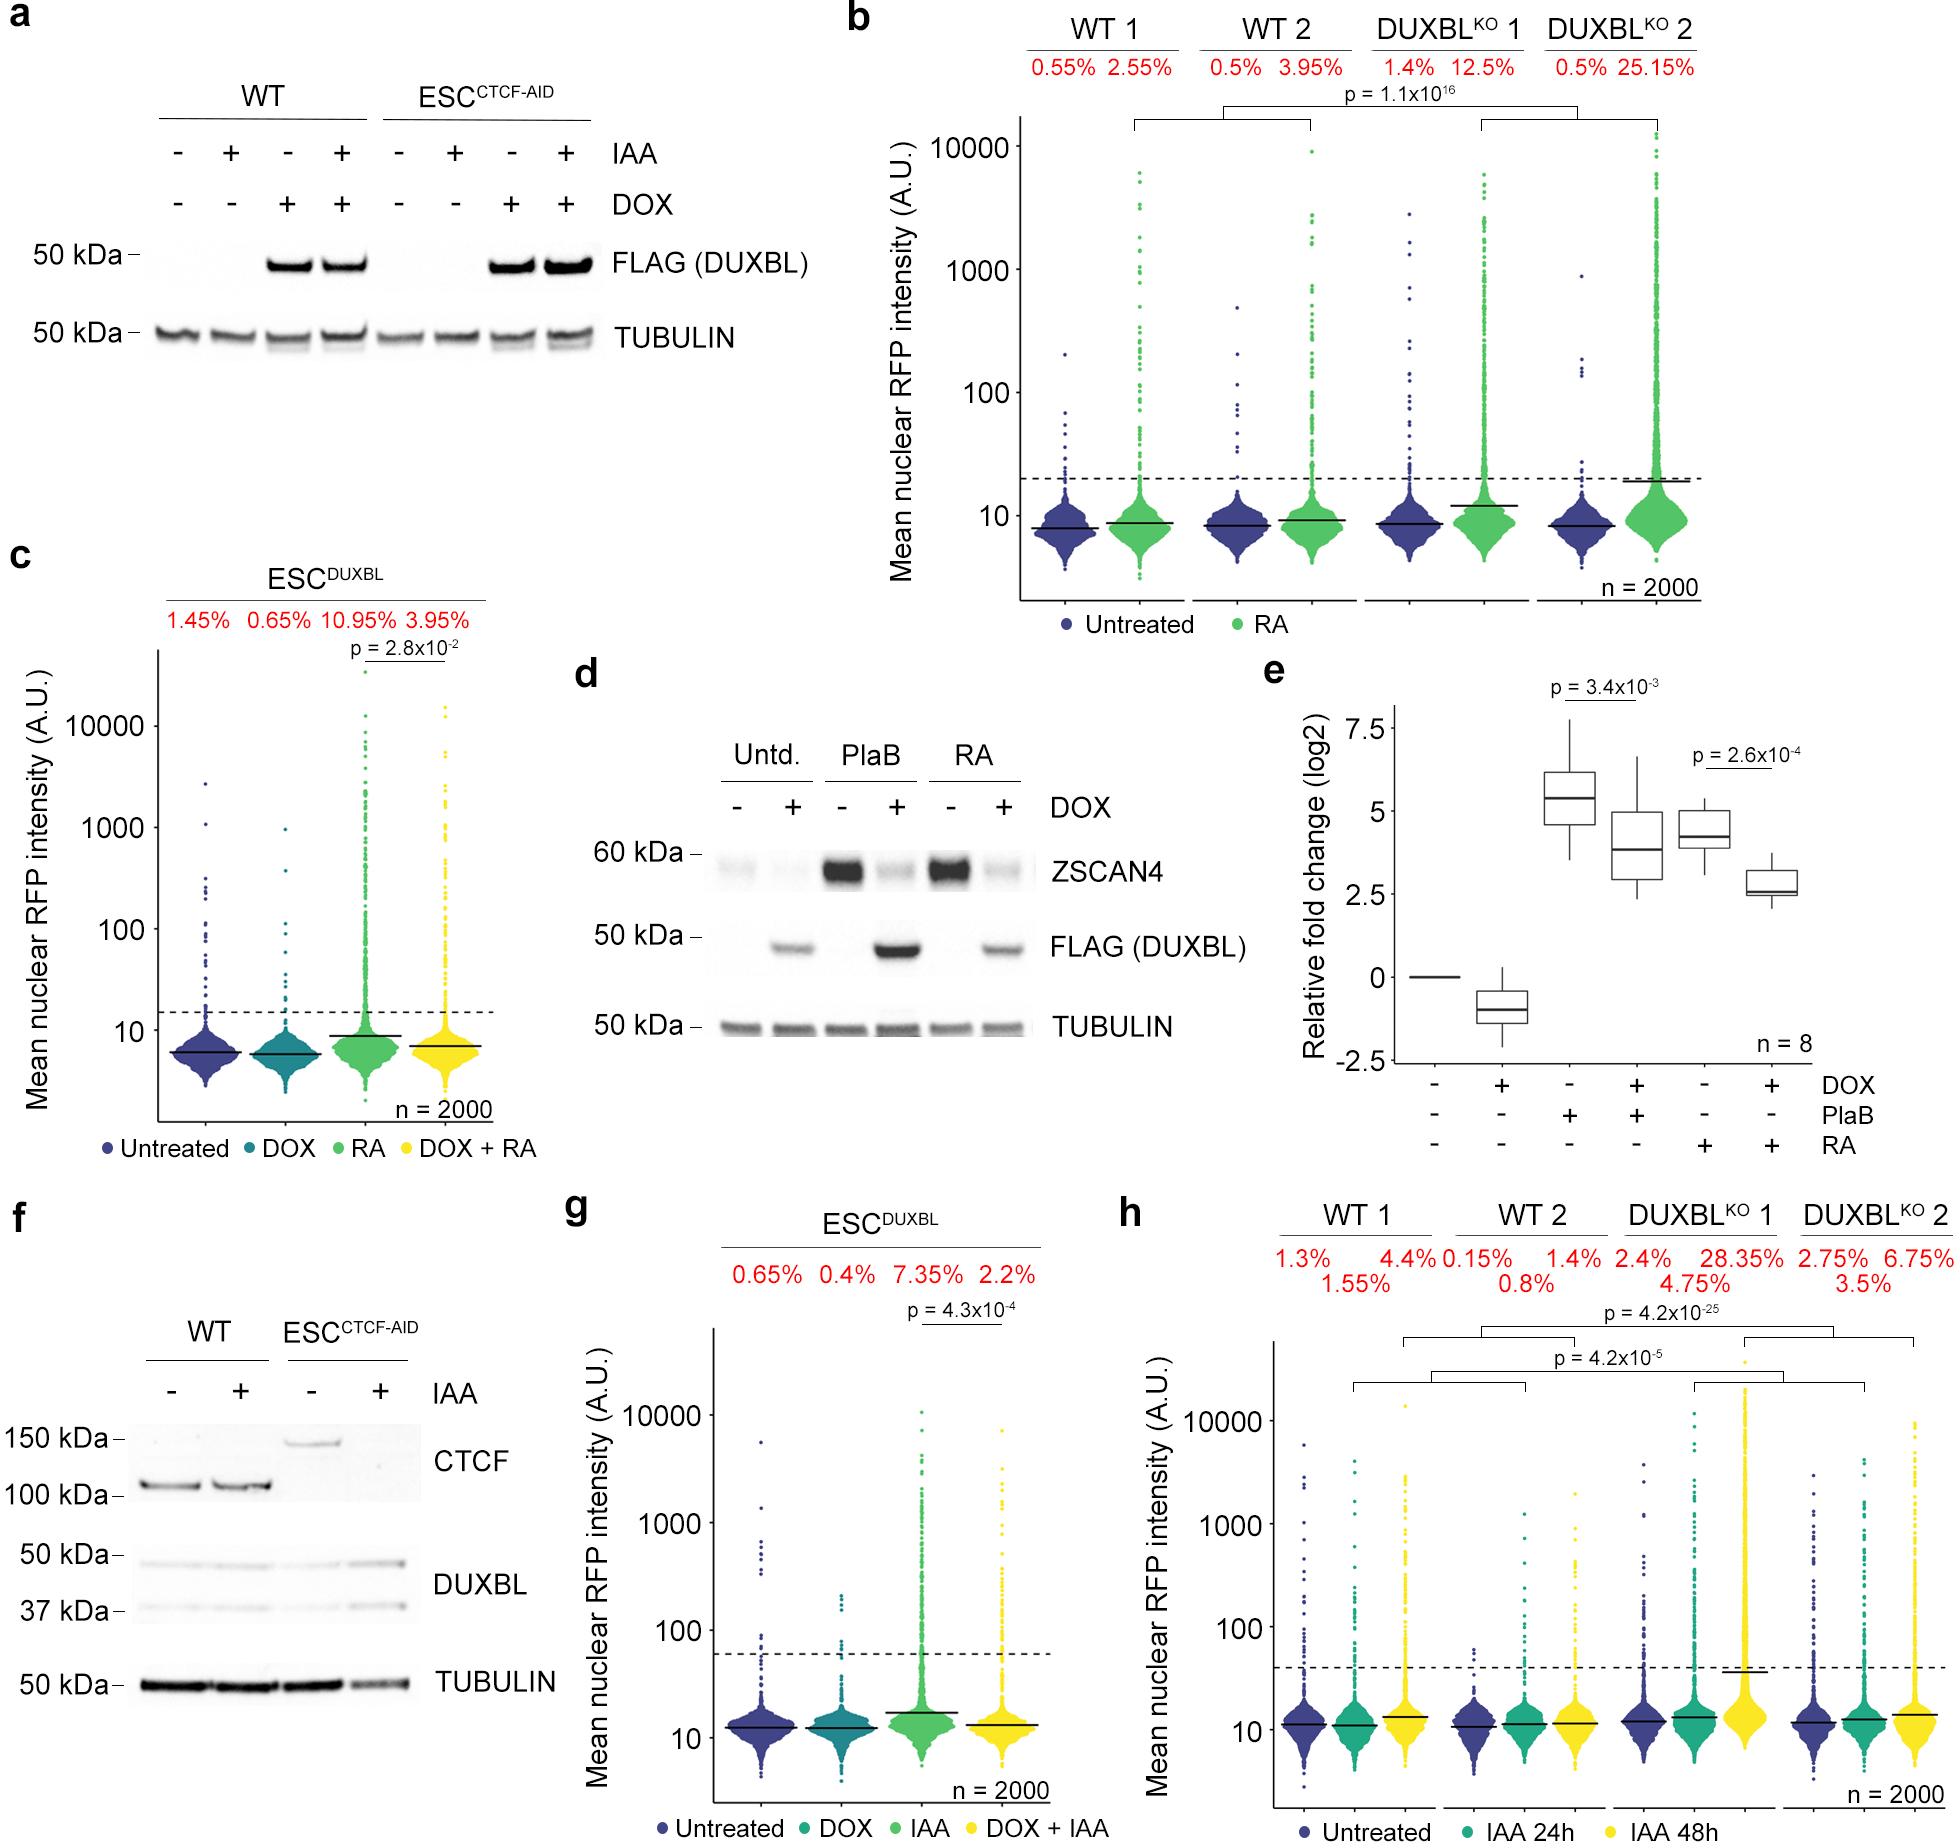
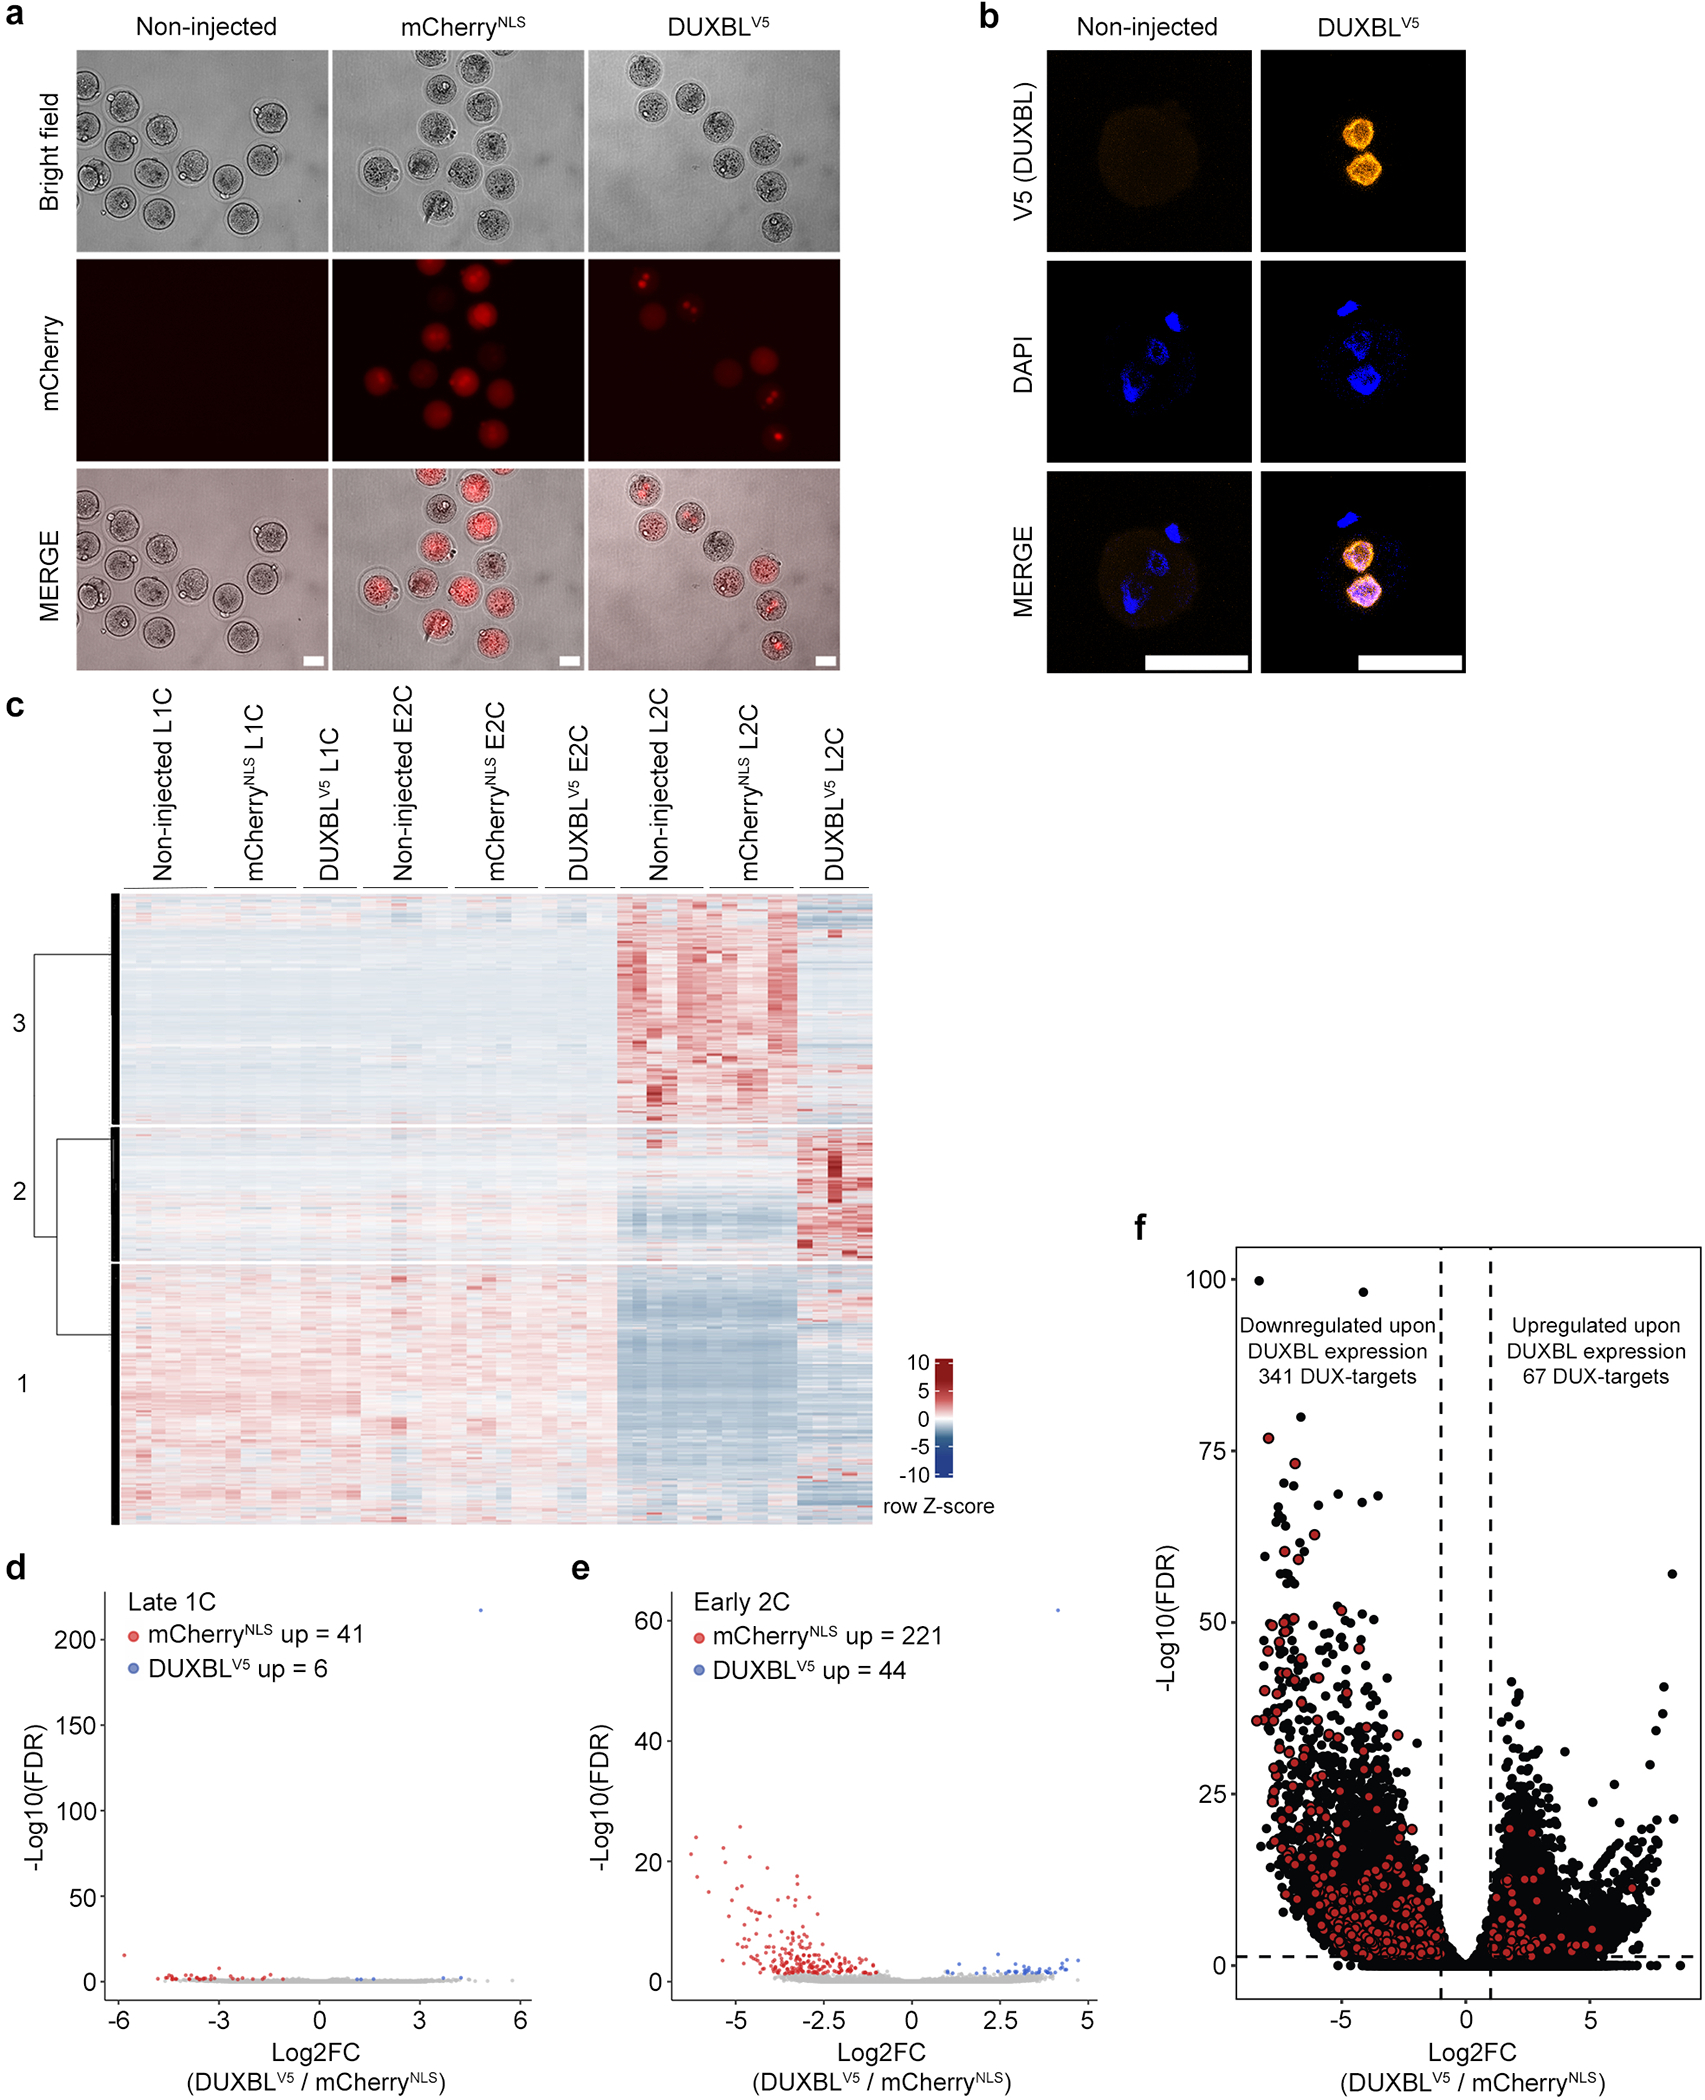
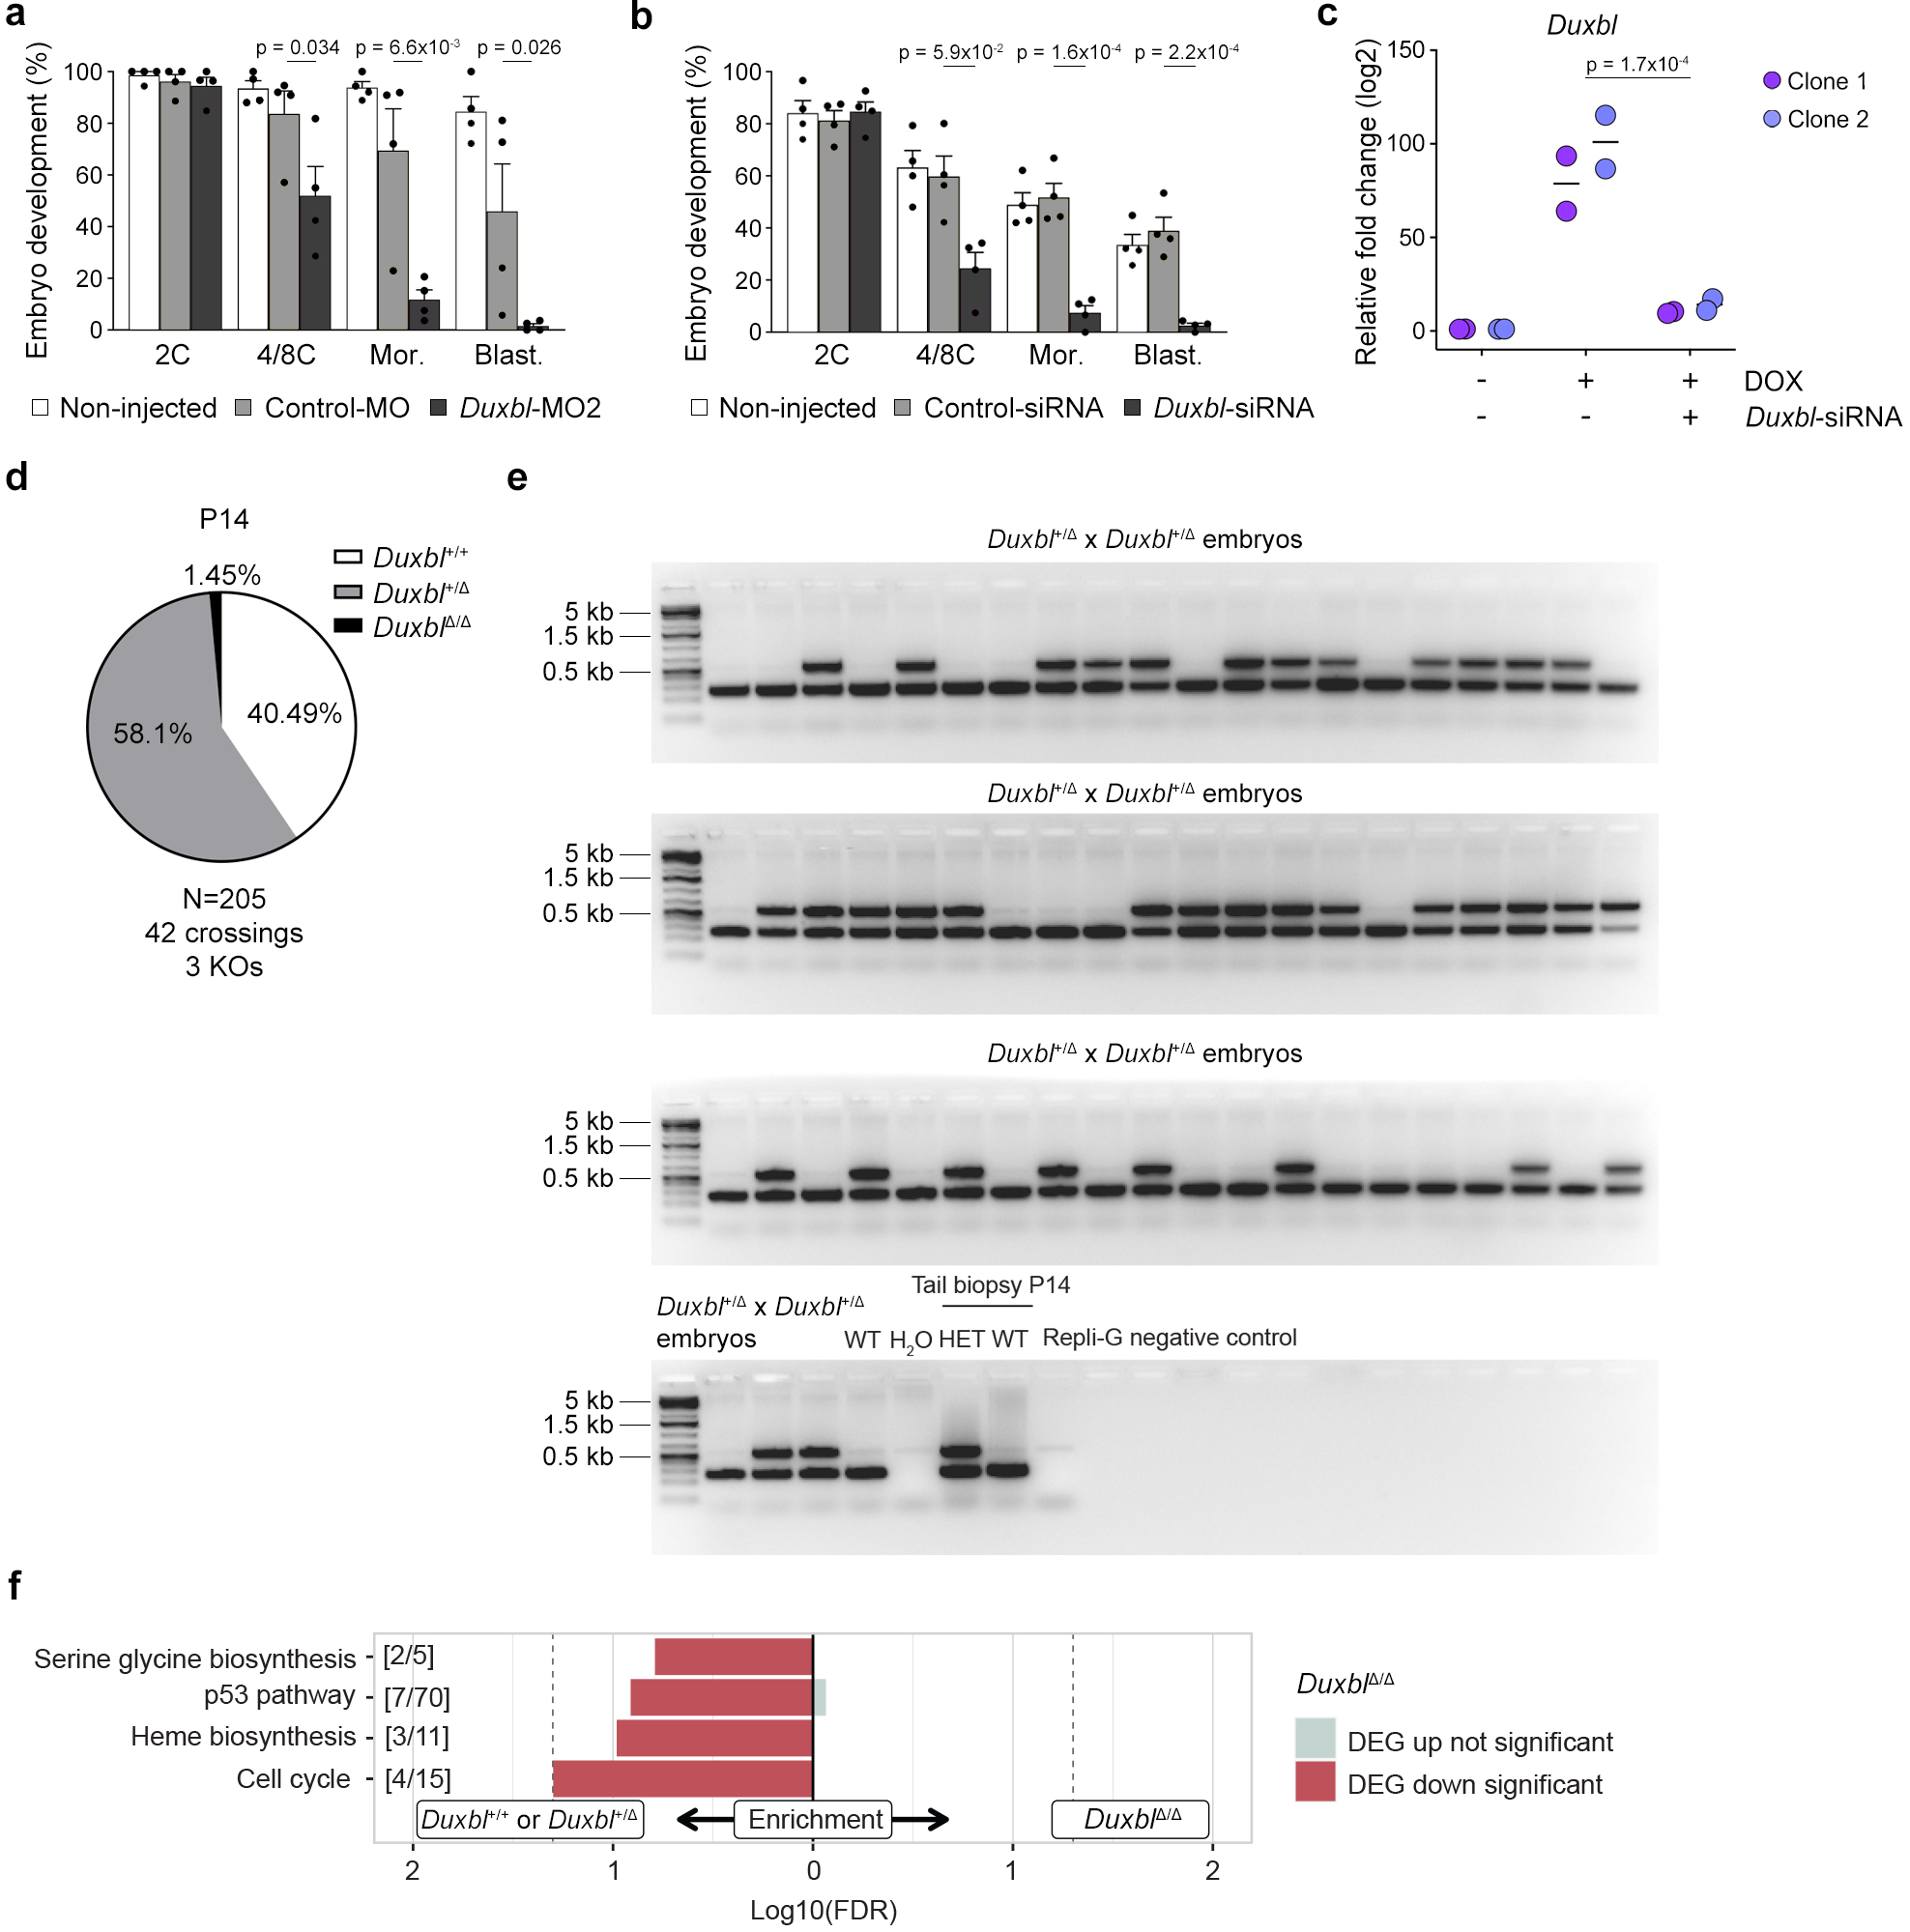
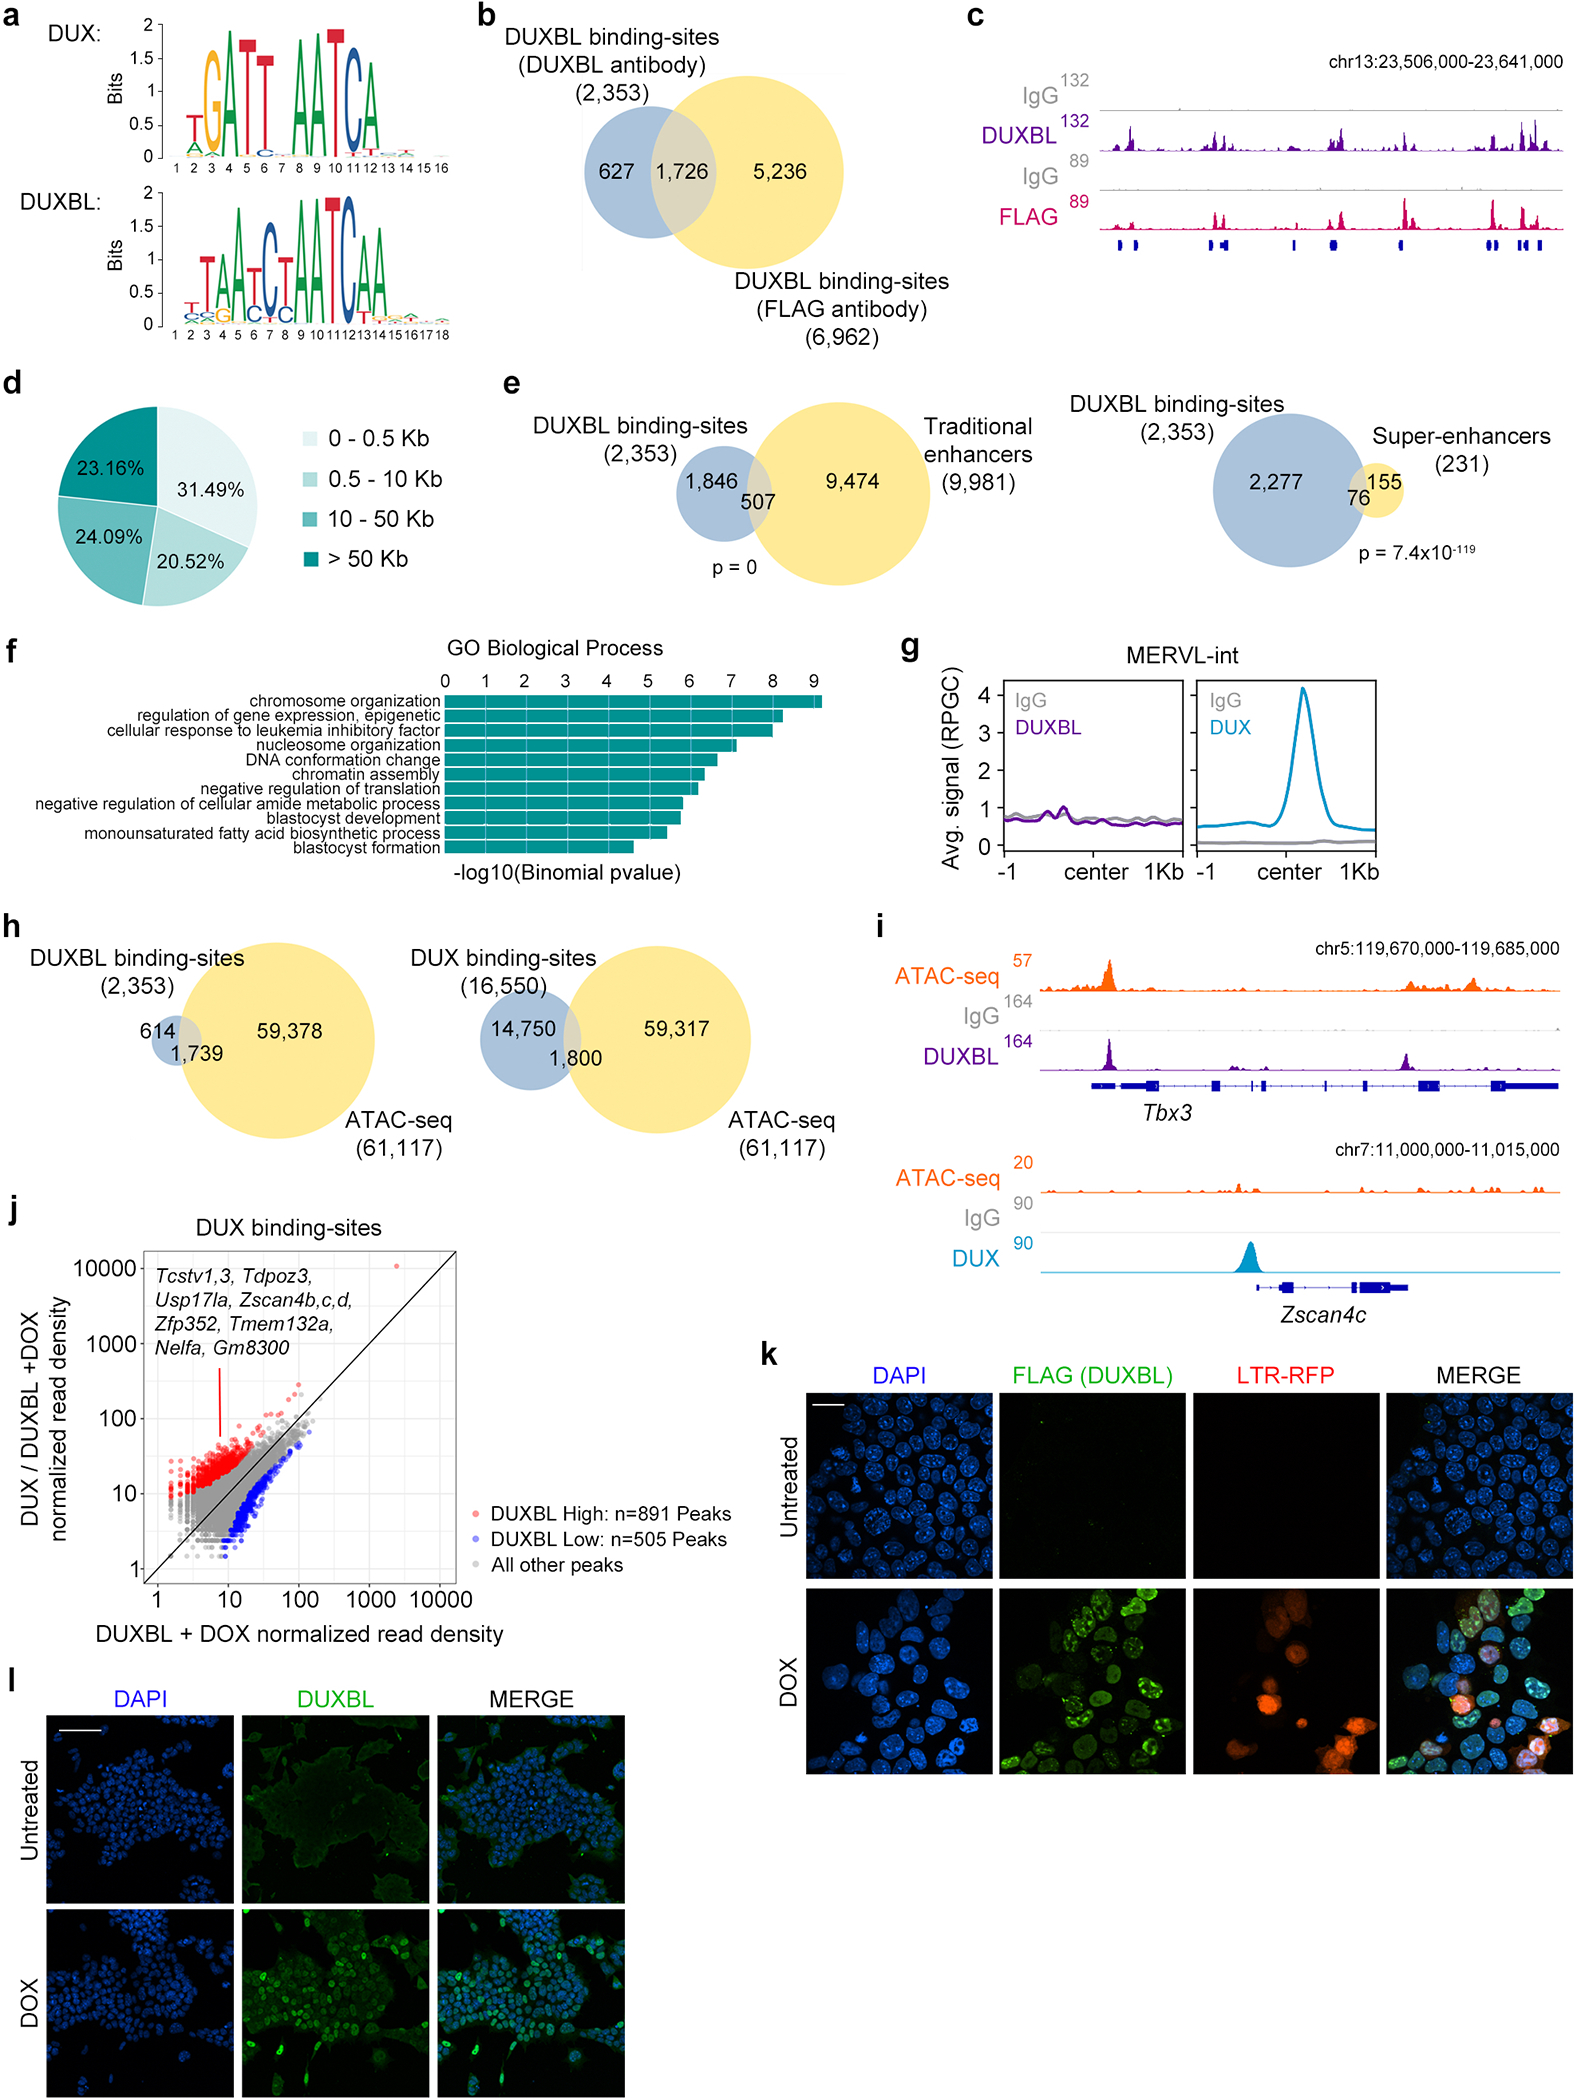
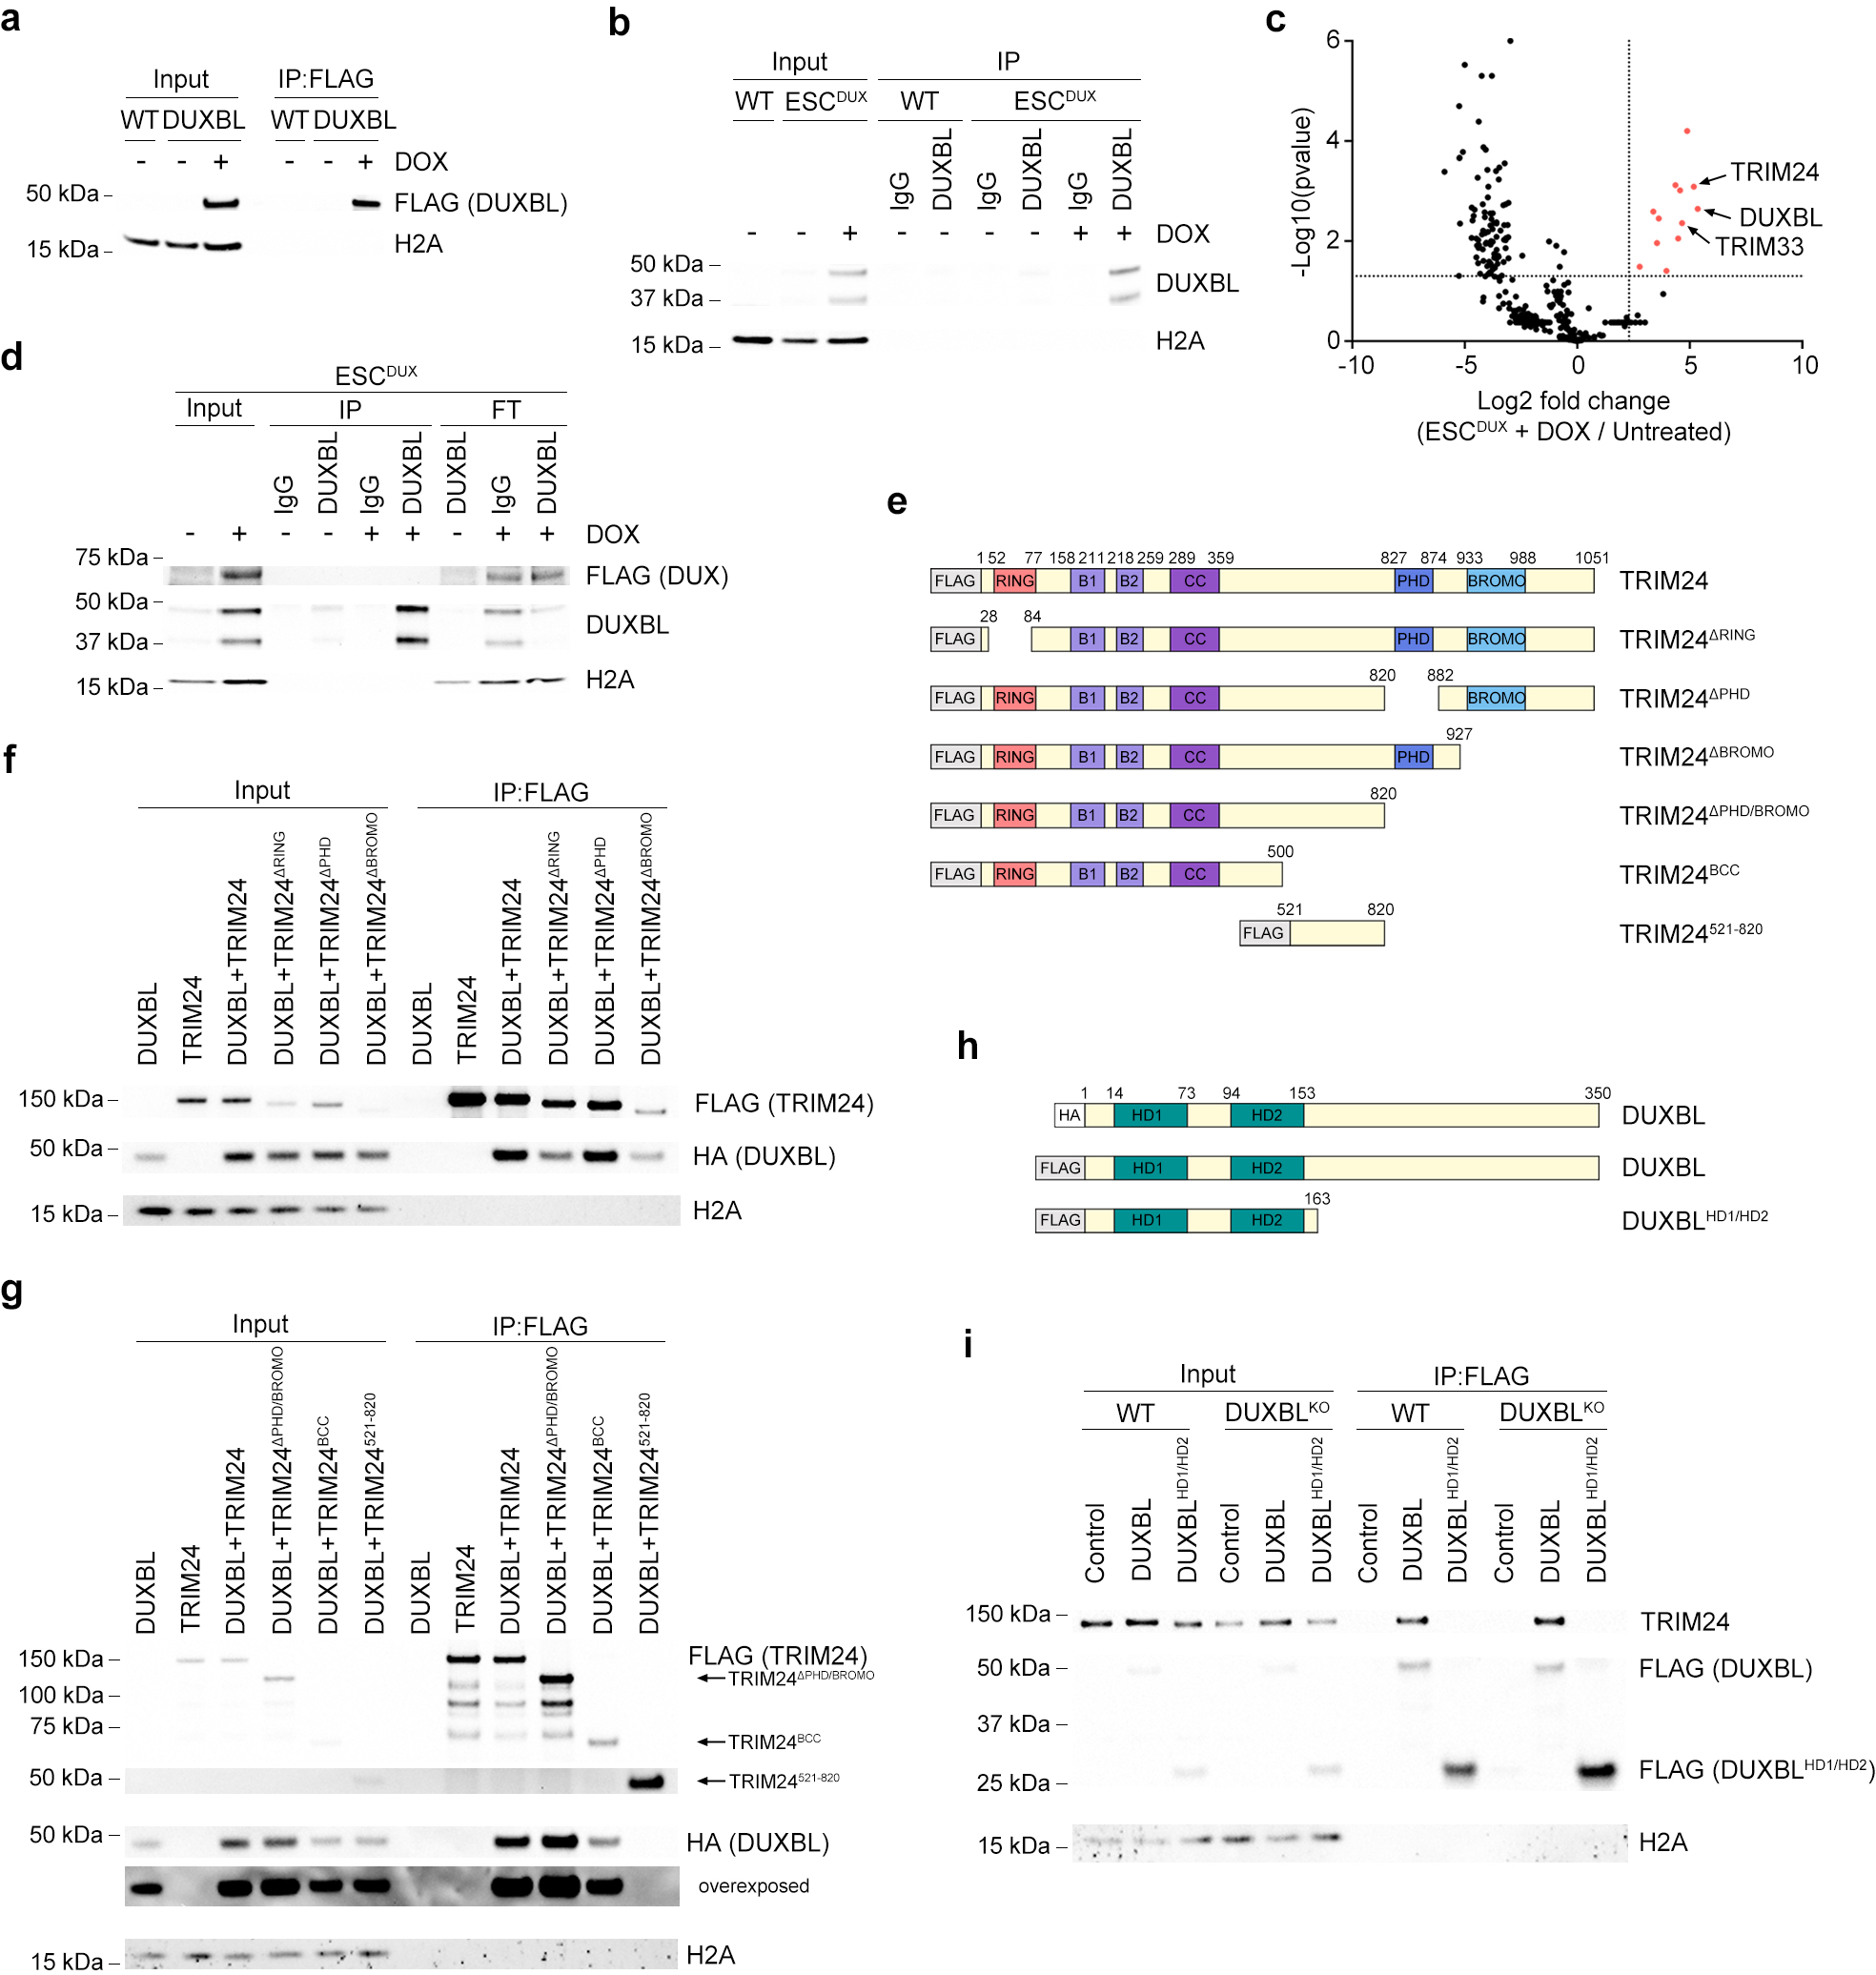
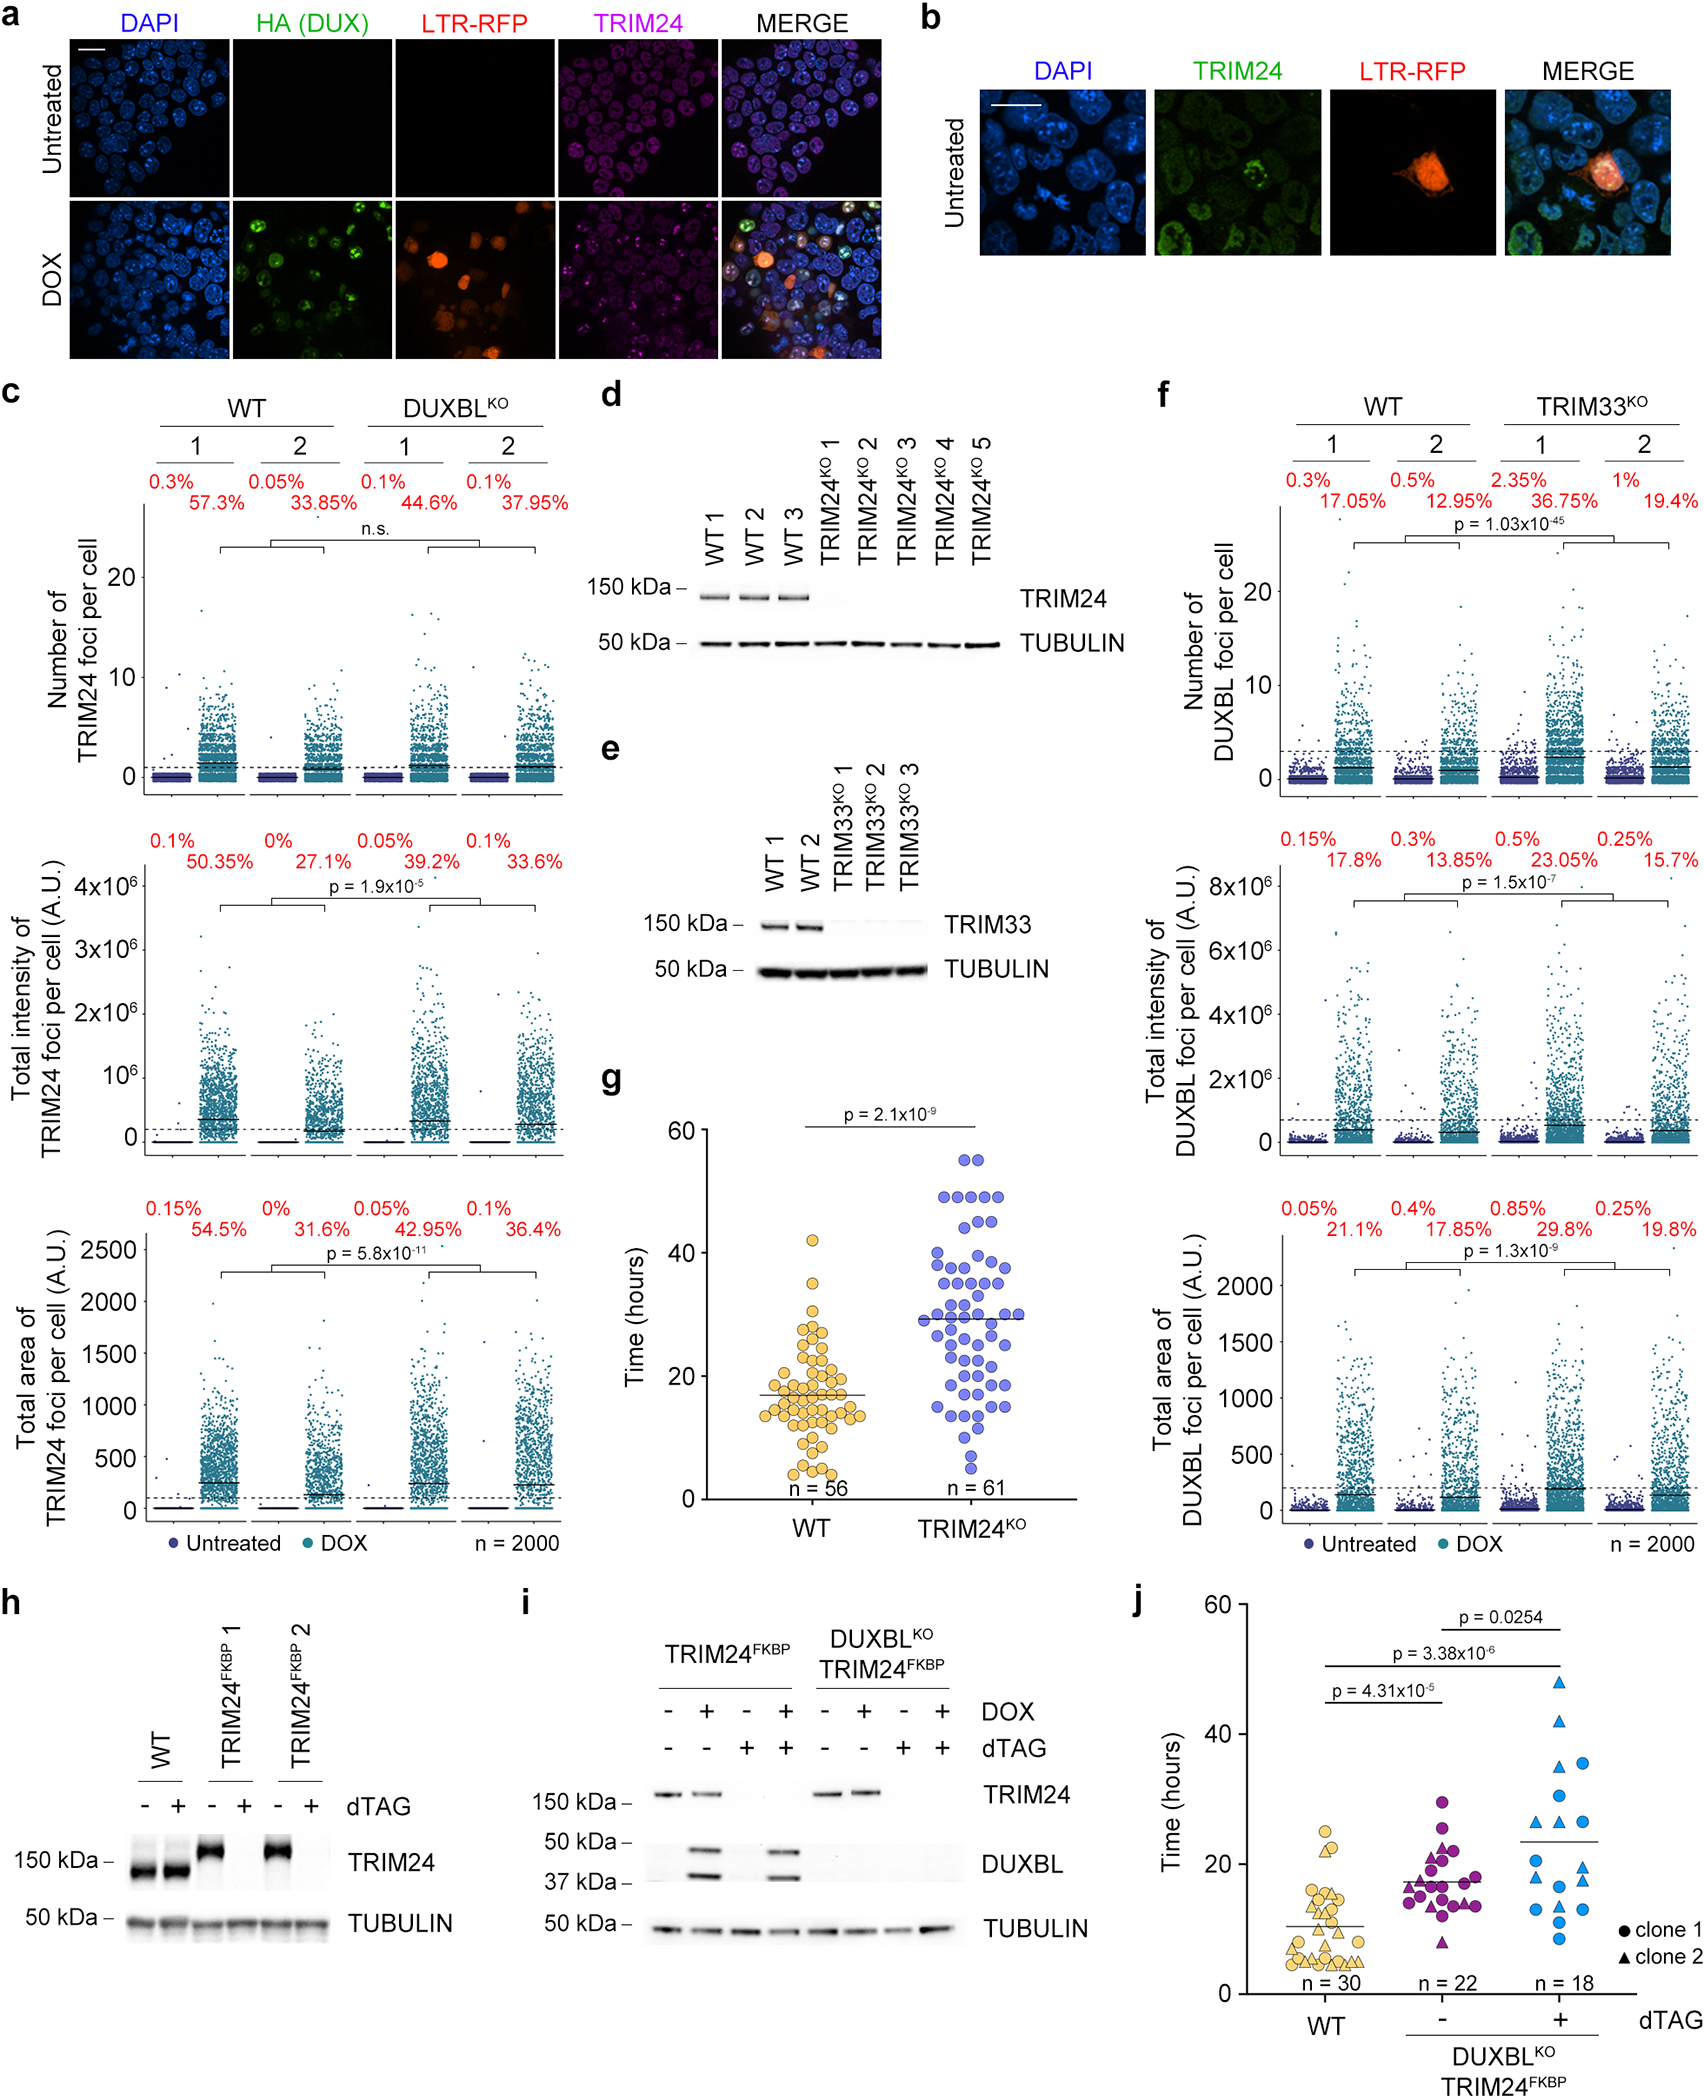
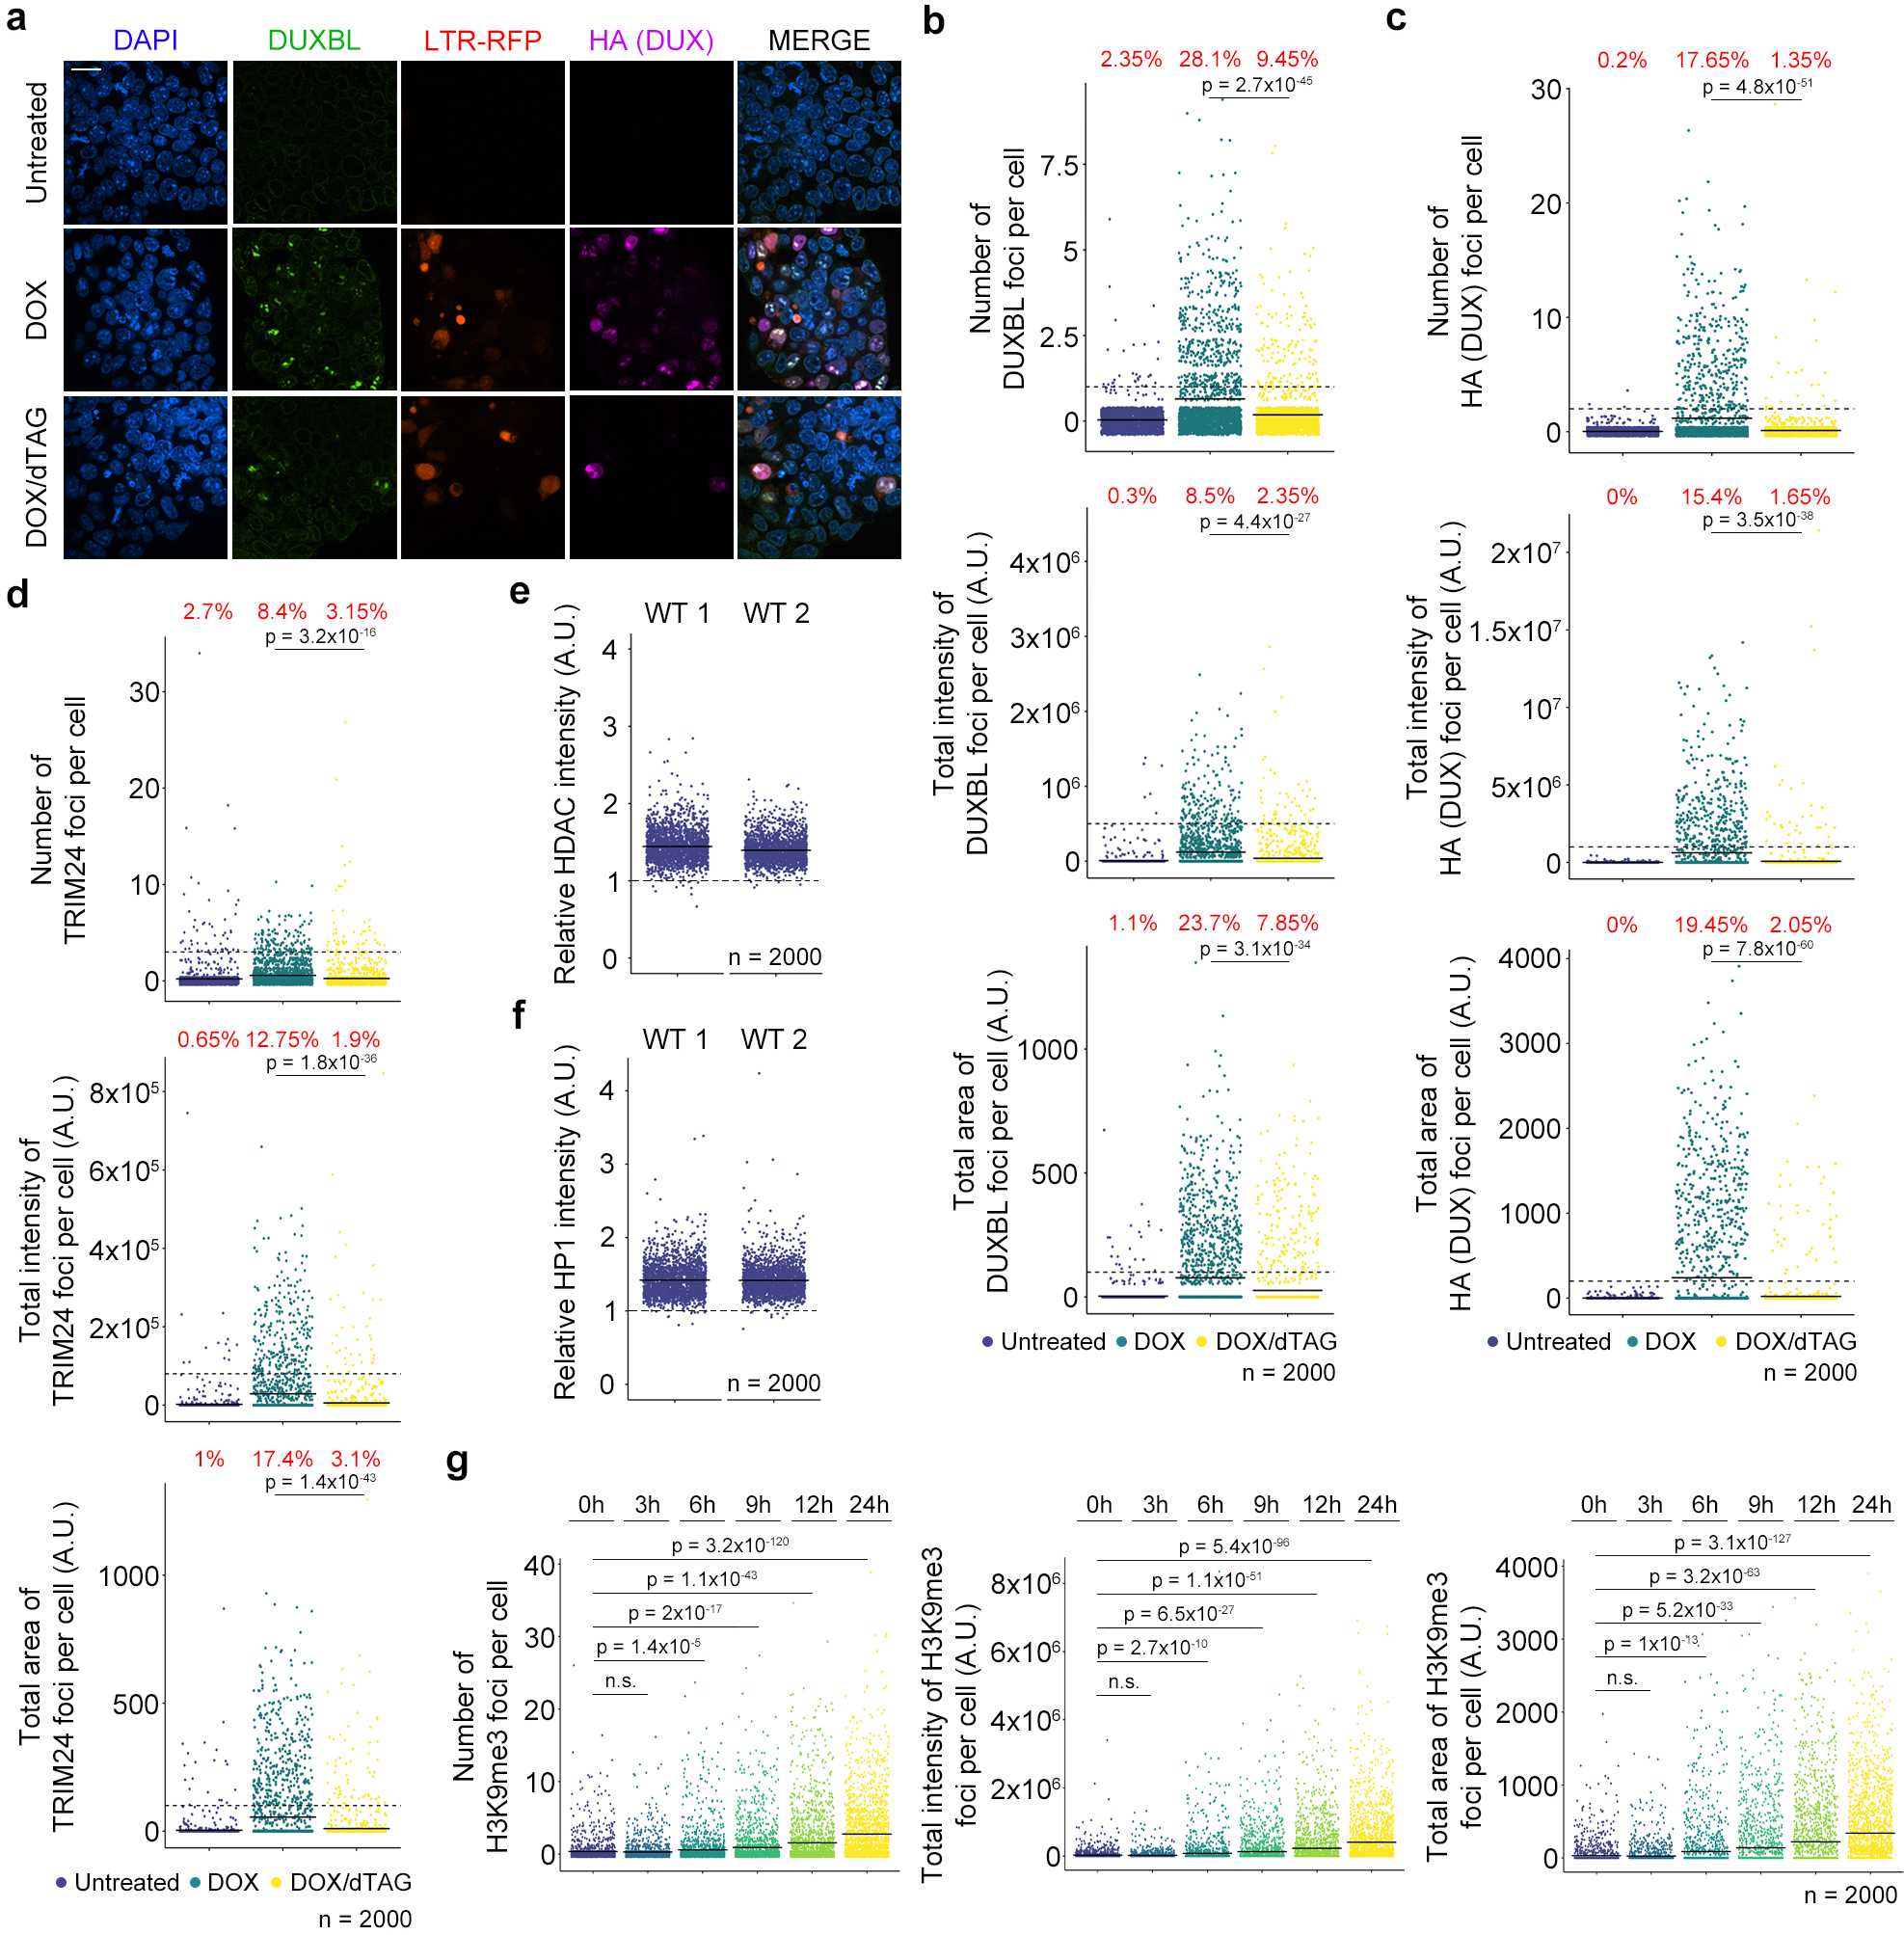
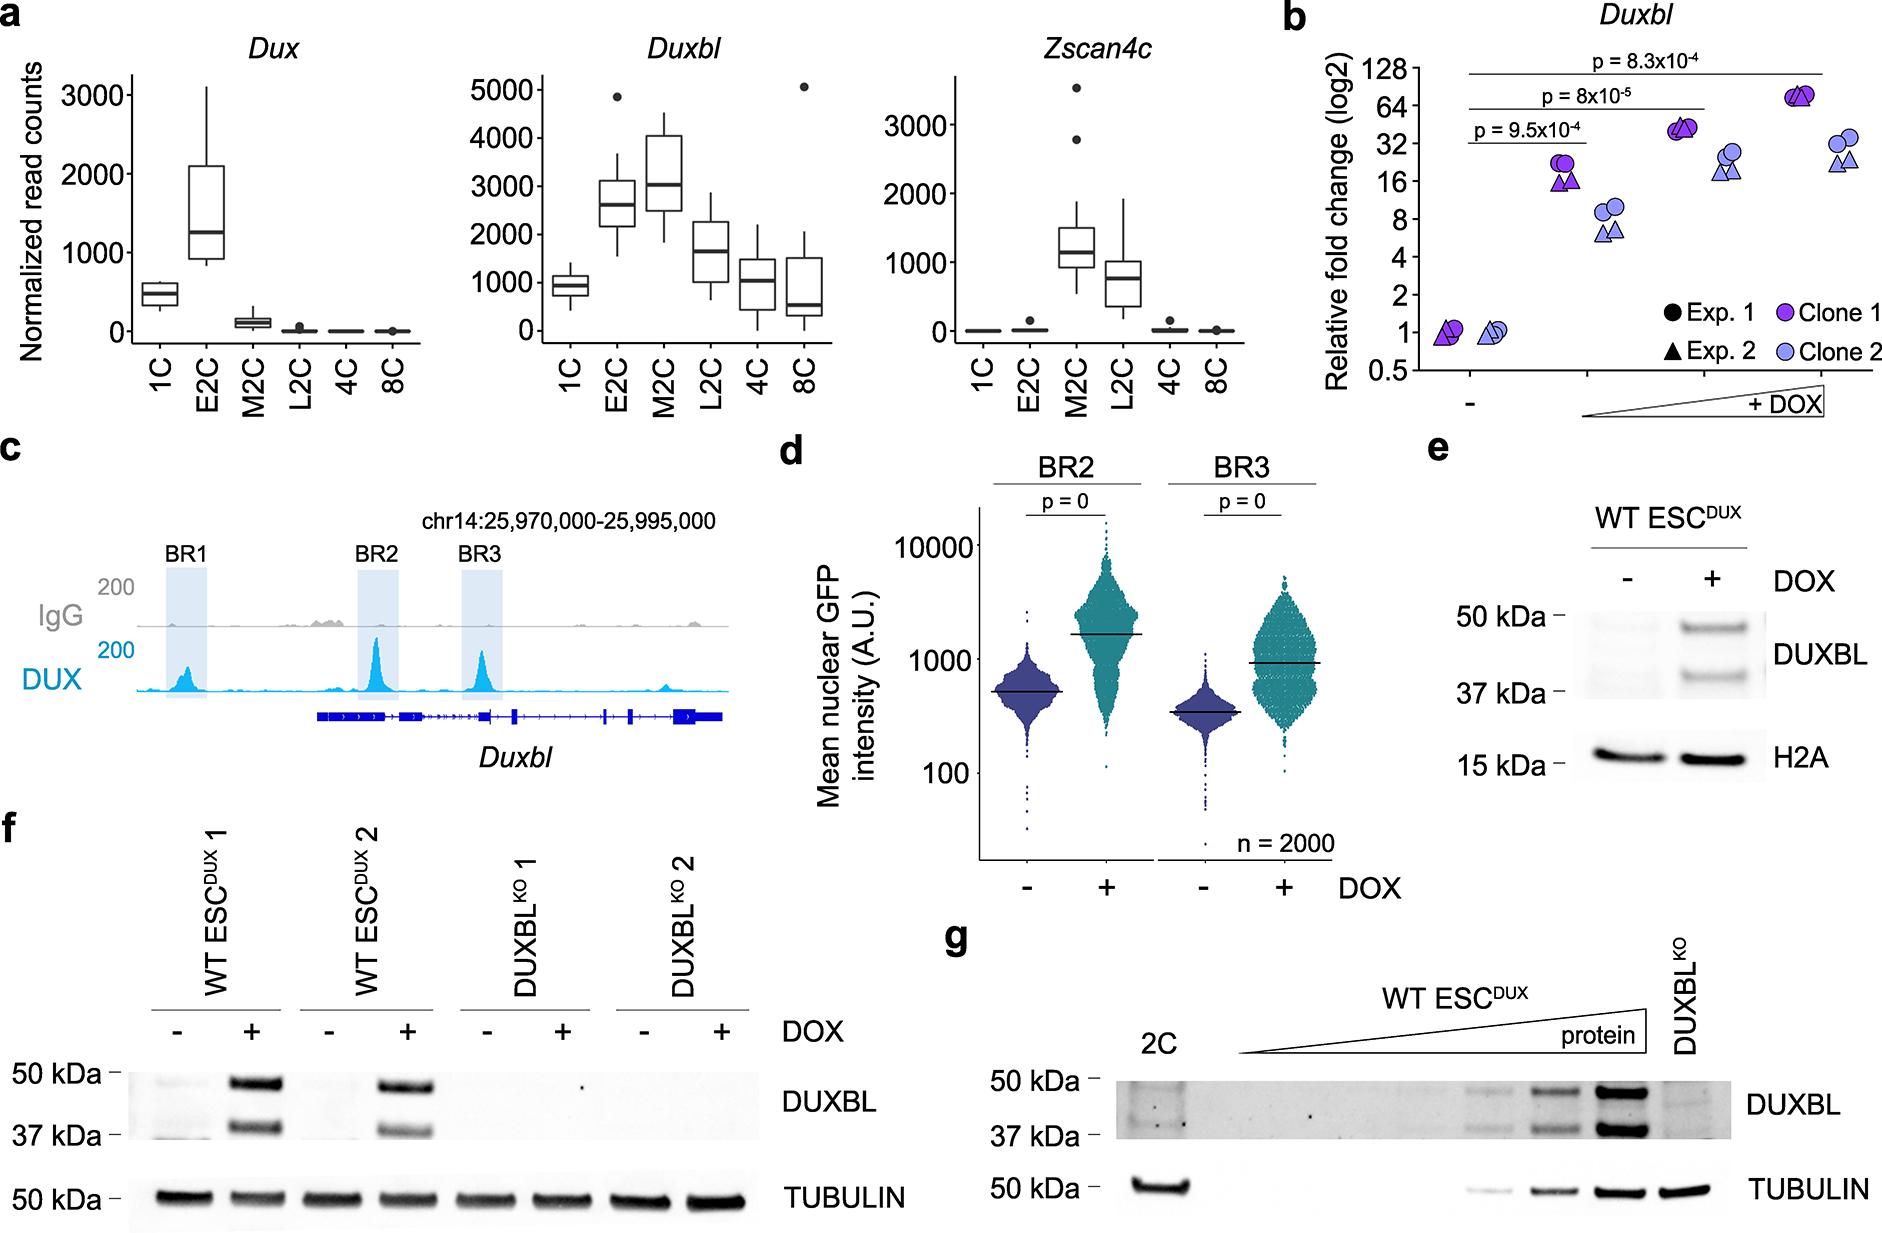
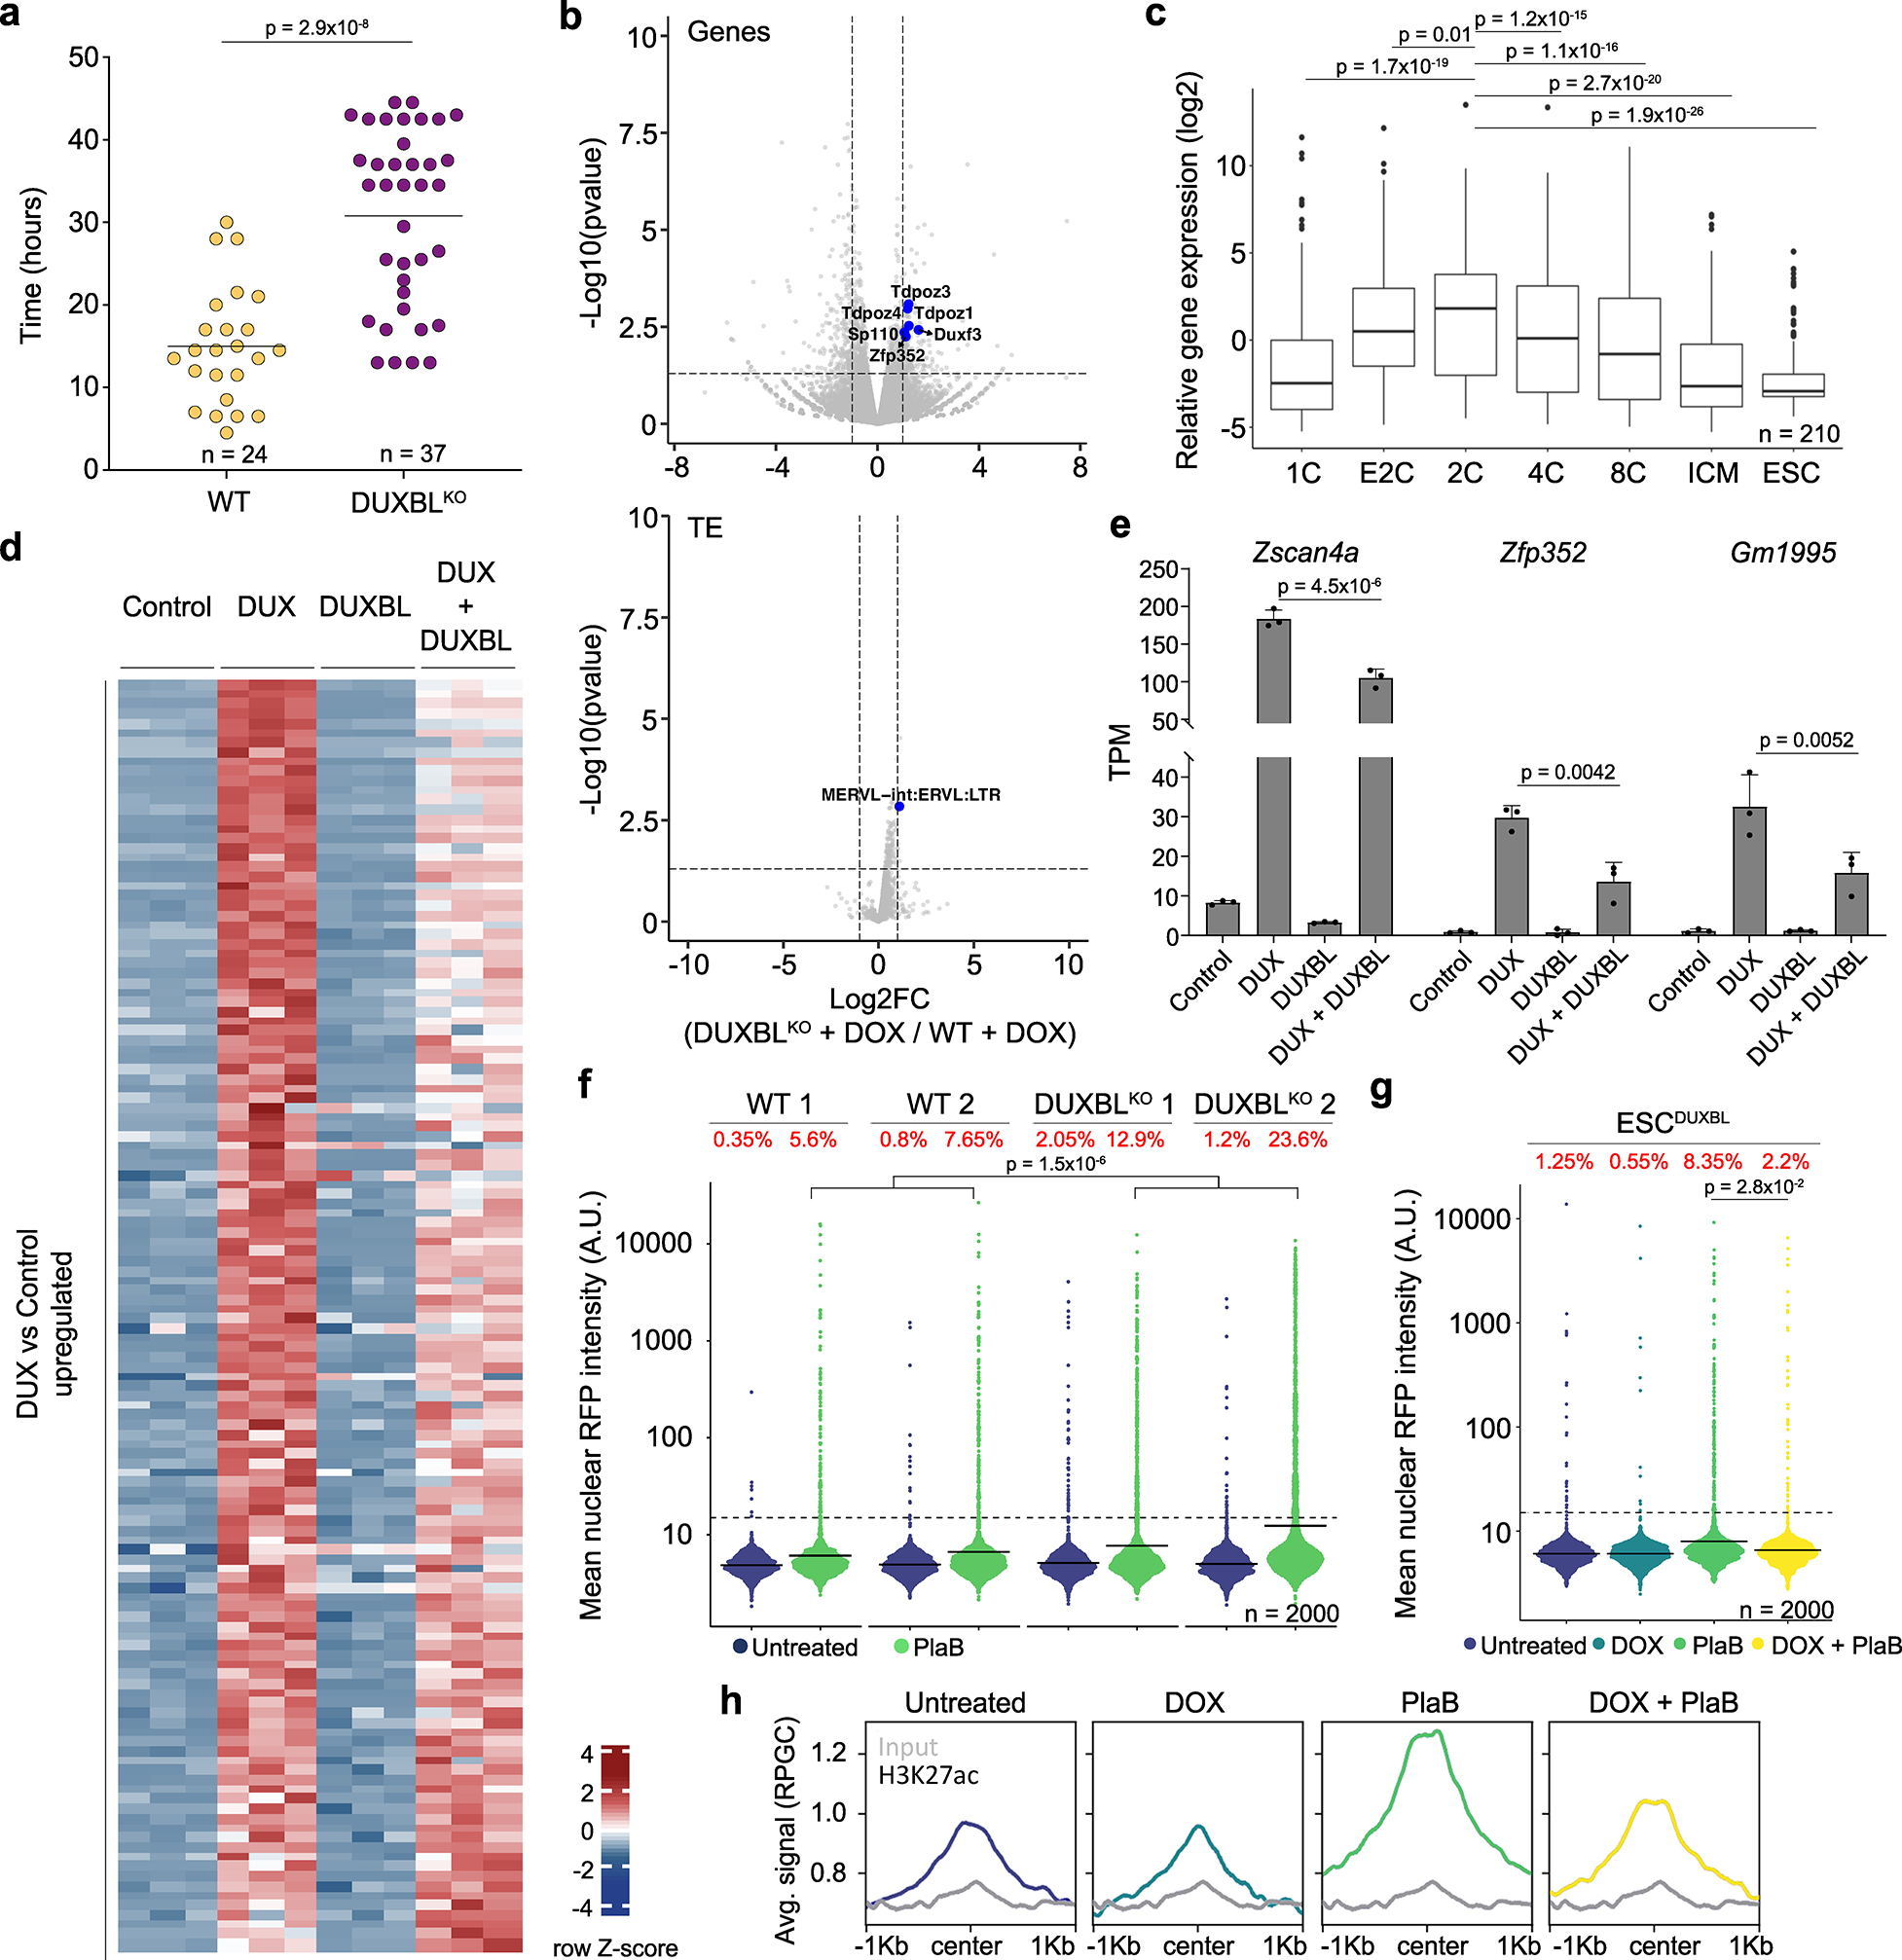
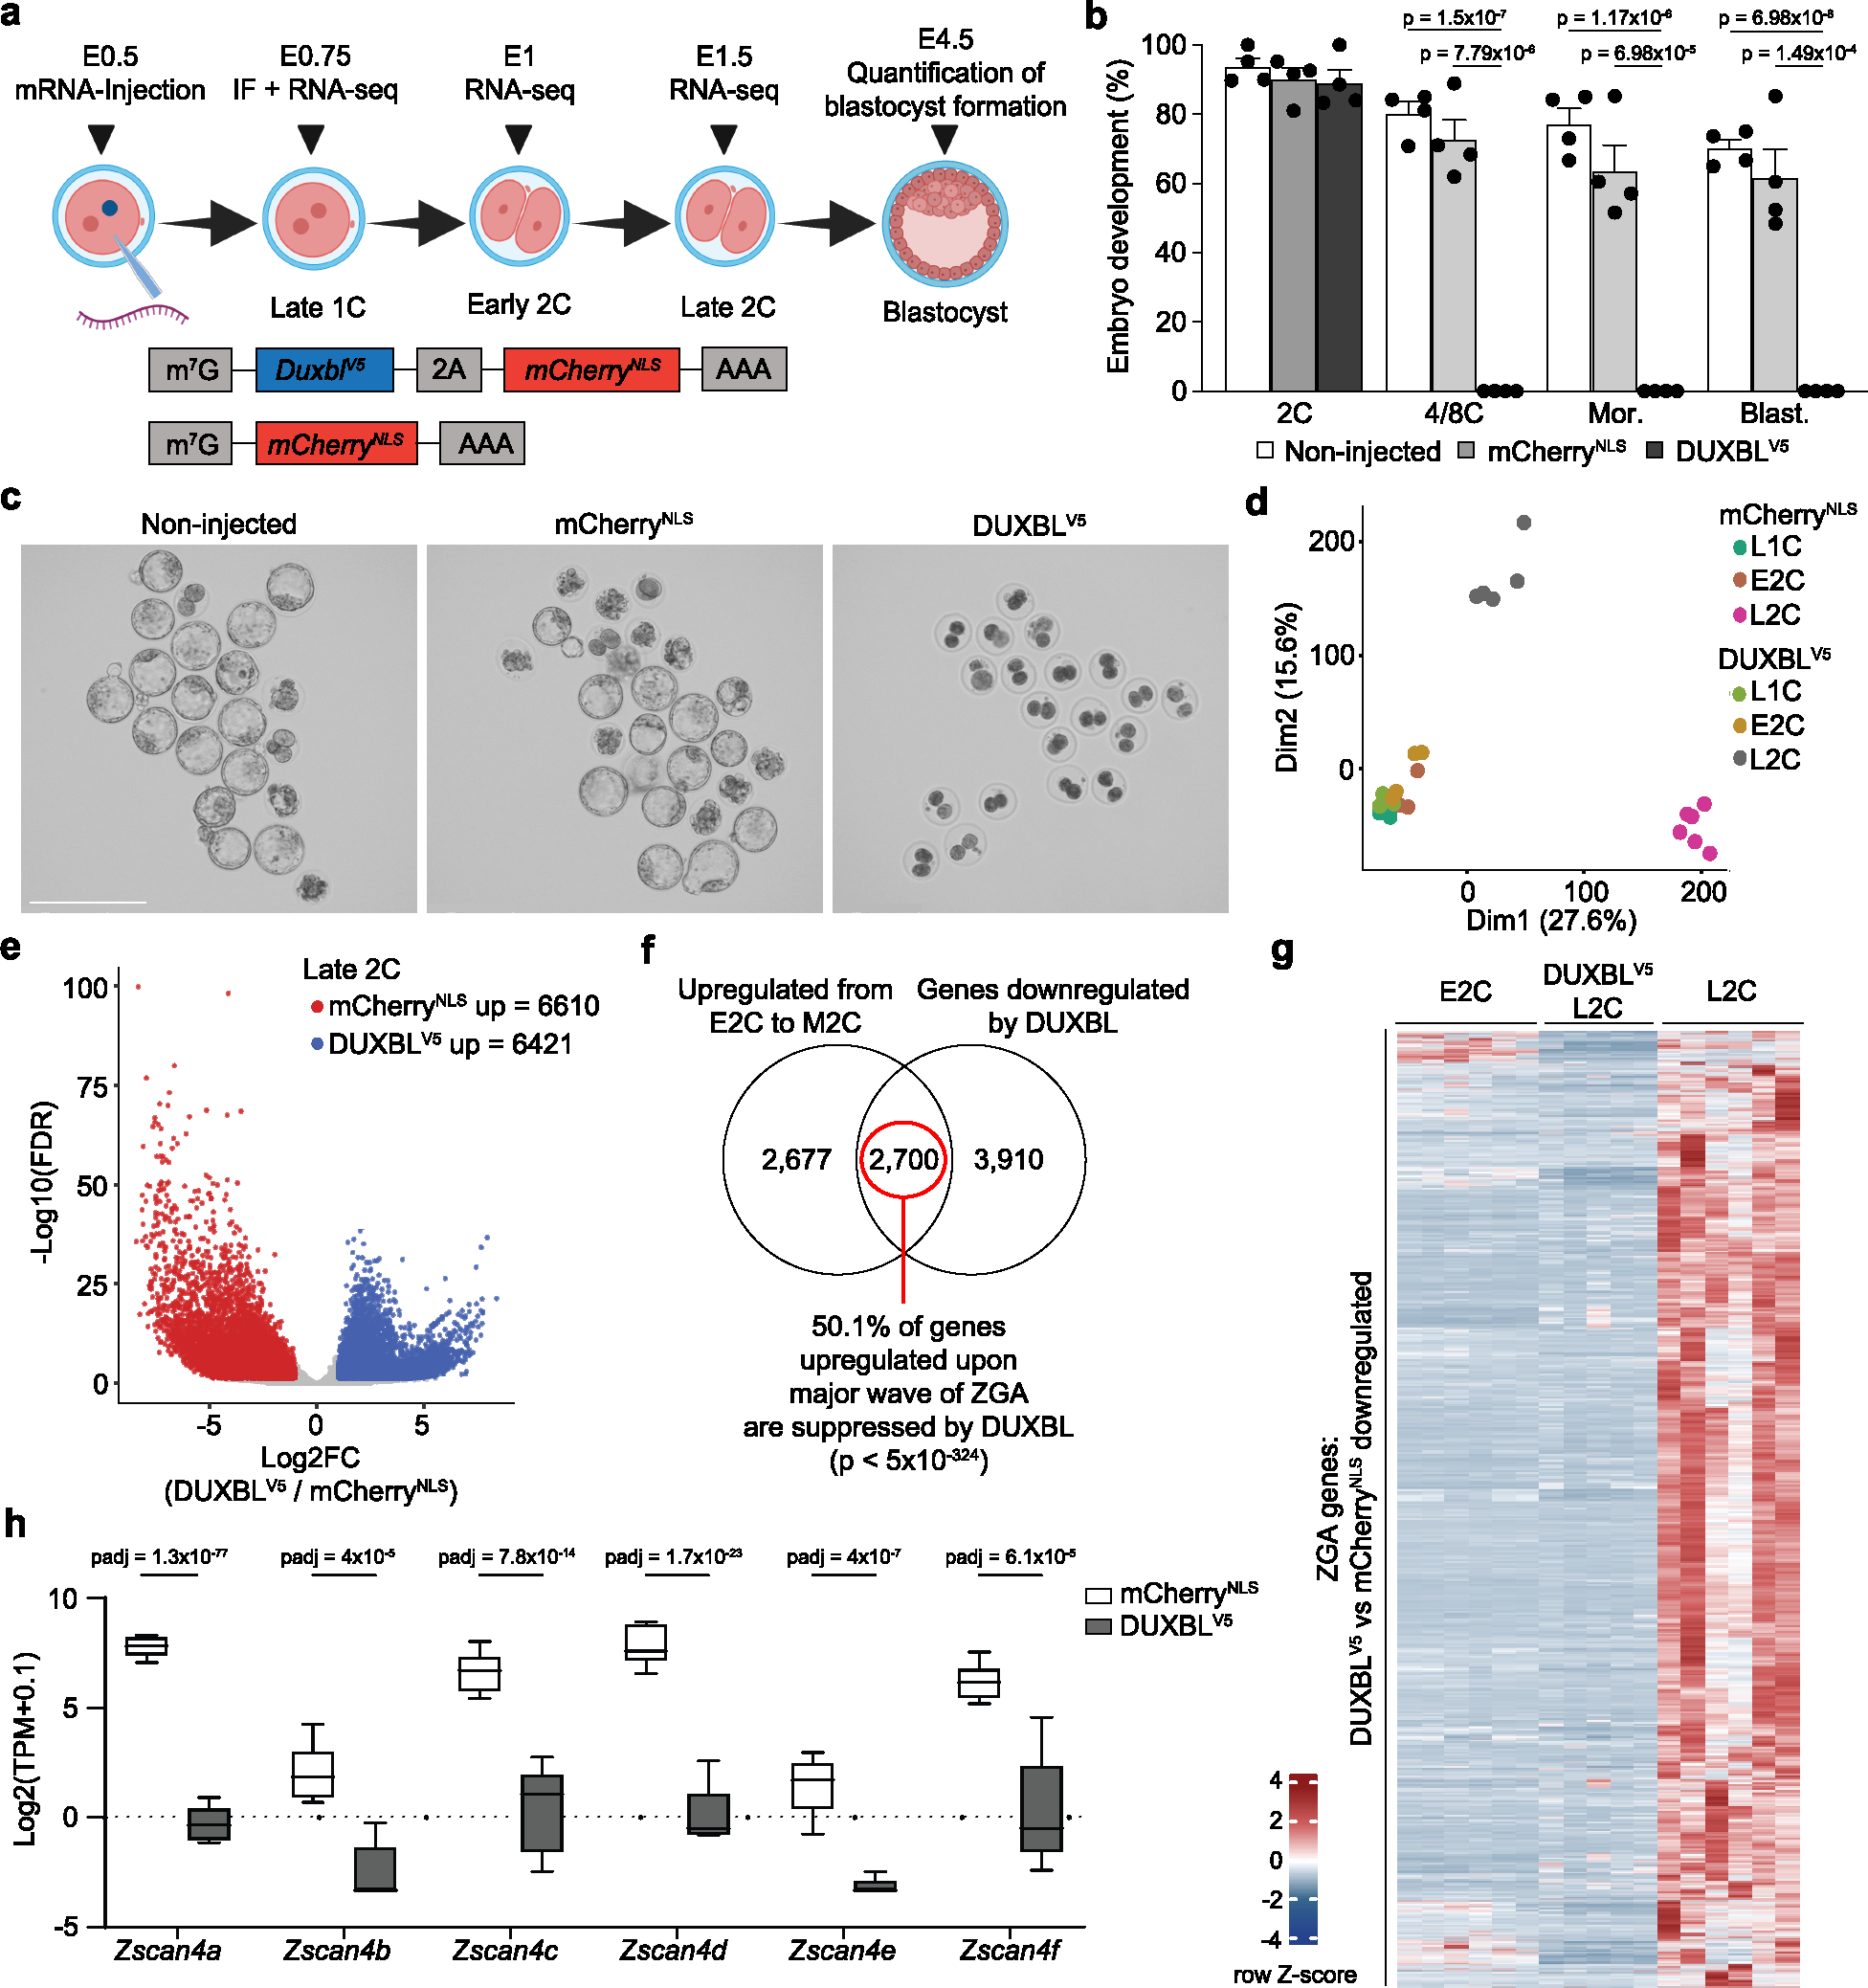
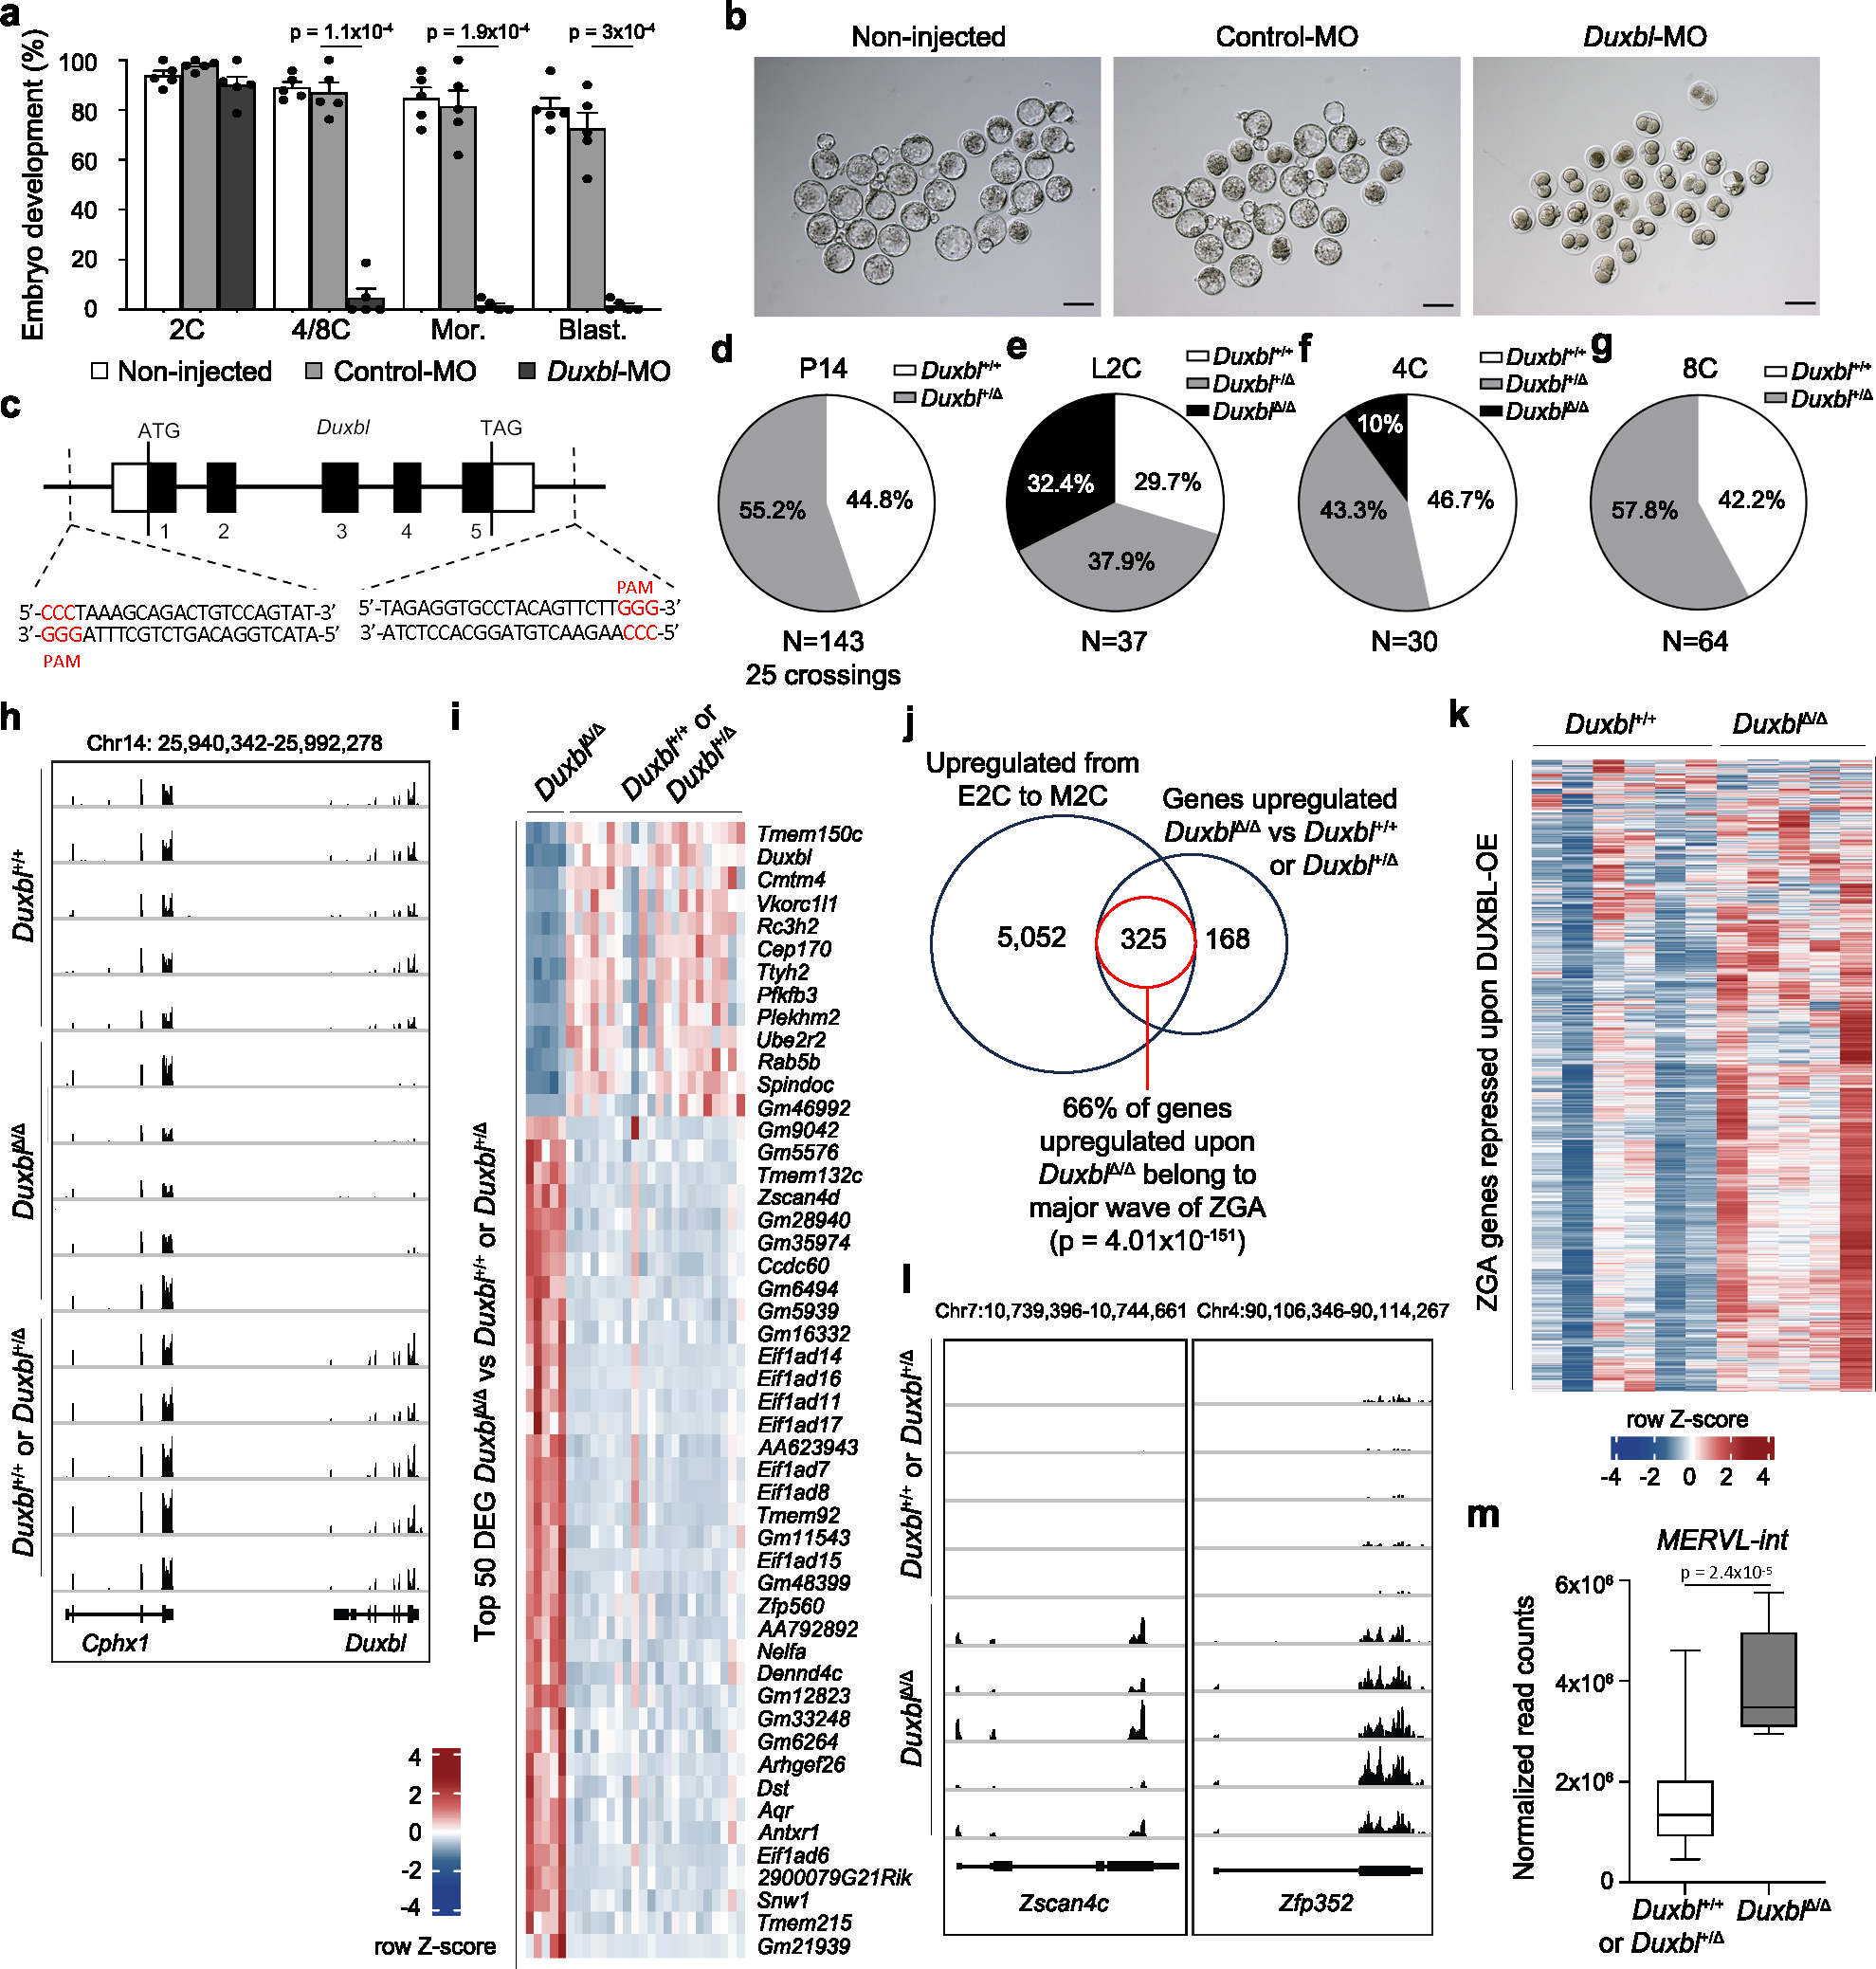
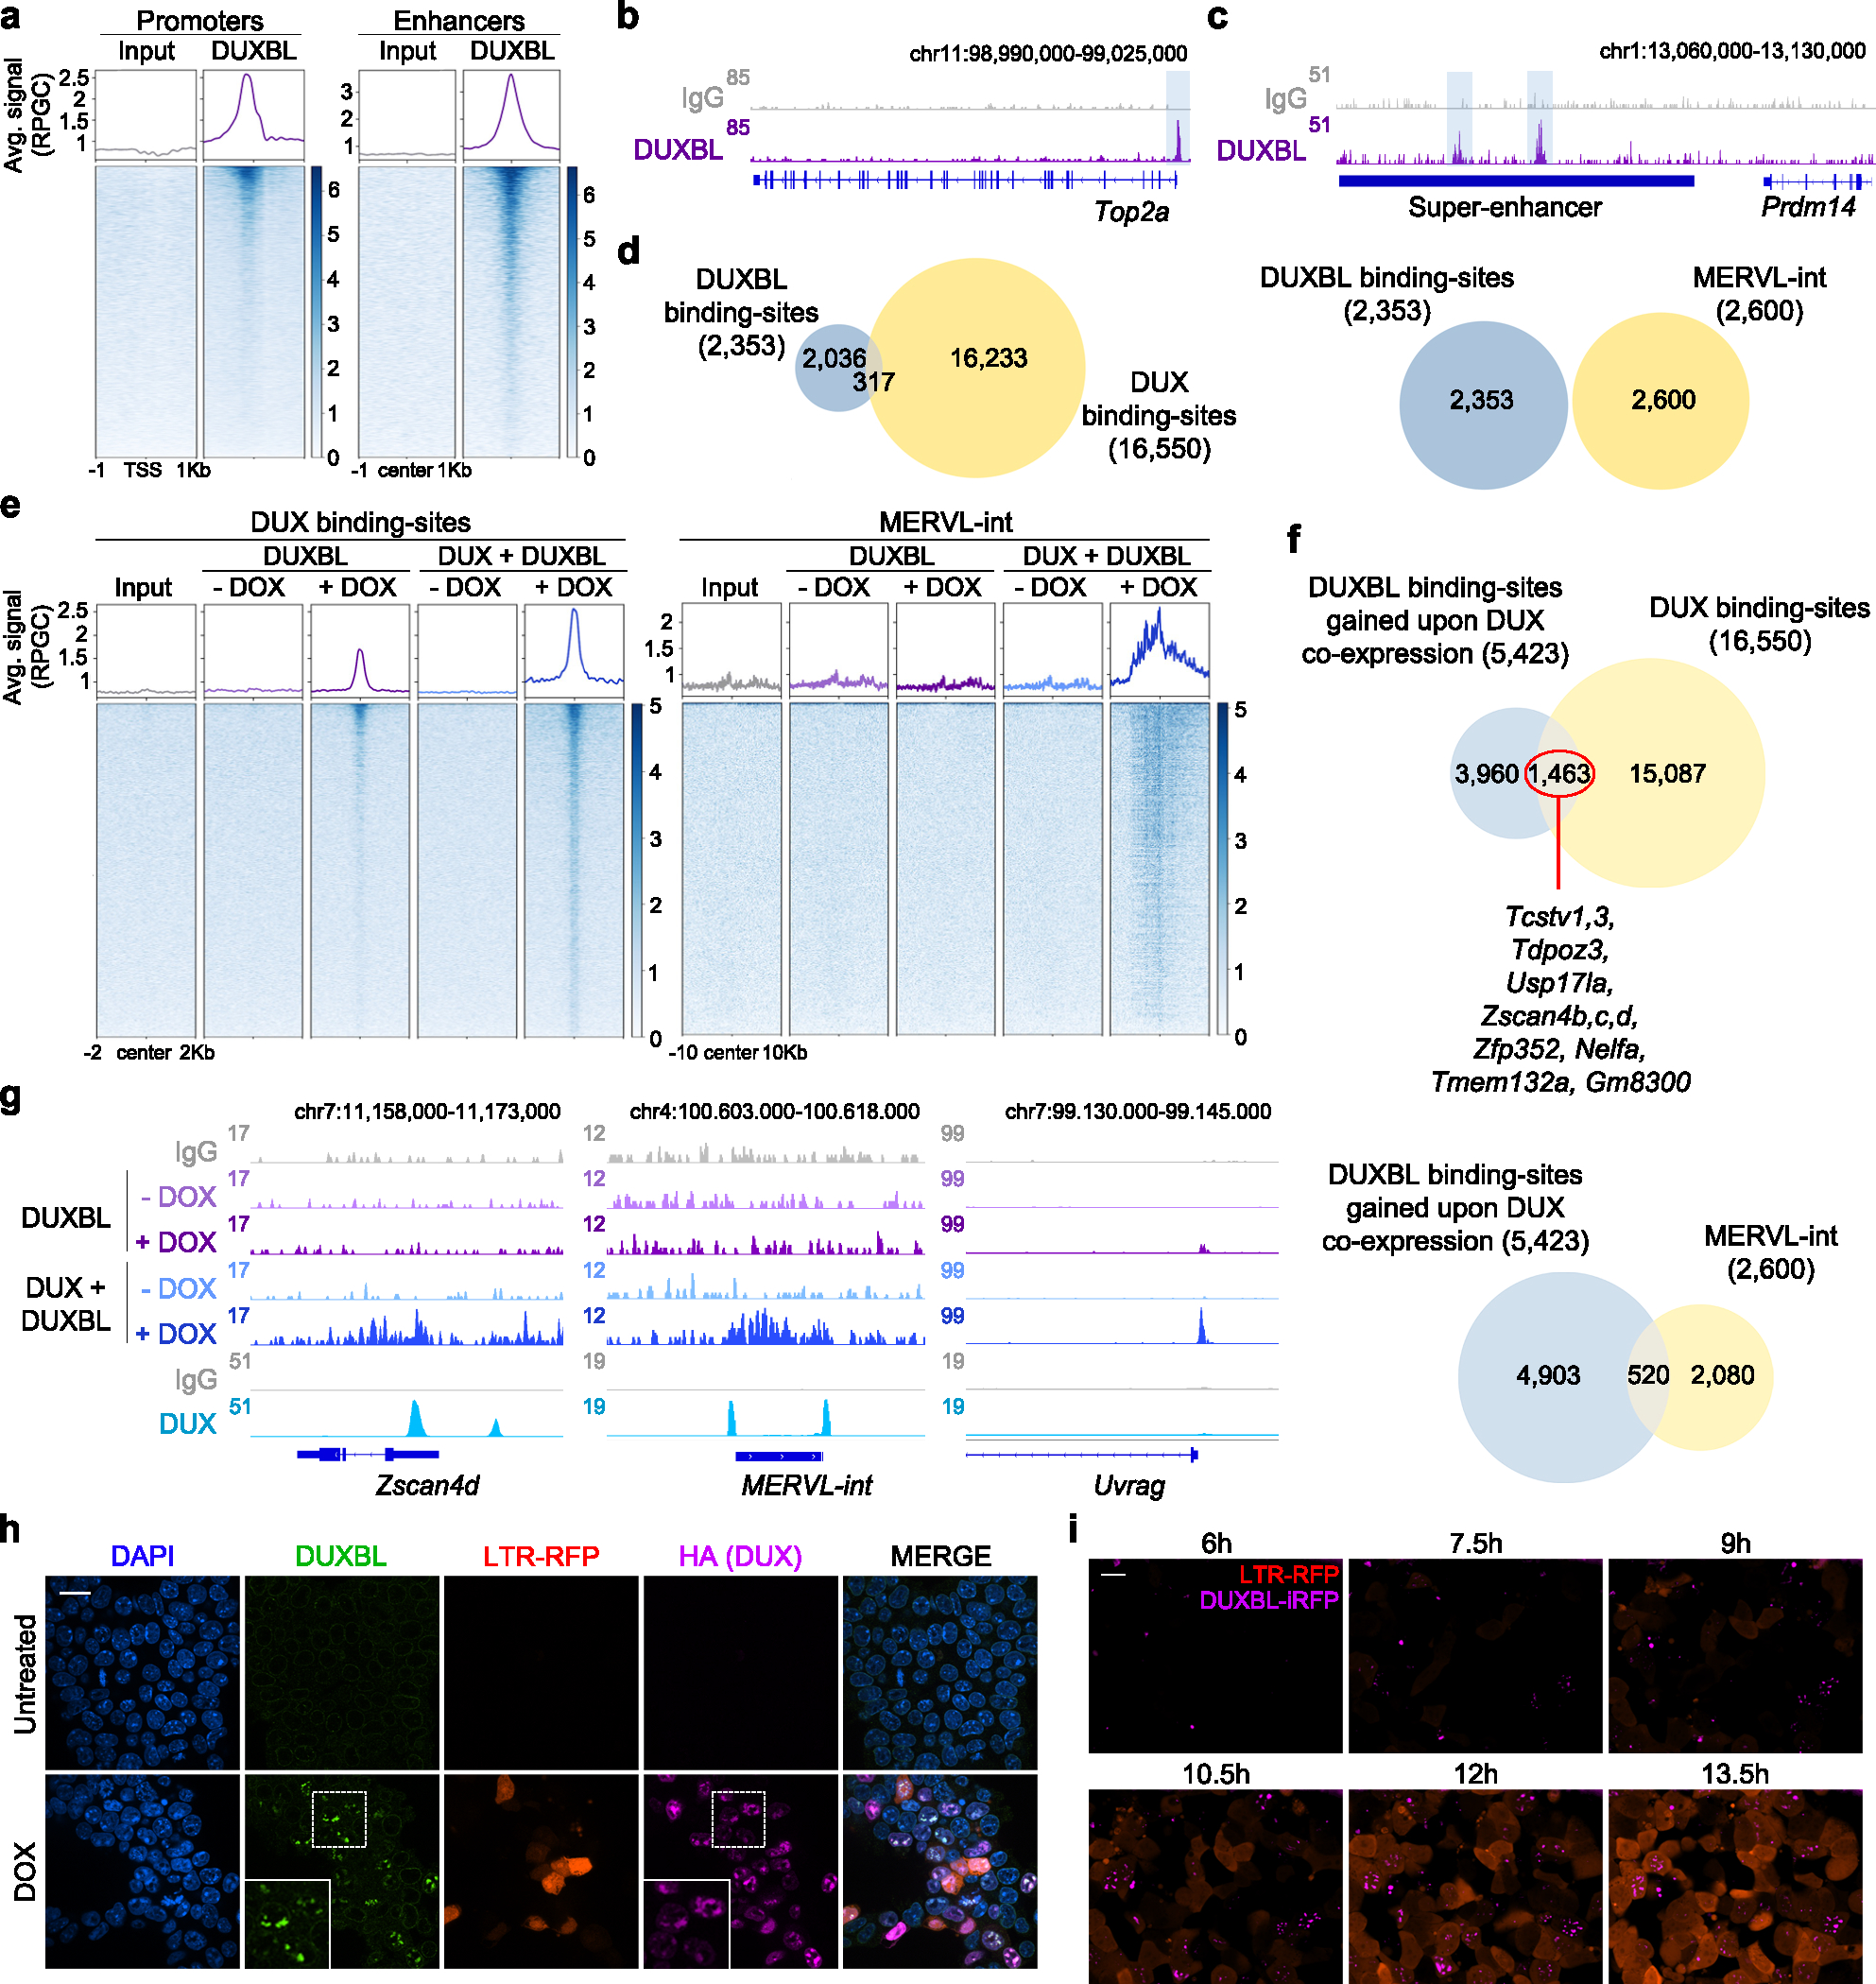
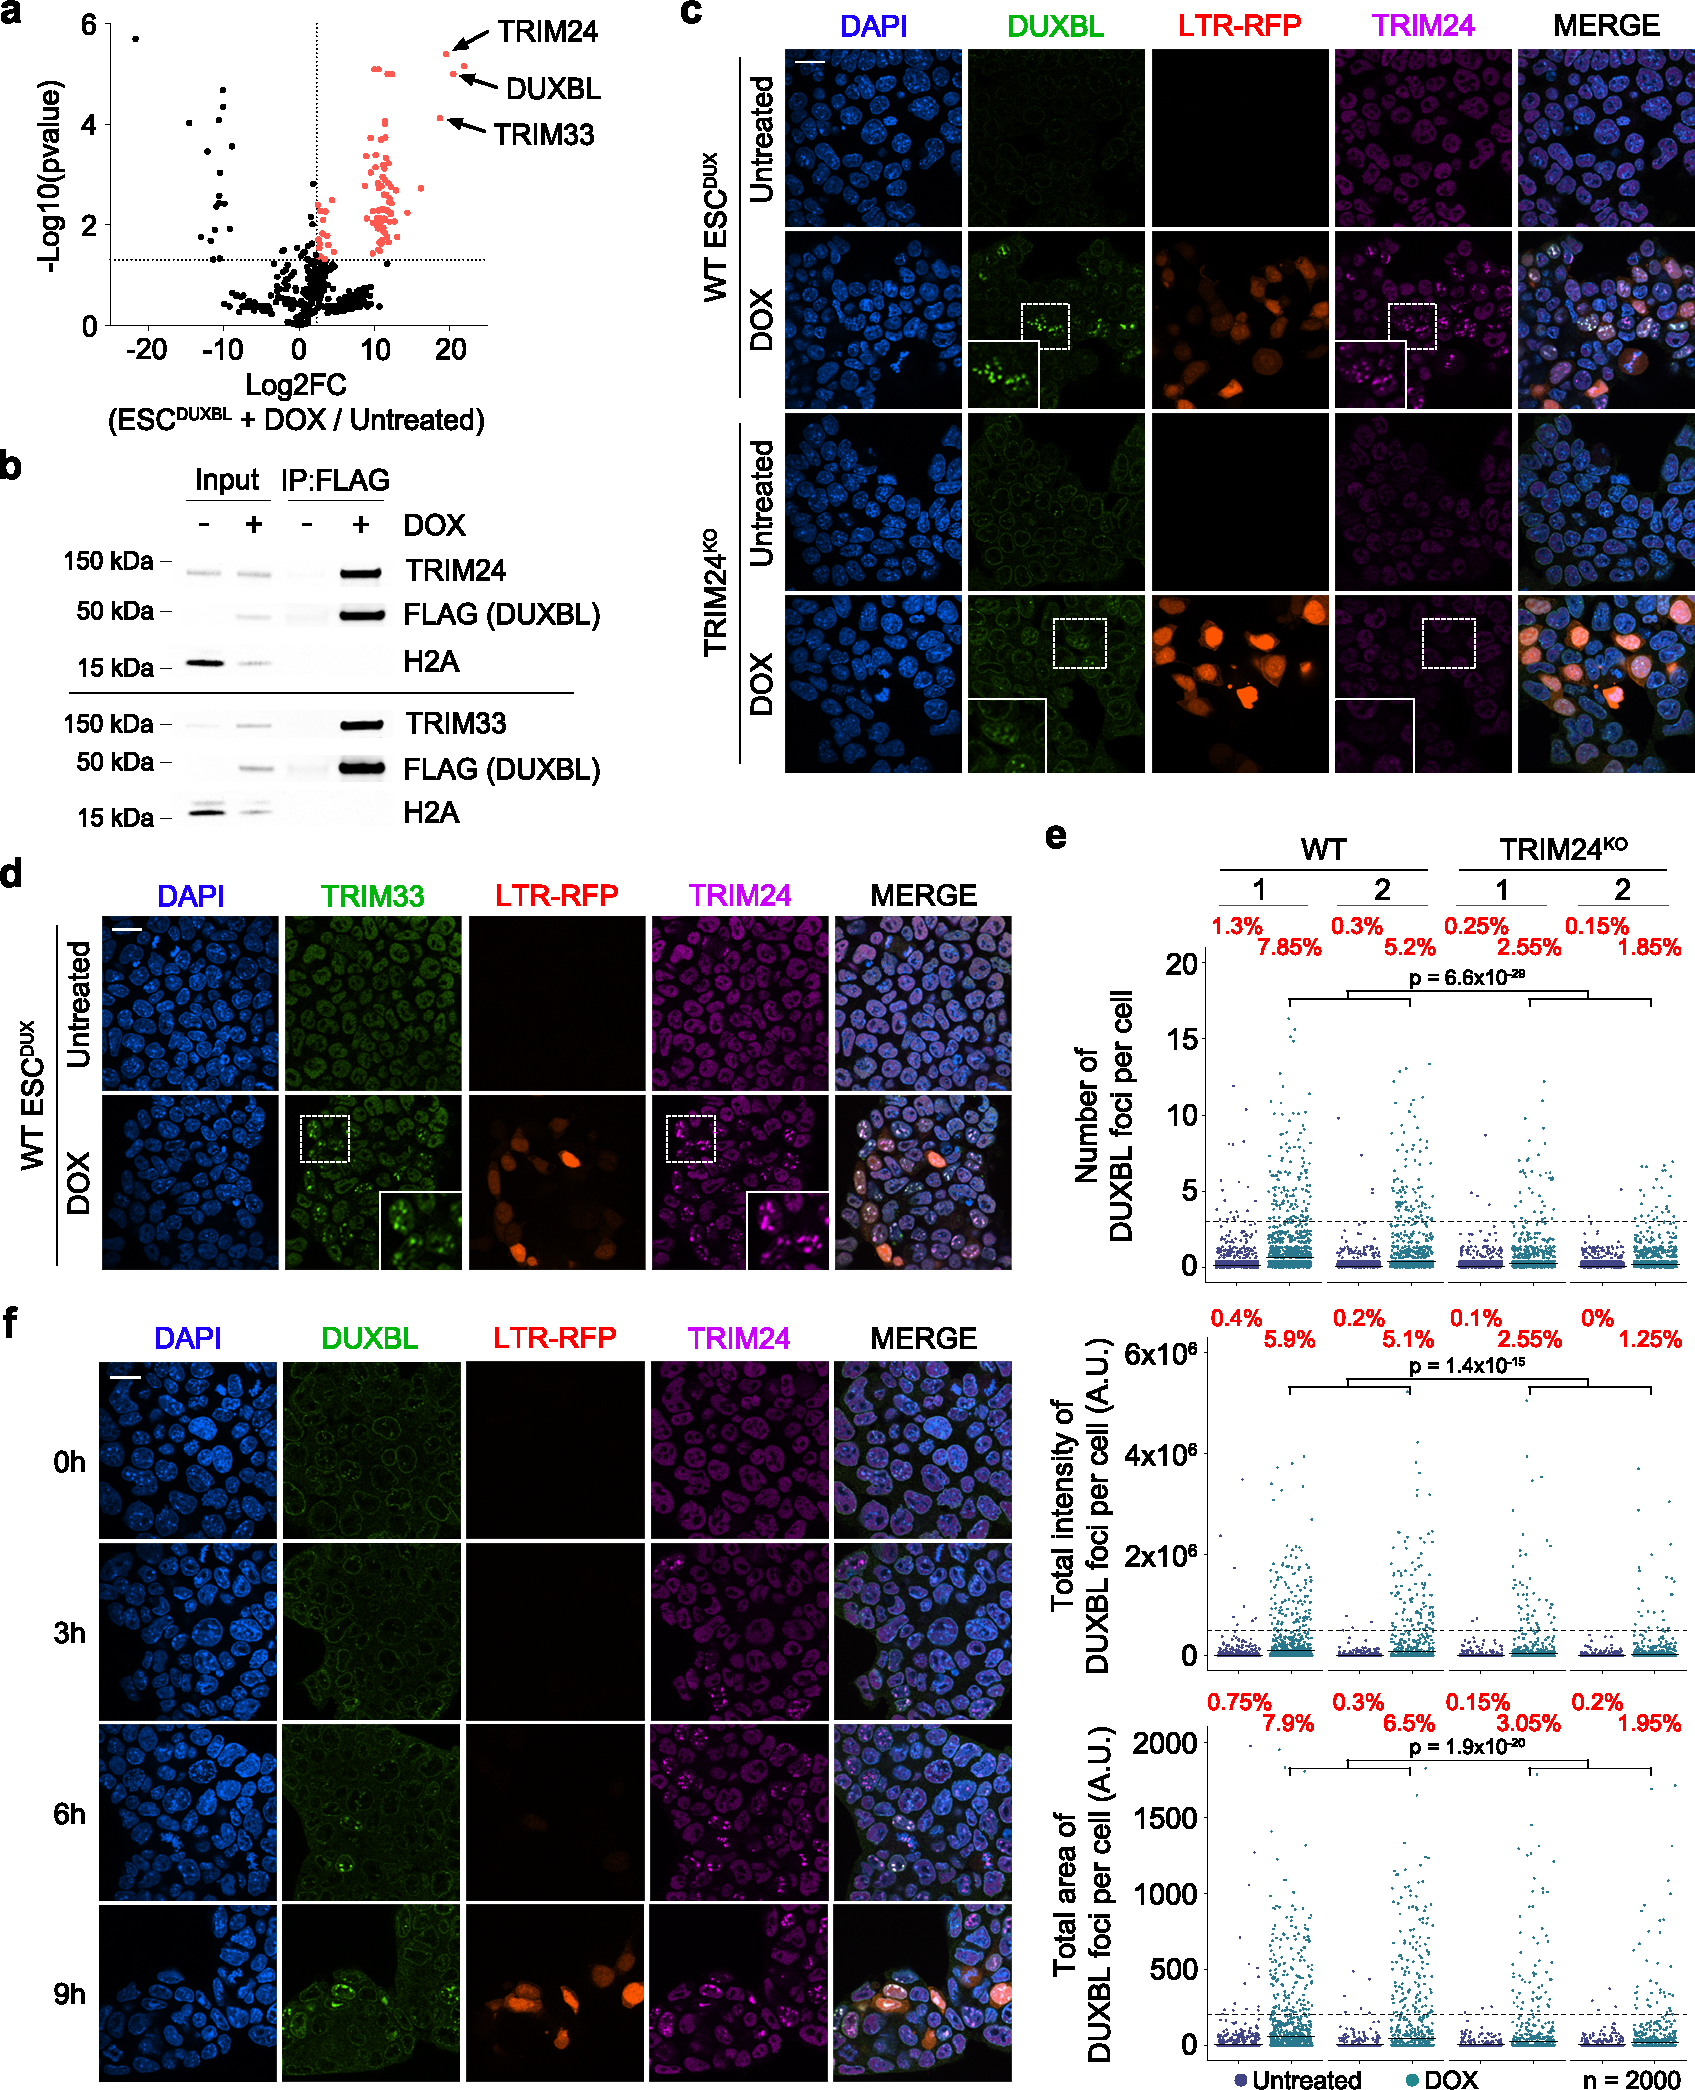
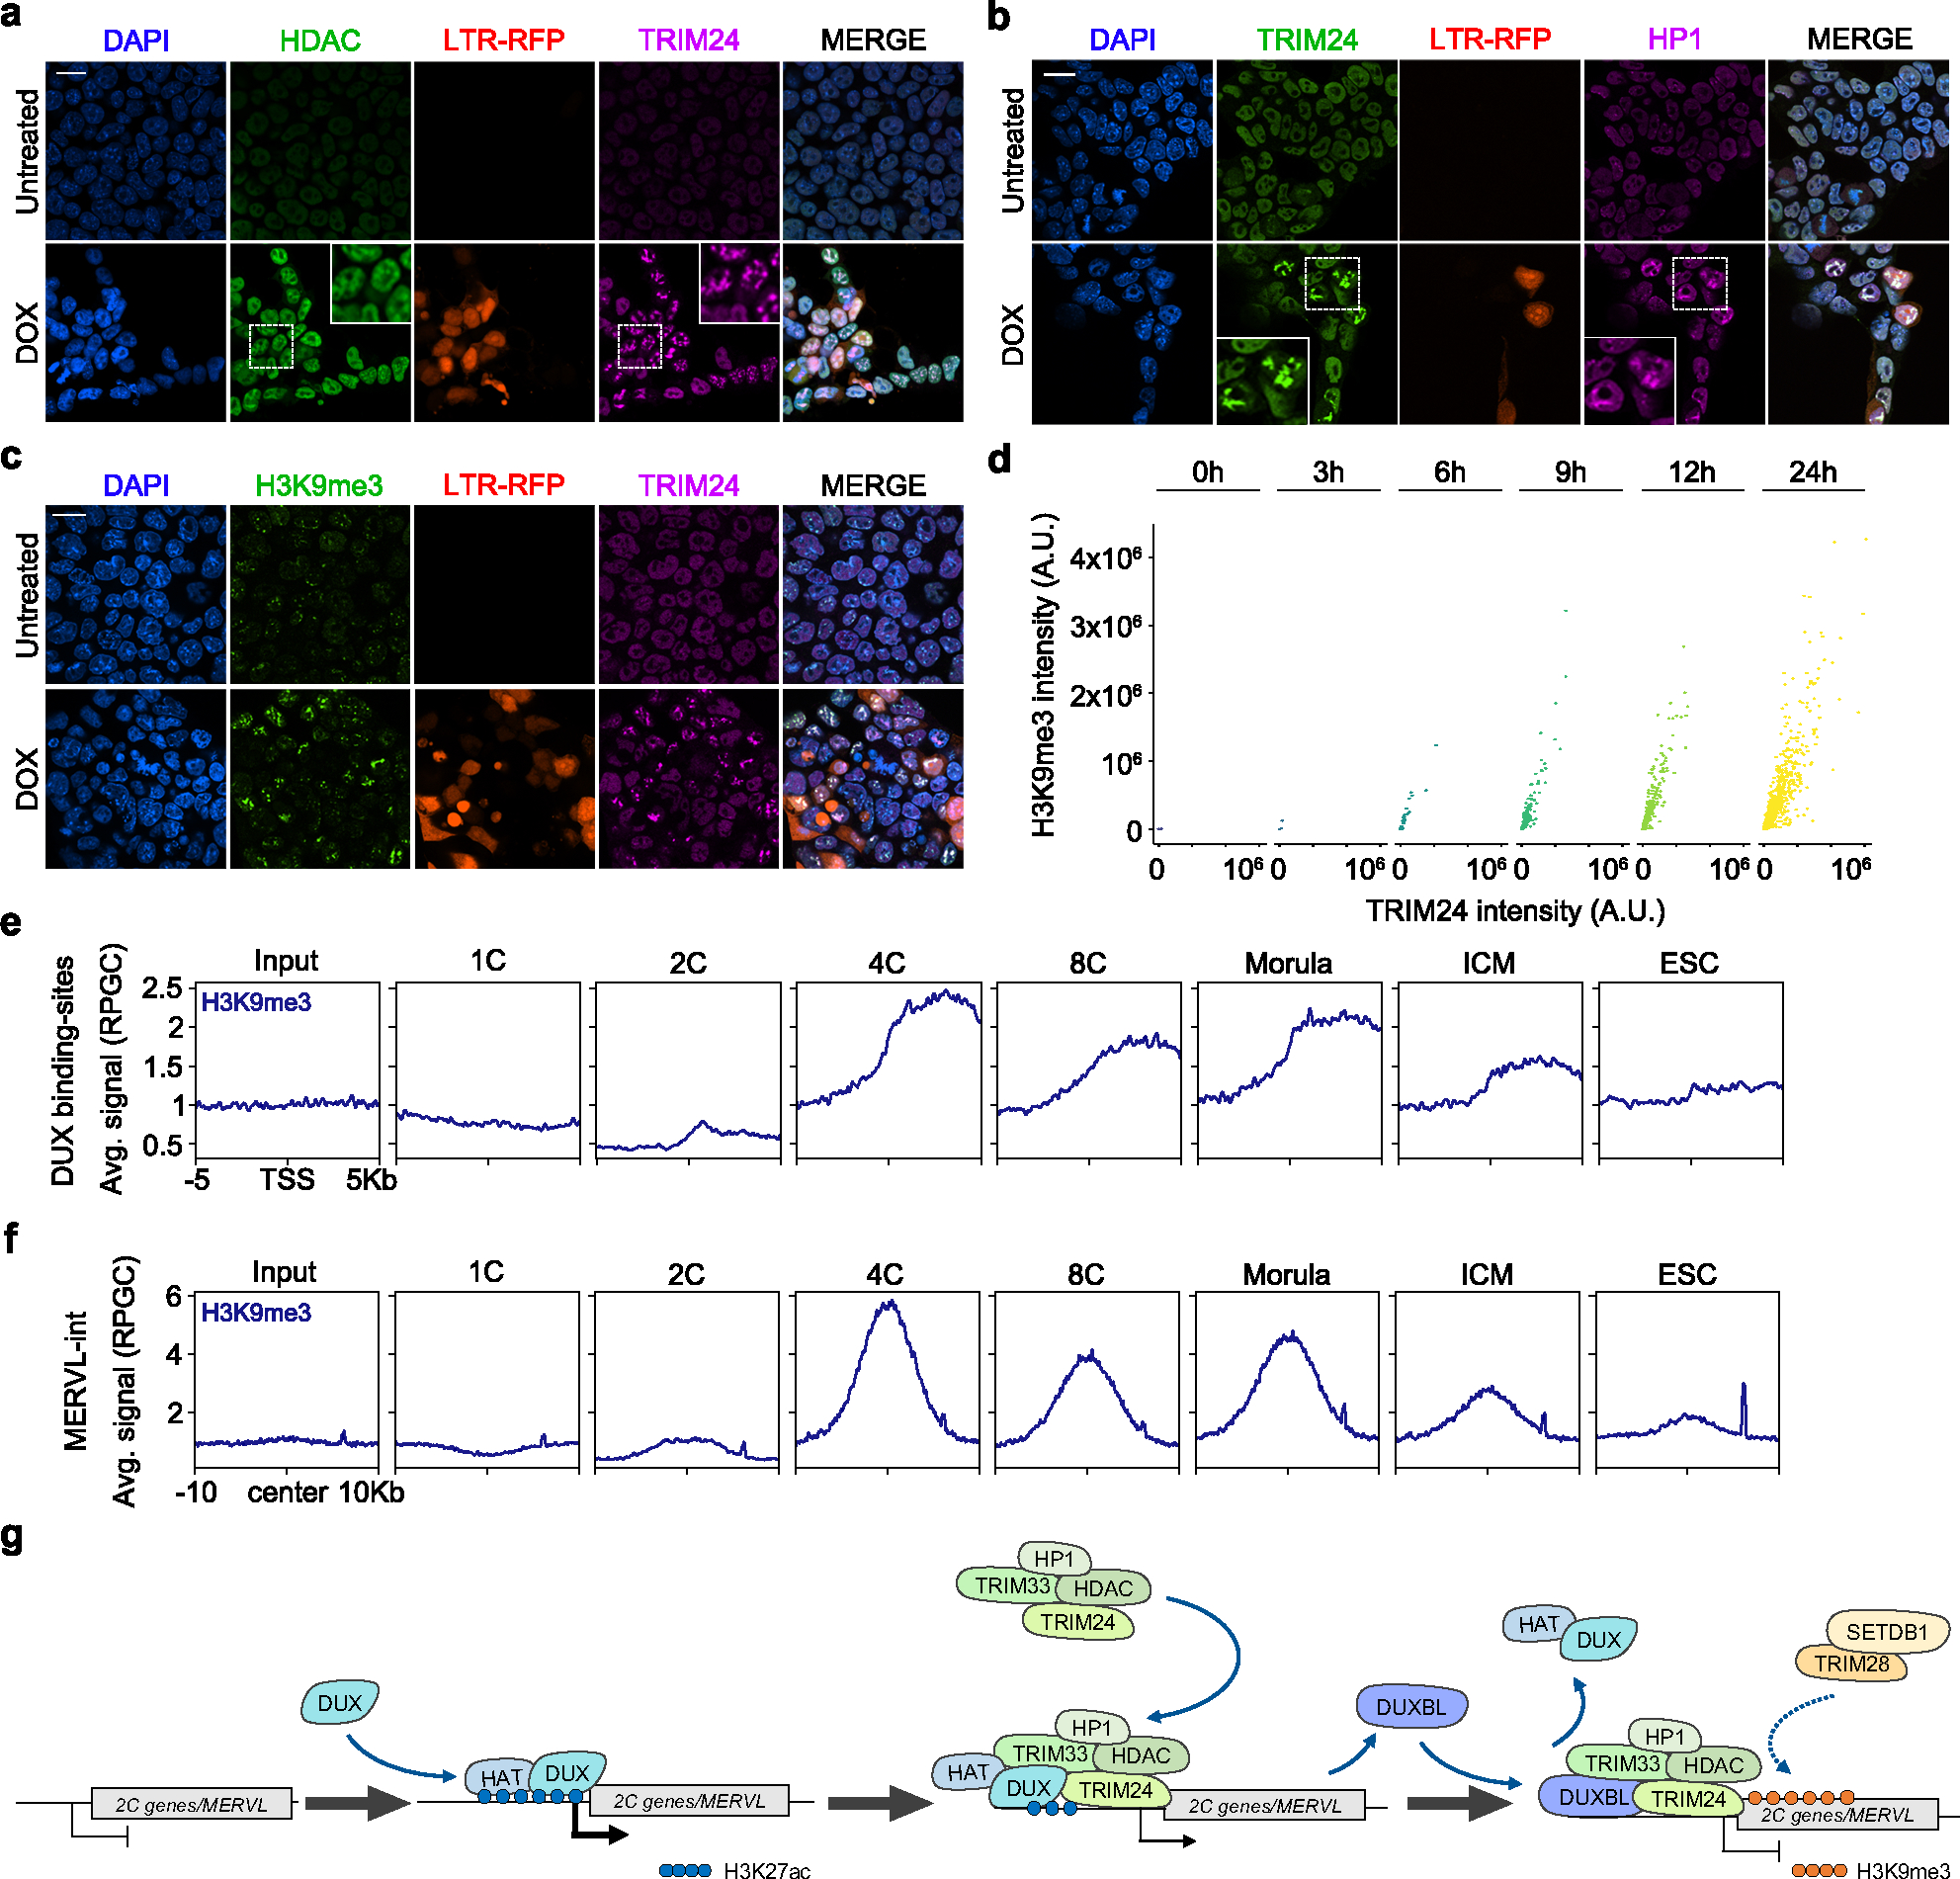
In mice, exit from the totipotent two-cell (2C) stage embryo requires silencing of the 2C-associated transcriptional program. However, the molecular mechanisms involved in this process remain poorly understood. Here we demonstrate that the 2C-specific transcription factor double homeobox protein (DUX) mediates an essential negative feedback loop by inducing the expression of DUXBL to promote this silencing. We show that DUXBL gains accessibility to DUX-bound regions specifically upon DUX expression. Furthermore, we determine that DUXBL interacts with TRIM24 and TRIM33, members of the TRIM superfamily involved in gene silencing, and colocalizes with them in nuclear foci upon DUX expression. Importantly, DUXBL overexpression impairs 2C-associated transcription, whereas Duxbl inactivation in mouse embryonic stem cells increases DUX-dependent induction of the 2C-transcriptional program. Consequently, DUXBL deficiency in embryos results in sustained expression of 2C-associated transcripts leading to early developmental arrest. Our study identifies DUXBL as an essential regulator of totipotency exit enabling the first divergence of cell fates.


Conflict of interest statement

COMPETING INTERESTS

The authors declare no competing interests.

Figures

Extended Data Figure 1:
Extended Data Figure 1:. DUX induces two protein products from the Duxbl gene.
a) High-throughput imaging quantification of GFP mean nuclear intensity in untreated or DOX-treated for 16 hours BR1-GFP reporter ESCDUX. Center lines indicate mean values. n=537. b) Graph plots showing quantified mean intensity levels of RFP and GFP obtained from untreated and DOX-treated LTR-RFP reporter BR2- or BR3-GFP ESCDUX. c) DNA sequences surrounding exon 2 of Duxbl showing the deletions detected in representative DUXBLKO ESCDUX clones analyzed. DNA sequence from exon 2 is highlighted in bold. The alternative ATG at the end of the second Duxbl exon is highlighted in red. d) Schematic representation of the DUXBL protein products. e) Protein sequence alignment of DUX, DUXBLLG (large DUXBL isoform) and DUXBLSM (small DUXBL isoform). Highlighted in blue are the two homeodomains (note than DUXBLSM lacks most of the first homeodomain). Highlighted in dark grey are conserved residues and in light grey are similar residues. Highlighted in green is the peptide sequence used to generate our custom DUXBL antibody. f) Western blot analysis of DUXBL performed in lysates from a pool of approximately 488 embryos at the indicated stages of development. Increasing amounts of DOX-treated WT ESCDUX as well as DOX-treated DUXBLKO ESCDUX lysates were included as controls. Ponceau staining is shown as a loading control. For (a, b and f), two independent experiments were performed but one representative experiment is shown.
Extended Data Figure 2:
Extended Data Figure 2:. DUXBL does not function as a transcriptional activator.
a) Volcano plots showing differentially expressed genes between DUX- (left panel) or DUXBL-expressing ESC (right panel) compared to control ESC. b) Heatmap showing the top 50 differentially expressed genes between DUX- and DUXBL-expressing ESC. c) Western blot analysis of the indicated proteins performed with V5 immunoprecipitates obtained from 293T cells transfected with the corresponding expression vectors. This experiment was repeated multiple times, but one is shown. Data in (a, b) was generated using three replicates per condition.
Extended Data Figure 3:
Extended Data Figure 3:. Duxbl-deficient ESC showed increased 2CLC-conversion.
a) Time lapse microscopy experiment performed in LTR-RFP reporter WT and DUXBLKO ESCDUX. Two independent experiments with two ESC lines per condition were performed, but one representative is shown. Time since the addition of DOX is indicated. Scale bar, 10 μm. b) High-throughput imaging (HTI) quantification of RFP+ cells in LTR-RFP reporter WT and DUXBLKO ESC. Center lines indicate mean values. Percentages of RFP+ cells above the threshold (dotted line) are indicated. n=2000; p value is from one-tailed unpaired t-test. Three independent experiments were performed but one representative is shown. c) Real time-PCR analysis shown in a box and whisker plot showing the relative fold change expression of nine 2C-associated genes/repeats (Dux, Zscan4c, Zfp352, Tcstv3, Sp110, Tdpoz1, Dub1, Eif1ad8, and MERVLs) in RFP negative, and RFP positive cells sorted from LTR-RFP reporter WT and DUXBLKO ESCDUX cultures. Gapdh expression was used to normalize. Center line indicates the median, box extends from the 25th to 75th percentiles and whiskers show Min to Max values. p values are shown from one-tailed unpaired t-tests. Two independent experiments were performed but one representative is shown. d) Unidimensional PCA plot of RNAseq data from untreated or DOX-treated WT and DUXBLKO ESCDUX (two replicates each) together with WT DUX-expressing ESC from. DUX-expressing ESC were sorted into GFP+ or GFP- based on the activation of the LTR-GFP reporter. e) Box and whisker plot showing normalized fold change expression of the 244 genes downregulated as shown in Fig. 2b. RNAseq data obtained from. Center line indicates the median, box extends from the 25th to 75th percentiles and whisker extends from the hinge to the largest or smallest value no further than 1.5-fold from the inter-quartile range. Data beyond whiskers were plotted individually. For (c-e), data was generated using two independent ESC lines per genotype and condition. f) Venn diagram showing the overlap between the 210 genes described in Fig. 2d and the upregulated genes in LTR+ sorted DUX-expressing ESC (data obtained from). p value was obtained from a two-tailed Fisher’s exact test. g) Genome browser tracks from individual samples showing RNAseq RPKM read count in untreated or DOX-treated WT and DUXBLKO ESCDUX.
Extended Data Figure 4:
Extended Data Figure 4:. DUXBL expression limits 2CLC conversion.
a) Western blot analysis of DUXBL (FLAG) performed in lysates from untreated or indole-3-acetic acid (IAA)/DOX-treated WT or ESCCTCF-AID expressing DUXBL (FLAG). Tubulin levels are shown as a loading control. b) High-throughput imaging (HTI) quantification of RFP+ cells in LTR-RFP reporter WT and DUXBLKO ESC incubated with 0.53 mM RA for 48 hours. c) HTI quantification of RFP+ cells in untreated or DOX-treated LTR-RFP reporter ESCDUXBL incubated with 0.53 mM RA for 48 hours. d) Western blot analysis using lysates from untreated or DOX-treated ESCDUXBL incubated with 2.5 mM PlaB for 24 hours or 0.53 mM RA for 48 hours. e) Box and whisker plot showing the relative fold change (log2) expression of eight 2C-associated genes (Dux, Zscan4c, Zfp352, Tcstv3, Sp110, Tdpoz1, Dub1 and Eif1ad8) in untreated or DOX-treated ESCDUXBL incubated with 2.5 mM PlaB for 24 hours or 0.53 mM RA for 48 hours. Two independent experiments were performed but one representative is shown. p values are shown from one-tailed unpaired t-tests. Center line indicates the median, box extends from the 25th to 75th percentiles and whiskers show Min to Max values. f) Western blot analysis of CTCF performed in lysates from untreated or IAA-treated ESCCTCF-AID. Tubulin levels are shown as a loading control. g) HTI quantification of RFP+ cells in untreated or IAA/DOX-treated for 48 hours LTR-RFP reporter ESCCTCF-AID expressing DUXBL. h) HTI quantification of RFP+ cells in untreated or IAA-treated for 24 and 48 hours LTR-RFP reporter WT or DUXBLKO ESCCTCF-AID. For (a,d and f), two independent experiments were performed but one representative is shown. For (b,c,g and h), center lines indicate mean values. Percentages of RFP+ cells above the threshold (dotted line) are indicated. n=2000. p values are shown from one-tailed unpaired t-tests. In all cases, three independent experiments were performed but only one representative is shown.
Extended Data Figure 5:
Extended Data Figure 5:. DUXBL expression in zygotes impairs proper ZGA.
a) Representative bright field and fluorescence images of zygotes not injected or microinjected with mRNA encoding for mCherryNLS or DUXBLV5 plus mCherryNLS. Images were taken 6 hours post microinjection. Scale bar, 50 μm. Five independent experiments were performed but one representative is shown. b) Representative immunofluorescence analysis of the V5 tag in zygotes not injected or microinjected with mRNA encoding DUXBLV5 plus mCherryNLS. DAPI was used to visualize the nuclei. Scale bars, 50 μm. At least 10 independent embryos per condition were stained but one representative is shown. c) Heatmap and k-means clustering (3) showing the distribution of the indicated samples described in Figure 3a. d, e) Volcano plots highlighting the differentially expressed genes observed by RNAseq analysis between DUXBLV5 and mCherryNLS-overexpressing embryos (red: FC≥2 DUXBL/mCherry; blue: FC≤−2 DUXBLV5/mCherry; padj<0.05). f) Volcano plot showing differentially expressed genes between DUXBL-overexpressing embryos compared to mCherry-overexpressing embryos. Genes differentially induced by DUX are highlighted in red. Log2 fold change>1; pValue<0.01. For (c-f), data was generated by using a total of 4–6 pools of 5 embryos/pool per stage and condition.
Extended Data Figure 6:
Extended Data Figure 6:. Downregulation of Duxbl in zygotes compromises development.
a) Plot showing mean±standard error of the mean (SEM) summarizing four independent experiments with a total of 25–45 microinjected zygotes per group (non-microinjected, control morpholino (MO), or a second morpholino (MO2)-injected zygotes) per experiment. The percentage of embryos reaching each embryo stage is shown. Mor: morula, Blast: blastocyst. p values are shown from one-tailed unpaired t-tests. b) Plot showing mean±standard error of the mean (SEM) summarizing four independent experiments with a total of 25–45 microinjected zygotes per group (non-microinjected, control or Duxbl siRNAs injected GV oocytes) per experiment. The percentage of embryos reaching each embryo stage is shown. Mor: morula, Blast: blastocyst. p values are shown from one-tailed unpaired t-tests. c) Relative fold change (log2) expression of Duxbl in uninduced or DOX-induced in ESCDUX transfected 36 hours prior to induction with the corresponding siRNAs. Reactions were performed by duplicate in two different ESCDUX lines. Two independent experiments were performed but one representative is shown. p value is shown from one-tailed unpaired t-test. d) Pie chart showing percentages of genotypes from Duxbl+/Δ crossings at P14 after F1 generation. e) Gel showing PCR results from genotyping all 8C-stage embryos obtained from Duxbl+/Δ crossings. The identity of the bands obtained by PCR was confirmed by genotyping on positive and negative controls at least two times. f) Gene set enrichment analysis (PANTHER gene sets) according to differentially expressed genes observed in Duxbl Δ/Δ embryos compared to Duxbl+/Δ/Duxbl+/+ embryos (Kobas FDR < 0.2).
Extended Data Figure 7:
Extended Data Figure 7:. DUXBL gains access at DUX-bound sites following DUX expression.
a) Predicted binding sites for DUX and DUXBL (Jaspar database). b) Venn diagrams showing the number of DUXBL peaks overlapping between those identified with DUXBL antibodies (blue) and FLAG antibodies (yellow) in ESCDUXBL. c) Genome browser tracks corresponding to individual samples from (b) showing DUXBL occupancy. Input (IgG) is shown as control. For (b,c), two independent experiments with two independent ESC lines were performed. d) Pie chart showing the genomic distance of DUXBL peaks from gene TSS. e) Venn diagrams showing the number of DUXBL peaks overlapping with traditional ESC enhancers (left) and ESC super-enhancers (SE, right). Enhancer data obtained from,. p values shown are from two-tailed Fisher’s exact test. f) Gene ontology (GO) terms obtained from analyzing DUXBL peaks. p-values were obtained from a binomial test. g) CUT&RUN read density plot (RPGC) showing DUXBL and DUX enrichment at MERVL-int elements in DOX-treated ESCDUXBL. Data from DUX-expressing ESC was obtained from. Input (IgG) is shown as control. Data from one representative ESC line is shown. h) Venn diagrams showing the number of DUXBL (left panel, blue) and DUX peaks (right panel, blue) overlapping with accessible regions in ESC (yellow). ATAC-seq data was obtained from. i) Genome browser tracks from individual samples showing DUXBL and DUX occupancy as well as ATACseq signal in DOX-treated WT ESC expressing DUX or DUXBL. Data from DUX-expressing ESC and ATACseq experiments were obtained from,. Input (IgG) is shown as control. j) Plot showing DUXBL enrichment over DUX-bound sites in the condition of DUX/DUXBL co-expression compared to only DUXBL expression. We used a |og2(FC) cutoff of >1 and p-value <0.01 to define differentially enriched sites. Representative genes in proximity to DUX-bound sites enriched for DUXBL binding are shown. Two independent experiments using one ESC line were performed but data from one representative experiment is shown. k) Immunofluorescence analysis of DUXBL (FLAG) in untreated or DOX-treated LTR-RFP reporter ESCDUXBL/DUX. Scale bar, 20 μm. l) Immunofluorescence analysis of DUXBL in untreated or DOX-treated ESCDUXBL. In (k and l), two independent experiments were performed but one representative is shown. DAPI was used to visualize nuclei. Scale bar, 100 μm.
Extended Data Figure 8:
Extended Data Figure 8:. DUXBL interacts with the TRIM33/TRIM24 complex.
a, b) Western blot analysis of the indicated proteins performed with total protein extracts (input) and DUXBL immunoprecipitates (10% of total IP) obtained from untreated or DOX-treated ESCDUXBL (a) or untreated or DOX-treated ESCDUX (b). c) Volcano plot showing the enrichment of proteins obtained from endogenous DUXBL immunoprecipitation followed by mass spectrometry (IP-MS) analysis in two independent WT untreated or DOX-treated ESCDUX. d) Western blot analyses of the indicated proteins performed with total extracts (input) and DUXBL immunoprecipitates (IP) obtained from untreated and doxycycline treated ESCDUX. We also included the flowthrough (FT) following the immunoprecipitation to show the specific depletion of DUXBL where corresponds. e) Schematic representation of the different TRIM24 mutants used in our immunoprecipitation assays. f, g) Western blot analysis of the indicated proteins performed with total protein extracts (input) and FLAG pulldowns obtained from DOX-treated ESC containing stably transfected Piggy-bac constructs encoding for HA-tagged DUXBL and/or each of the different FLAG-tagged TRIM24 mutants. h) Schematic representation of the different DUXBL protein forms used in our immunoprecipitation assays. i) Western blot analysis of the indicated proteins performed with total protein extracts (input) and FLAG pulldowns obtained from DOX-treated DUXBLKO ESC containing stably transfected Piggy-bac constructs encoding for each of the different FLAG-tagged DUXBL protein forms. TRIM24 endogenous levels are shown. Two independent experiments were performed in (a, b, d, f, g and i) but one representative is shown.
Extended Data Figure 9:
Extended Data Figure 9:. DUXBL/TRIM33/TRIM24 colocalize at DUX-induced nuclear foci.
a) Immunofluorescence analysis of DUX (HA) and endogenous TRIM24 in untreated or DOX-treated ESCDUX−2XHA. Scale bars, 20 μm. b) Immunofluorescence analysis of endogenous TRIM24 in endogenous 2CLC observed in LTR-RFP reporter WT ESC. Scale bars, 20 μm. For (a,b), DAPI was used to visualize nuclei and two independent experiments were performed but one representative is shown. c) High-throughput imaging (HTI) quantification of the number, total intensity and area of TRIM24 foci (upper, middle and lower panel, respectively) per cell in untreated or DOX-treated LTR-RFP reporter WT or DUXBLKO ESCDUX. d) Western blot analysis of TRIM24 performed in WT and TRIM24KO ESCDUX. e) Western blot analysis of TRIM33 performed in WT and TRIM33KO ESCDUX lysates. f) HTI quantification of the number, total intensity and area of DUXBL foci (upper, middle and lower panel, respectively) per cell in untreated or DOX-treated LTR-RFP reporter WT or TRIM33KO ESCDUX. For (c and f) Percentages of cells above the threshold (dotted line) are indicated. Center lines indicate mean values. n=2000; p values are shown from one-tailed unpaired t-tests. Two independent experiments using at least two WT, DUXBLKO ESCDUX or TRIM33KO ESCDUX clones were performed but one representative is shown. g) Graph showing 2CLC residency time evaluated by using the LTR-RFP reporter in DOX-treated WT and TRIM24KO ESCDUX. p value is shown from a two-tailed unpaired t-test. Plot was generated by using data from two independent ESC lines per genotype. h) Western blot analysis of TRIM24 performed in WT and TRIM24FKBP ESCDUX. i) Western blot analysis of TRIM24 and DUXBL performed in untreated and DOX/dTAG-treated TRIM24FKBP and DUXBLKO; TRIM24FKBP ESCDUX for 16 hours. For (d,e,h,i), tubulin levels were used as loading control and two independent experiments were performed but one representative is shown. j) Graph showing 2CLC residency time evaluated by using the LTR-RFP reporter in dTAG-treated WT and DUXBLKO; TRIM24FKBP ESCDUX. p values are shown from two-tailed unpaired t-tests. Plot was generated by using data from two independent ESC lines per genotype.
Extended Data Figure 10:
Extended Data Figure 10:. DUXBL/TRIM24/TRIM33 complex co-localizes with H3K9me3 at DUX-induced nuclear foci.
a) Immunofluorescence analysis of DUXBL in untreated or DOX-treated ESCDUX-FKBP. Treatments include DOX for 24 hours or DOX for 16 hours plus 8 hours with dTAG compounds. DAPI was used to visualize nuclei. Scale bar, 20 μm. Three independent experiments were performed but one representative is shown. b) High-throughput imaging (HTI) quantification of the number, total intensity and area of DUXBL foci (upper, middle and lower panel, respectively) per cell in ESCDUX-FKBP treated as in (a). c) HTI quantification of the number, total intensity and area of DUX (HA) foci (upper, middle and lower panel, respectively) per cell in untreated or DOX-treated ESCDUX-FKBP treated as in (a). d) HTI quantification of the number, total intensity and total area of TRIM24 foci (upper, middle and lower panel, respectively) per cell in ESCDUX-FKBP treated as in (a). For (b,c, and d), center lines indicate mean values; n=2000. p values are shown from one-tailed unpaired t-tests. Percentages of cells above the threshold (dotted line) are indicated. At least, two independent experiments were performed but one representative experiment is shown. e, f) Plot showing the ratio for HDAC (e) and HP1 (f) between the fluorescence intensity found at TRIM24 foci and the mean nuclear intensity per cell detected in DOX-treated LTR-RFP reporter ESCDUX. Center lines indicate mean values. n=2000. Two independent experiments using two ESCDUX clones were performed but one representative is shown. g) HTI quantification of the number, total intensity and area of H3K9me3 foci (right, middle and left panel, respectively) per cell in untreated or DOX-treated LTR-RFP reporter ESCDUX. Center lines indicate mean values. n=2000; p values are shown from one-tailed unpaired t-tests. Three independent experiments using at least two ESCDUX clones were performed but one representative is shown.
Fig. 1:
Fig. 1:. The Duxbl gene generates two protein products upon DUX expression.
a) Box and whisker plots showing normalized read counts for Duxbl, Dux and Zscan4c during early development. Zscan4c is included as a key DUX-dependent gene of major ZGA. Single cell RNAseq data was extracted from. Center line indicates the median, box extends from the 25th to 75th percentiles and whiskers extend from the hinge to the largest or smallest value no further than 1.5-fold from the inter-quartile range. Data beyond the whiskers are plotted individually. 1C (n=4), E2C (n=8), M2C (n=12), L2C (n=10), 4C (n=14), 8C (n=28); E2C, M2C and L2C: early, mid and late 2C embryo. b) Relative fold change (log2) expression of Duxbl upon DUX expression in ESCDUX. Reactions were performed in duplicate with two independent experiments using two different ESCDUX lines. p values are shown from two-tailed paired t-tests. c) Genome browser tracks from individual representative samples showing DUX occupancy at the Duxbl gene. ChIP-seq data obtained from. DUX binding sites and BR regions are highlighted. Read mapping was performed using the mm39 mouse genome version. d) High-throughput imaging quantification of GFP mean nuclear intensity in untreated or DOX-treated for 16 hours BR2 or BR3-GFP reporter ESCDUX. Center lines indicate mean values. n=2000; p values are shown from one-tailed unpaired t-tests. e) Western blot analysis of DUXBL performed in lysates from untreated or DOX-treated for 16 hours ESCDUX. H2A levels are shown as a loading control. f) Western blot analysis of DUXBL performed in lysates from untreated or DOX-treated for 16 hours WT and DUXBLKO ESCDUX. g) Western blot analysis of DUXBL performed in lysates from a pool of approximately one thousand late 2C-embryos. Increasing amounts of DOX-treated WT ESCDUX as well as DOX-treated DUXBLKO ESCDUX lysates were included as controls. Tubulin levels are shown as a loading control. For (e-g) two independent experiments were performed but one representative experiment is shown.
Fig. 2:
Fig. 2:. DUXBL counteracts 2CLC conversion.
a) Graph showing 2CLC residency time evaluated by using the LTR-RFP reporter. p value is shown from a two-tailed unpaired t-test. Two independent experiments were performed but one representative is shown including two ESC lines per condition. b) Volcano plots showing differentially expressed genes (upper panel) and TE (lower panel) between DOX-treated DUXBLKO ESCDUX compared to DOX-treated WT ESCDUX. Relevant genes and TE are highlighted. c) Box and whisker plot showing normalized fold change expression of upregulated genes from (b) during preimplantation development including ESC. RNAseq data obtained from. p-values are shown from two-tailed unpaired t-tests. Center line indicates the median, box extends from the 25th to 75th percentiles and whiskers extend from the hinge to the largest or smallest value no further than 1.5-fold from the inter-quartile range. Data beyond whiskers are plotted individually. ICM: Inner cell mass. For (b, c), data was generated using two independent ESC lines per genotype and condition. d) Heatmap showing differentially expressed genes between control and DUX and/or DUXBL-expressing ESC. e) Plot showing mean±standard deviation (SD) for transcript per million (TPM) values for Zscan4a, Zfp352 and Gm1995. Data was obtained from (d). p value was obtained from two-tailed Wald test. For (d, e), data was generated using three replicates per condition. f) High-throughput imaging (HTI) quantification of RFP+ cells in LTR-RFP reporter WT and DUXBLKO ESC incubated with 2.5 μM PlaB for 24 hours. g) HTI quantification of RFP+ cells in untreated or DOX-treated LTR-RFP reporter ESCDUXBL incubated with 2.5 μM PlaB for 24 hours. For (f, g), center lines indicate mean values. Percentages of RFP+ cells above the threshold (dotted line) are indicated. n=2000; p value is shown from one-tailed unpaired t-test. Three independent experiments were performed but one representative is shown. h) CUT&RUN read density plot (reads per genome content, RPGC) showing H3K27ac enrichment at DUX-bound sites in untreated or DOX-treated ESCDUXBL incubated with 2.5 μM PlaB for 24 hours. Input (IgG) is shown as control. Data was generated using two independent ESC lines per condition but results from one representative ESC line are shown.
Fig. 3:
Fig. 3:. DUXBL overexpression in zygotes halts development.
a) Schematic representation of the microinjection experiment (done with BioRender). 1C embryos (24 hours post hCG injection) were microinjected with mRNA encoding mCherryNLS or V5-tagged DUXBL plus mCherryNLS. Embryos were collected for immunofluorescence at the late 1C stage (28–30-post hCG injection), for RNAseq at late 1C, early 2C (32 hours post hCG injection) and late 2C (48 hours post hCG injection), and at late blastocyst stage (120 hours post hCG injection) to examine embryonic development. b) Bar plot showing mean±standard error of the mean (SEM) summarizing four independent experiments with 20–39 microinjected 1C embryos per group [non-microinjected, microinjected with mCherryNLS mRNA and microinjected with DUXBLV5-microinjected mRNA] per experiment. Embryos correspond to late 2C, 4C/8C, Mor (morula) and Blast (blastocyst) (48, 72, 96 and 120 hours post hCG, respectively). p values are shown from one-tailed unpaired t-tests. c) Brightfield images of the embryos at the endpoint from one representative experiment out of five from (b). Scale bars, 275 μm. d) PCA plot of RNAseq data of late 1C, early 2C and late 2C mCherryNLS- and DUXBLV5-microinjected mRNA embryos. e) Volcano plot from samples in (d) highlighting the differentially expressed genes observed by RNAseq analysis between DUXBLV5 and mCherryNLS-overexpressing embryos (red: FC≥2 DUXBL/mCherry; blue: FC≤−2 DUXBLV5/mCherry; padj<0.05). f) Venn diagram showing the overlap of genes downregulated upon precocious DUXBL overexpression with genes upregulated during the transition from early to mid 2C-stage in WT embryos. Data from. Hypergeometric test (one-tailed Fisher’s exact) was used to calculate significance of overlap (p value<5×10−324). g) Heatmap showing the expression level of the subset of 2700 genes from (f) in the indicated samples. h) Box and whisker plot showing TPM values (log2) for the indicated genes from the Zscan4 cluster in the indicated samples. Data was obtained from the RNAseq analysis shown in (d). padj values were derived by Benjamini-Hochberg procedure. Center line indicates the median, box extends from the 25th to 75th percentiles and whiskers show Min to Max values. For (d-h) a total of 4–6 pools of 5 embryos/pool were used per embryo stage and condition.
Fig. 4:
Fig. 4:. DUXBL is essential for mouse embryo development.
a) Bar plot showing mean±standard error of the mean (SEM) summarizing five independent experiments with 25–45 microinjected 1C embryos per group [non-microinjected, control morpholino (Control-MO), or Duxbl morpholino (Duxbl-MO)-injected embryos] per experiment. Embryos correspond to late 2C, 4C/8C, Mor (morula) and Blast (blastocyst) (48, 72, 96 and 120 hours post hCG, respectively). p values are from one-tailed unpaired t-tests. b) Brightfield images of the embryos from one representative experiment out of five from (a). Scale bar,100 μm. c) Duxbl locus and sgRNAs used for the CRISPR-based knockout strategy. d-g) Pie charts showing percentages of genotypes from Duxbl+/Δ crossings at P14 (d), late 2C (e), 4C (f) and 8C (g). h) Genome browser tracks from individual embryos showing normalized expression levels of Duxbl and Cphx in WT embryos and embryos obtained from Duxbl+/Δ crossings. i) Heatmap showing the expression level of the top 50 differentially expressed genes according to p-adj when comparing DuxblΔ/Δ and Duxbl+/Δ or Duxbl+/+ embryos. j) Overlap between genes upregulated in DuxblΔ/Δ embryos compared to Duxbl+/Δ or Duxbl+/+ embryos at late 2C and genes upregulated during the transition from early to mid 2C-stage in WT embryos (Supplementary Table 5). Data from. Hypergeometric test (one-tailed Fisher’s exact) was used to calculate significance of overlap. k) Heatmap comparing the expression of ZGA genes repressed by DUXBL overexpression (overlap set from Fig. 3f) in WT embryos and DuxblΔ/Δ embryos. l) Genome browser tracks from individual embryos obtained from Duxbl+/Δ crossings as in (h) showing normalized expression levels of known DUX targets. m) Box plots showing normalized read counts of MERVL-int elements in Duxbl+/+ or Duxbl+/Δ and DuxblΔ/Δ embryos. Center line indicates the median, box extends from the 25th to 75th percentiles and whiskers show Min to Max values. p value is shown from one-tailed unpaired t-test. A total of Duxbl+/+ or Duxbl+/Δ (n=22 combined) and DuxblΔ/Δ (n=5) late 2C embryos were used to generate plots from (i, j and m). For (h, k and l) a set of representative Duxbl+/+ or Duxbl+/Δ and all DuxblΔ/Δ late 2C embryos are shown.
Fig. 5:
Fig. 5:. DUX-mediated chromatin opening facilitates DUXBL binding to DUX-bound regions.
a) CUT&RUN normalized read density plot (reads per genomic content, RPGC) and corresponding heatmaps showing DUXBL enrichment at gene transcriptional start sites (TSS, left panel) and traditional ESC enhancers (right panel) in WT ESC expressing DUXBL. Input (IgG) is shown as control. Two independent ESC lines were used but data from one representative is shown. b, c) Genome browser tracks corresponding to individual samples from (a) showing DUXBL occupancy at a representative example of a gene promoter (b) or a super-enhancer (SE) (c). DUXBL binding site are highlighted. Input (IgG) is shown as control. d) Venn diagrams showing the number of DUXBL peaks overlapping with DUX-binding sites (left) and MERVL-int repeats (right). The set of DUXBL peaks was generated using data from two independent ESC lines. e) CUT&RUN read density plot (RPGC) and corresponding heatmaps showing DUXBL enrichment at the indicated genomic regions in DOX-treated WT ESC expressing DUXBL or DUX/DUXBL as shown. Input (IgG) is shown as control. Two independent experiments were performed but one representative is shown. f, Venn diagrams showing the number of DUXBL binding-sites gained upon DUX co-expression overlapping with DUX-binding sites (upper panel) and MERVL-int elements (lower panel). Representative genes in proximity to DUX-bound sites enriched for DUXBL binding are shown. g) Genome browser tracks corresponding to individual samples from (e) showing DUX (data from) and DUXBL enrichment (our data) at the indicated genomic region with a representative example of DUXBL binding to DUX-bound regions, Zscan4d and a MERVL-int repeat, and to a DUX unbound gene, Uvrag. Input (IgG) is shown as control. h) Immunofluorescence analysis of DUX (HA) and endogenous DUXBL in LTR-RFP reporter DOX-treated ESCDUX. DAPI was used to visualize nuclei. Scale bar, 20 μm. Dashed regions are zoomed-in in the insets. i) Time lapse microscopy experiment performed in LTR-RFP reporter DOX-induced ESCDUX endogenously tagged with miRFP702 at the Duxbl locus. Time since the addition of DOX is indicated. Scale bar, 20 μm. For (h, i), two independent experiments using at least two ESC lines were performed but one representative is shown.
Fig. 6:
Fig. 6:. DUXBL interacts with the TRIM33/TRIM24 complex.
a) Volcano plot showing the enrichment of proteins immunoprecipitated from DOX-treated over untreated ESCDUXBL by using two independent ESC lines from a DUXBL IP-MS experiment. Enriched proteins in DOX-treated cells are highlighted in red. b) Western blot analysis of the indicated proteins performed with FLAG immunoprecipitates obtained from untreated or DOX-treated ESCDUXBL. Two independent experiments were performed but only one representative is shown. c) Immunofluorescence analysis of endogenous DUXBL and TRIM24 in untreated or DOX-treated LTR-RFP reporter WT or TRIM24KO ESCDUX. DAPI was used to visualize nuclei. Scale bars, 20 μm. Dashed regions are magnified in the insets. d) Immunofluorescence analysis of endogenous TRIM33 and TRIM24 in untreated or DOX-treated LTR-RFP reporter ESCDUX. DAPI was used to visualize nuclei. Scale bars, 20 μm. Dashed regions are magnified in the insets. e) High-throughput imaging quantification of the number of DUXBL foci per cell (upper panel), the total intensity of DUXBL foci per cell (middle panel) and the total area of DUXBL foci per cell (lower panel) in untreated or DOX-treated LTR-RFP reporter WT or TRIM24KO ESCDUX. Center lines indicate mean values. n=2000; Percentages above the threshold (dotted line) are indicated. Relevant p values are shown from one-tailed unpaired t-tests. f) Immunofluorescence analysis of endogenous DUXBL and TRIM24 at different timepoints in untreated or DOX-treated WT ESCDUX. Time since the addition of DOX is indicated. DAPI was used to visualize nuclei. Scale bar, 20 μm. Three independent experiments using at least two WT and TRIM24KO ESCDUX clones (c, e) or two ESCDUX clones (d, f) were performed but one representative experiment is shown.
Fig. 7:
Fig. 7:. DUXBL and TRIM24/TRIM33 co-localize with H3K9me3 deposition.
a, b) Immunofluorescence analysis of HDAC (a) and HP1 (b) in untreated or DOX-treated LTR-RFP reporter ESCDUX. DAPI was used to visualize nuclei. Scale bars, 20 μm. Dashed regions are magnified in the insets. c) Immunofluorescence analysis of H3K9me3 in untreated or DOX-treated LTR-RFP reporter ESCDUX. DAPI was used to visualize nuclei. Scale bars, 20 μm. d) Graphs showing TRIM24 and H3K9me3 fluorescence intensity at TRIM24-foci at different times after the addition of DOX in ESCDUX. e, f) ChIPseq read density plot (RPGC) showing H3K9me3 enrichment at DUX-bound sites (e) and MERVL (f) elements occupied by DUXBL after DUX expression during embryonic development. Input (IgG) is shown as reference control. ChIP-seq data obtained from. g) Schematic representation of the model showing the role of DUXBL facilitating the silencing of DUX-induced transcription. TRIM24/TRIM33 interact with TRIM28 which by recruiting SETDB1 could mediate H3K9me3 deposition. At least two independent experiments using two ESCDUX clones (a-d) were performed but one representative experiment is shown.

References

    1. Riveiro AR, & Brickman JM From pluripotency to totipotency: An experimentalist’s guide to cellular potency. Development (Cambridge, England) 147, dev189845 (2020). - PubMed
    1. Sha QQ, Zhang J, & Fan HY A story of birth and death: mRNA translation and clearance at the onset of maternal-to-zygotic transition in mammals. Biology of Reproduction 101, 579–590 (2019). - PubMed
    1. Schultz KN, & Harrison MM Mechanisms regulating zygotic genome activation. Nature Reviews Genetics 20, 221–234 (2019). - PMC - PubMed
    1. Jukamm D, Shariati SAM, & Skotheim JM Zygotic genome activation in vertebrates. Developmental Cell, 42, 316–332 (2017). - PMC - PubMed
    1. Hendrickson PG, Doráis JA, Grow EJ, Whiddon JL, Lim JW, Wike CL, Weaver BD, Pflueger C, Emery BR, Wilcox AL, Nix DA, Peterson CM, Tapscott SJ, Carrell DT. & Cairns BR. Conserved roles of mouse DUX and human DUX4 in activating cleavage-stage genes and MERVL/HERVL retrotransposons. Nat. Genet. 49, 925–934 (2017). - PMC - PubMed

METHODS-ONLY REFERENCES

    1. Gambini A, Stein P, Savy V, Grow EJ, Papas BN, Zhang Y, Kenan AC, Padilla-Banks E, Cairns BR & Williams CJ Developmentally Programmed Tankyrase Activity Upregulates β-Catenin and Licenses Progression of Embryonic Genome Activation. Dev. Cell 53, 545–560 (2020). - PMC - PubMed
    1. Zhang Y, Liu T, Meyer CA, Eeckhoute J, Johnson DS, Bernstein BE, Nusbaum C, Myers RM, Brown M, Li W & Liu XS Model-based analysis of ChIP-Seq (MACS). Genome Biol. 9, R137 (2008). - PMC - PubMed
    1. Ramírez F, Ryan DP, Grüning B, Bhardwaj V, Kilpert F, Richter AS, Heyne S, Dündar F, and Manke T deepTools2: a next generation web server for deep-sequencing data analysis. Nucleic Acids Res. 44, 160–165 (2016). - PMC - PubMed
    1. Grant CE, Bailey TL, Noble WS FIMO: scanning for occurrences of a given motif. Bioinformatics, 27, 1017–1018 (2011). - PMC - PubMed
    1. Martin M Cutadapt removes adapter sequences from high-throughput sequencing reads. 10.14806/ej.17.1.200. - DOI

MeSH terms