. 2024 Mar 20;25(1):297.
doi: 10.1186/s12864-024-10081-z.

Genome sequencing and analysis of black flounder (Paralichthys orbignyanus) reveals new insights into Pleuronectiformes genomic size and structure

Affiliations

Genome sequencing and analysis of black flounder (Paralichthys orbignyanus) reveals new insights into Pleuronectiformes genomic size and structure

Fernando Villarreal et al. BMC Genomics. .

Abstract

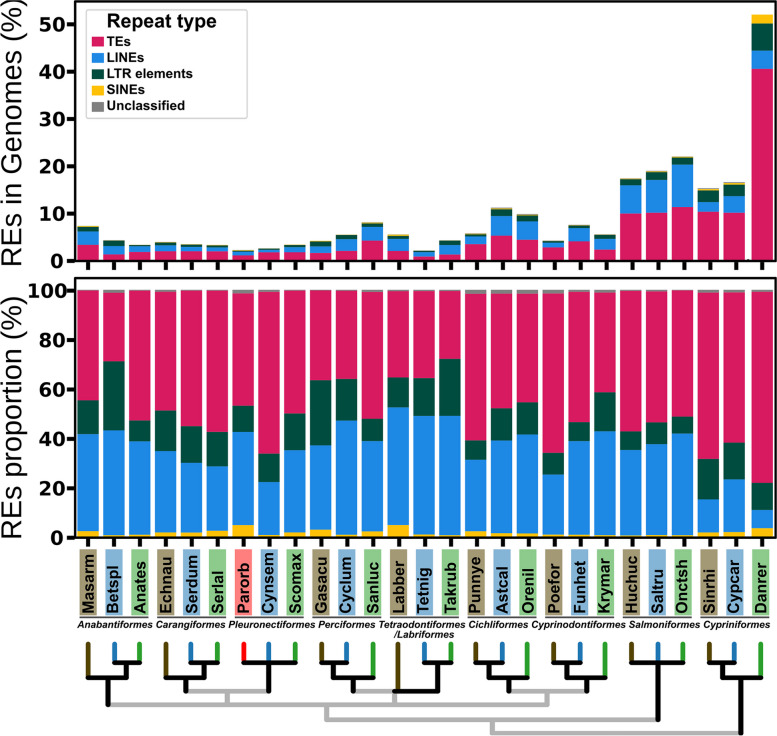
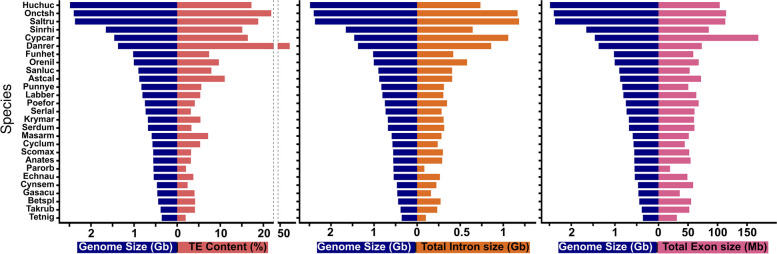
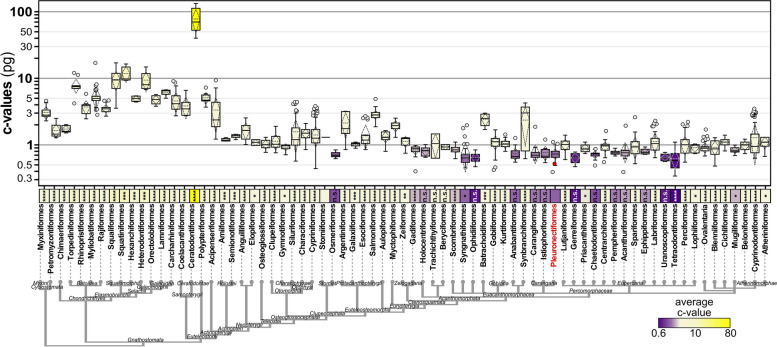
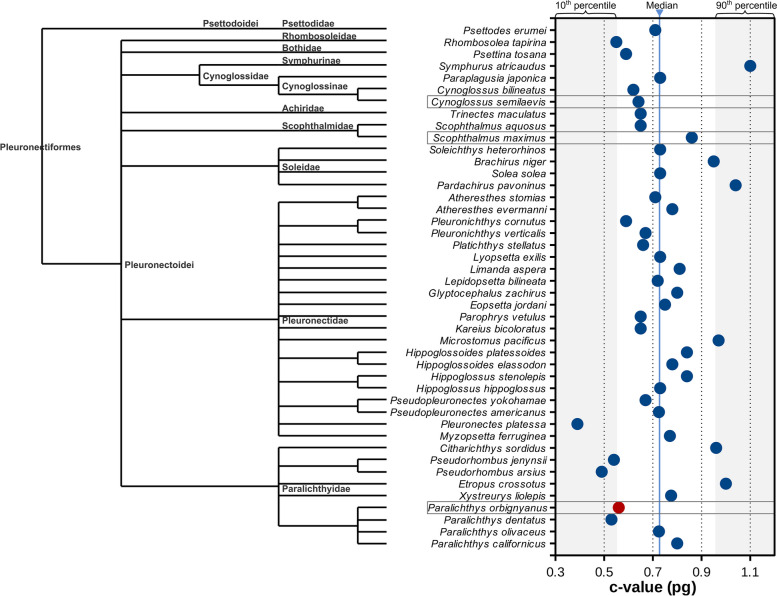
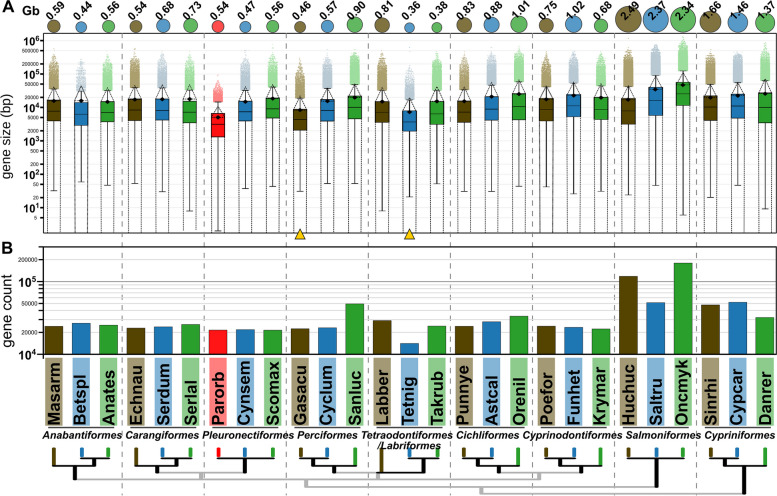
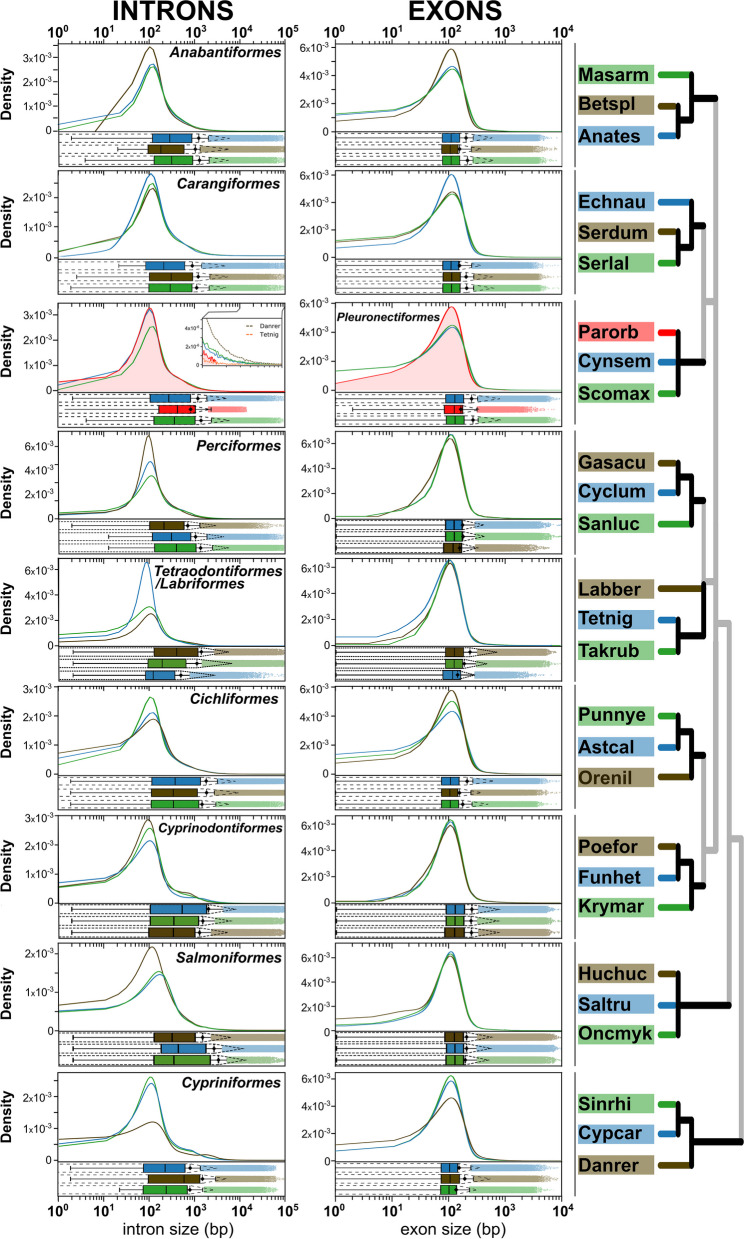
Black flounder (Paralichthys orbignyanus, Pleuronectiformes) is a commercially significant marine fish with promising aquaculture potential in Argentina. Despite extensive studies on Black flounder aquaculture, its limited genetic information available hampers the crucial role genetics plays in the development of this activity. In this study, we first employed Illumina sequencing technology to sequence the entire genome of Black flounder. Utilizing two independent libraries-one from a female and another from a male-with 150 bp paired-end reads, a mean insert length of 350 bp, and over 35 X-fold coverage, we achieved assemblies resulting in a genome size of ~ 538 Mbp. Analysis of the assemblies revealed that more than 98% of the core genes were present, with more than 78% of them having more than 50% coverage. This indicates a somehow complete and accurate genome at the coding sequence level. This genome contains 25,231 protein-coding genes, 445 tRNAs, 3 rRNAs, and more than 1,500 non-coding RNAs of other types. Black flounder, along with pufferfishes, seahorses, pipefishes, and anabantid fish, displays a smaller genome compared to most other teleost groups. In vertebrates, the number of transposable elements (TEs) is often correlated with genome size. However, it remains unclear whether the sizes of introns and exons also play a role in determining genome size. Hence, to elucidate the potential factors contributing to this reduced genome size, we conducted a comparative genomic analysis between Black flounder and other teleost orders to determine if the small genomic size could be explained by repetitive elements or gene features, including the whole genome genes and introns sizes. We show that the smaller genome size of flounders can be attributed to several factors, including changes in the number of repetitive elements, and decreased gene size, particularly due to lower amount of very large and small introns. Thus, these components appear to be involved in the genome reduction in Black flounder. Despite these insights, the full implications and potential benefits of genome reduction in Black flounder for reproduction and aquaculture remain incompletely understood, necessitating further research.

Keywords: Paralichthys orbignyanus; Black flounder; Ensembl; Evolution; Genome; Intron size; Pleuronectiformes.


Conflict of interest statement

The authors declare no competing interests.

Figures

Fig. 1
Fig. 1
Contents of repetitive elements in fish genomes. Several repetitive elements (REs), such as transposable elements (TEs), long and short interspersed nuclear elements (LINEs and SINEs, respectively) and long terminal repeats (LTRs) are shown both as total percentage in genome (A) or percentage relative to repetitive elements content (B). A taxonomy tree for the species analyzed is shown below. Species: Anabantiformes (Anates: Anabas testudineus, Betspl: Betta splendens, Masarm: Mastacembelus armatus), Carangiformes (Echneu: Echeneis naucrates, Serdum: Seriola dumerili, Serlal: Seriola lalandi dorsalis), Cichliformes (Astcal: Astatotilapia calliptera, Orenil: Oreochromis niloticus, Punnye: Pundamilia nyererei), Cypriniformes (Cypcar: Cyprinus carpio, Danrer: Danio rerio, Sinrhi: Sinocyclocheilus rhinocerous), Cyprinodontiformes (Funhet: Fundulus heteroclitus, Krymar: Kryptolebias marmoratus, Poefor: Poecilia formosa), Perciformes (Cyclum: Cyclopterus lumpus, Gasacu: Gasterosteus aculeatus, Sanluc: Sander lucioperca), Pleuronectiformes (Cynsem: Cynoglossus semilaevis, Parorb: Paralichthys orbignyanus, Scomax: Scophthalmus maximus), Salmoniformes (Huchuc: Hucho hucho, Onctsh: Oncorhynchus tshawytscha, Saltru: Salmo trutta), Labriformes (Labber: Labrus bergylta) and Tetraodontiformes (Takrub: Takifugu rubripes, Tetnig: Tetraodon nigroviridis)
Fig. 2
Fig. 2
Correlation between genome size (Gb) and TE content (%), Total intron size and Total exon size of fish species. Species analyzed are represented by the sixletter code as described in Fig. 1
Fig. 3
Fig. 3
Venn diagram showing orthology in the four flatfish species (C. semilaevis, S. maximus, P. olivaceus, and P. orbignyanus and zebrafish. Protein Orthologs were calculated using OrthoMCL
Fig. 4
Fig. 4
Haploid genome size across fish based on C-value. Boxplots representing C-values of 34 fish orders (top), organized by their taxonomic relationships (bottom). Y-axis represents C-values in log scale. For boxplots: horizontal bar, median; dashed lines, mean and standard deviation; circles, outliers. C-value for P. orbignyanus, red colored circle. C-value means represented by boxes colored from yellow (highest) to purple (lowest). Analysis of unpaired t-test of Pleuronectiformes versus each order are shown (****, P < 0.0001; ***, P < 0.001; **, P < 0.01; ns, not significant)
Fig. 5
Fig. 5
Pleuronectiformes species C-values. The median and the 10th and 90th percentile values are shown. C-value for P. orbignyanus shown in red. Other two species (C. semilaevis and S. maximus) with sequenced genomes are also highlighted. Taxonomy from NCBI's Common Tree for Pleuronectiformes shown on the left
Fig. 6
Fig. 6
Gene size in Black flounder and other teleost fish genomes. A Gene size distribution of represented by boxplots (outlier values indicated by colored dots). On top, circle diameter indicates whole genome size (numeric value in Gb is also shown). Average represented by diamonds, and standard deviation in dotted lines. B Count of genes predicted in whole genomes. Species analyzed are represented by the sixletter code as described in Fig. 1 (Onkmyk: Oncorhynchus mykiss). Yellow arrows indicate species with small genome size and distribution towards smaller gene sizes (other than Black flounder)
Fig. 7
Fig. 7
Size distribution of whole genome set of introns (left) and exons (right) for 27 species in 10 fish orders. In x-axis the size in bp is shown (log10 scale). KDE plots represent probability distribution of sizes (y-axis). Below each KDE plot, the boxplots represent the median (line) and quartiles 25 and 75%, whereas whiskers represent the upper and lower bounds. Mean (◆) ± s.d (dashed lines) are shown. Outliers set is shown with dots. Six letter code for the species analyzed as described in Fig. 1 (Onkmyk: Oncorhynchus mykiss)

Similar articles

Cited by

References

    1. Lü Z, Gong L, Ren Y, Chen Y, Wang Z, Liu L, et al. Large-scale sequencing of flatfish genomes provides insights into the polyphyletic origin of their specialized body plan. Nat Genet. 2021;53:742–751. doi: 10.1038/s41588-021-00836-9. - DOI - PMC - PubMed
    1. Robledo D, Hermida M, Rubiolo JA, Fernández C, Blanco A, Bouza C, et al. Integrating genomic resources of flatfish (Pleuronectiformes) to boost aquaculture production. Comp Biochem Physiol Part D Genomics Proteomics. 2017;21:41–55. doi: 10.1016/j.cbd.2016.12.001. - DOI - PubMed
    1. Nelson JS, Grande TC, Wilson MVH. Fishes of the World: Nelson/Fishes of the World. Hoboken, NJ, USA: John Wiley & Sons, Inc; 2016.
    1. Seitz AC. Flatfishes: Biology and Exploitation. Rev Fish Biol Fish. 2008;18:249–250. doi: 10.1007/s11160-007-9072-8. - DOI
    1. Seikai T. Flounder Culture and Its Challenges in Asia. Rev Fish Sci. 2002;10:421–432. doi: 10.1080/20026491051721. - DOI

LinkOut - more resources