. 2024 Mar 20;26(1):73.
doi: 10.1186/s13075-024-03309-6.

Targeting STAT6-mediated synovial macrophage activation improves pain in experimental knee osteoarthritis

Affiliations

Targeting STAT6-mediated synovial macrophage activation improves pain in experimental knee osteoarthritis

Garth Blackler et al. Arthritis Res Ther. .

Abstract

Background: Pain from osteoarthritis (OA) is one of the top causes of disability worldwide, but effective treatment is lacking. Nociceptive factors are released by activated synovial macrophages in OA, but depletion of synovial macrophages paradoxically worsens inflammation and tissue damage in previous studies. Rather than depleting macrophages, we hypothesized that inhibiting macrophage activation may improve pain without increasing tissue damage. We aimed to identify key mechanisms mediating synovial macrophage activation and test the role of STAT signaling in macrophages on pain outcomes in experimental knee OA.

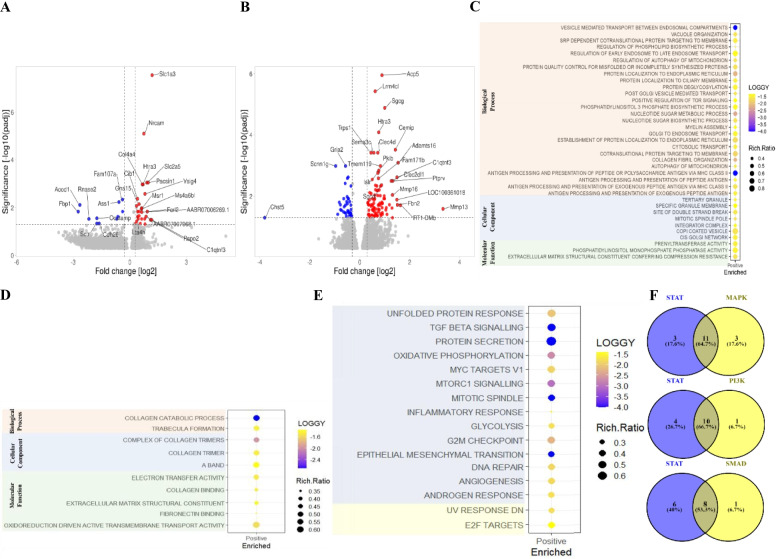
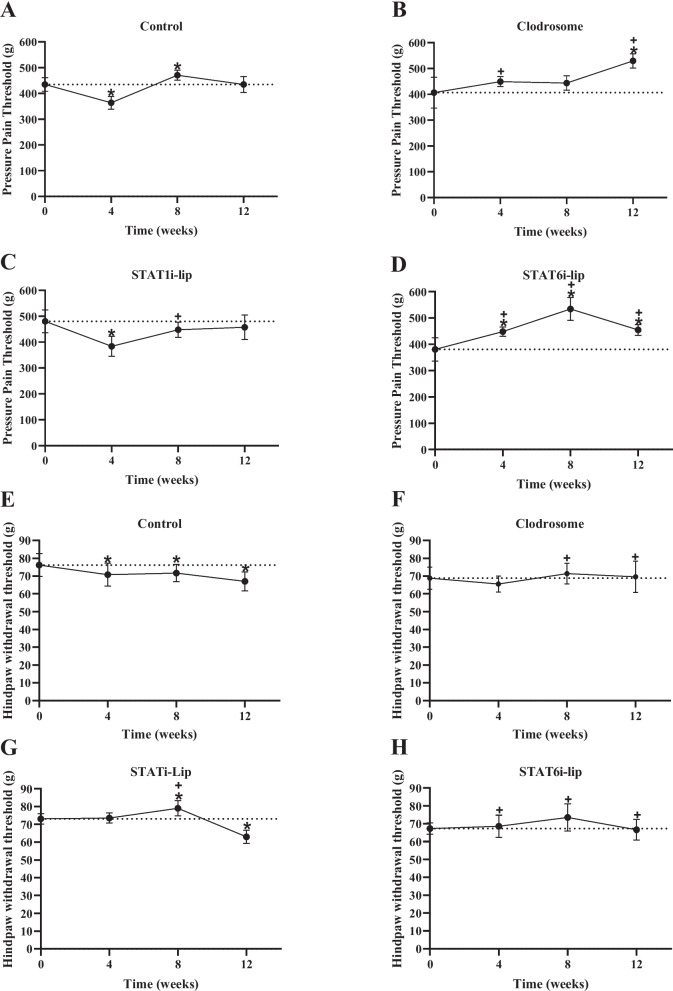
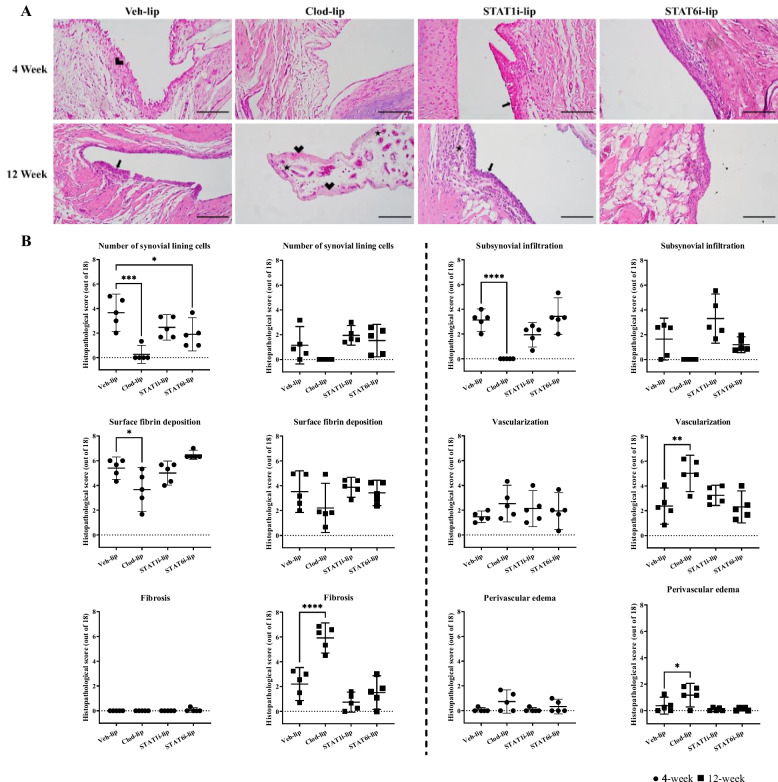
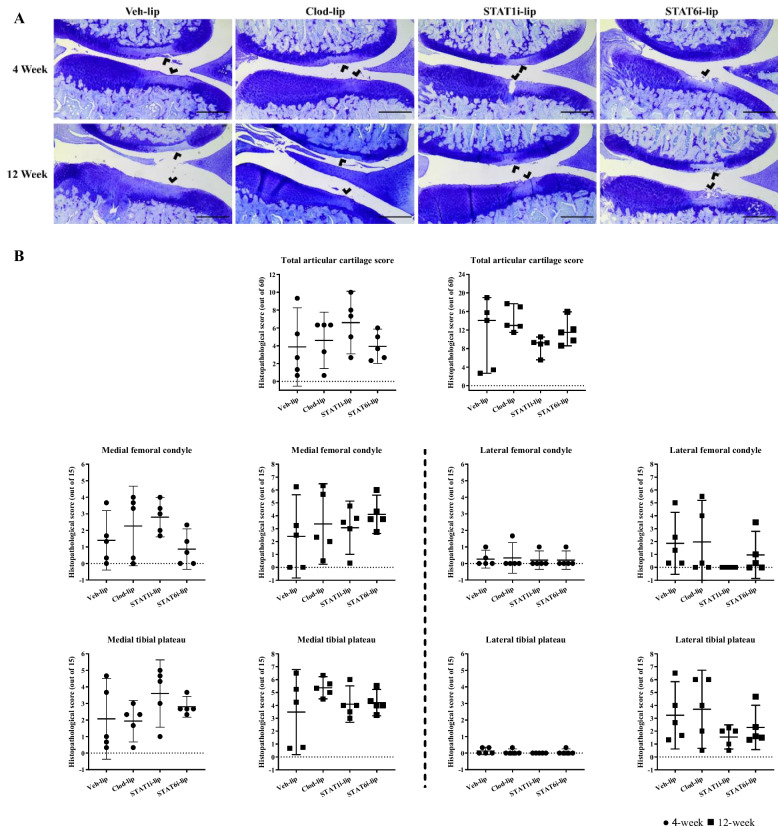
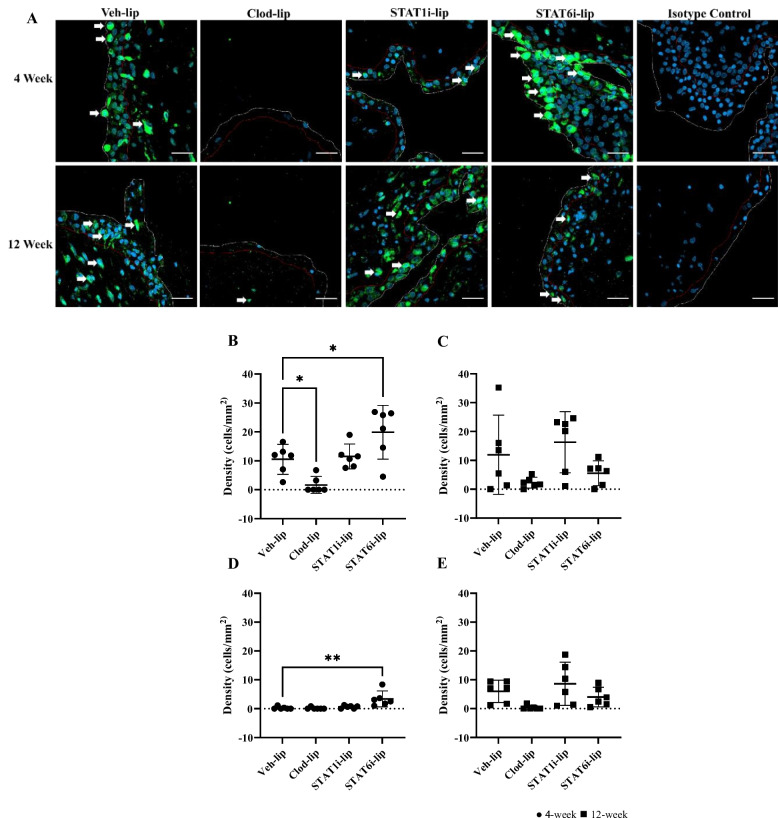
Methods: We induced experimental knee OA in rats via knee destabilization surgery, and performed RNA sequencing analysis on sorted synovial tissue macrophages to identify macrophage activation mechanisms. Liposomes laden with STAT1 or STAT6 inhibitors, vehicle (control), or clodronate (depletion control) were delivered selectively to synovial macrophages via serial intra-articular injections up to 12 weeks after OA induction. Treatment effects on knee and hindpaw mechanical pain sensitivity were measured during OA development, along with synovitis, cartilage damage, and synovial macrophage infiltration using histopathology and immunofluorescence. Lastly, crosstalk between drug-treated synovial tissue and articular chondrocytes was assessed in co-culture.

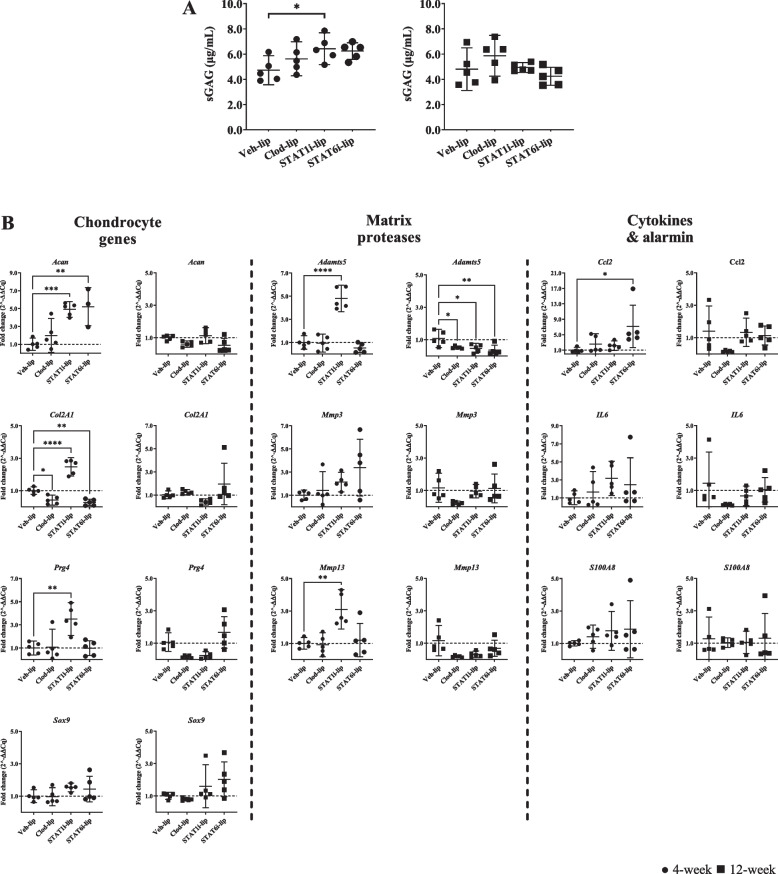
Results: The majority of pathways identified by transcriptomic analyses in OA synovial macrophages involve STAT signaling. As expected, macrophage depletion reduced pain, but increased synovial tissue fibrosis and vascularization. In contrast, STAT6 inhibition in macrophages led to marked, sustained improvements in mechanical pain sensitivity and synovial inflammation without worsening synovial or cartilage pathology. During co-culture, STAT6 inhibitor-treated synovial tissue had minimal effects on healthy chondrocyte gene expression, whereas STAT1 inhibitor-treated synovium induced changes in numerous cartilage turnover-related genes.

Conclusion: These results suggest that STAT signaling is a major mediator of synovial macrophage activation in experimental knee OA. STAT6 may be a key mechanism mediating the release of nociceptive factors from macrophages and the development of mechanical pain sensitivity. Whereas therapeutic depletion of macrophages paradoxically increases inflammation and fibrosis, blocking STAT6-mediated synovial macrophage activation may be a novel strategy for OA-pain management without accelerating tissue damage.

Keywords: Signal transducer and activator of transcription 6; macrophages; osteoarthritis; pain.


Conflict of interest statement

C.T. Appleton: consulting – AbbVie, Lily, Novartis, Pfizer.

Figures

Fig. 1
Fig. 1
Differential gene expression and gene set enrichment analysis of OA macrophages. Volcano plots showing the top differentially expressed genes of macrophages at 4-weeks (A) and 12-weeks (B) post surgery, as compared to sham controls. The Y-axis represents the -log10 of the adjusted p-value with a cut-off set at 1.3 (padj < 0.05) and the x-axis represents the log2 fold change with cut-off at -0.5 and 0.5. Bubble plots showing gene set enrichment of Gene Ontology terms at 4-weeks (C) and 12-weeks (D) and enrichment of Hallmark term at 4-weeks (E) after OA induction versus sham controls. LOGGY represents the -log10 of the false discovery rate (FDR <0.05) and Rich.Ratio the number of genes called to a set divided by the total number of genes in the set. Venn diagrams comparing the number significantly enriched hallmark pathways in early-stage OA development (shown in panel E) that are associated with STAT signaling and their overlap with pathways involving MAPK, PI3K, and SMAD signaling mechanisms (F)
Fig. 2
Fig. 2
Knee pressure pain and hindpaw withdrawal thresholds. Pressure pain threshold as measured by pressure application measurement of Veh-lip (control) (A), Clod-lip (B), STAT1i-lip (C), and STAT6i-lip (D) treatment at pre-surgical baseline (0), and 4-, 8- and 12-weeks post OA induction. Hindpaw withdrawal threshold as measured by electronic von Frey of Veh-lip (control) (E), Clod-lip (F), STAT1i-lip (G), and STAT6i-lip (H) treatment at pre-surgical baseline (0), and 4-, 8- and 12-weeks post OA induction. The y-axis represents force (grams, g) applied to the hindpaw before withdrawal and the x-axis time in weeks. Mean with 95% confidence intervals are displayed. Significant differences versus baseline (*) and versus control (Veh-lip) (+) are shown (P <0.05)
Fig. 3
Fig. 3
Synovial histopathology and synovitis grading during experimental OA development. Representative images of H&E-stained synovium at 4- and 12-weeks post surgery (A). The scale bar represents 100μm, the thick arrow; synovial hyperplasia, thin arrow; sub synovial infiltrate, star; angiogenesis, and arrowhead; synovial fibrosis. Individual measures of synovial histopathology at 4-weeks (●) and 12-weeks (◼) post surgery with comparisons to Veh-lip. The y-axis shows the total histopathological score (out of 18) and the x-axis the treatment group. Mean with 95% confidence intervals are displayed, **** p<0.0001, *** p<0.001, ** p<0.01, * p<0.05
Fig. 4
Fig. 4
Cartilage histopathology and degeneration grading during experimental OA development. Representative images of toluidine blue stained cartilage at 4- and 12-weeks post surgery (A). The scale bar represents 500μm, and the arrowhead areas of cartilage degeneration. Measures of cartilage degeneration in the medial and lateral tibial plateau and femoral condyles at 4-weeks (●) and 12-weeks (◼) post surgery. The y-axis shows the total histopathological score (out of 60) or individual histopathological score (out of 15) and the x-axis the treatment group. Mean with 95% confidence intervals are displayed
Fig. 5
Fig. 5
Macrophage quantification in the synovial intima and sub-intima. Representative confocal images of anti-CD68 stained (green) macrophages at 4- and 12-weeks post surgery (A). The scale bar represents 25μm. The white line separates the edge of the synovium and joint space and red line the interface between intima and subintima. White arrows highlight CD68 positive cells. Cell density in the intima 4- (●) (B) and 12-weeks (◼) (C) and subintima 4- (●) (D) and 12-weeks (◼) (E) post surgery with comparisons to Veh-lip. Mean with 95% confidence intervals are displayed, ** p<0.01, * p<0.05
Fig. 6
Fig. 6
Effects of macrophage-targeted treatment on co-cultured articular chondrocyte sGAG secretion and gene expression. sGAG production by chondrocytes after co-culture with synovial tissue explants from experimental OA knees treated with liposomal treatments for 4- (●) and 12-weeks (◼) (A). The Y-axis represents concentration (μg/mL) of sGAGs in media collected after 24 hours of co-culture, * p=0.03. Gene expression of naïve chondrocytes co-cultured with synovial explants from 4- (●) and 12-week (◼) animals (B). The y-axis represents fold change (2^-ΔΔCq) and the x-axis treatment group. Mean with 95% confidence intervals are displayed, **** p<0.0001, *** p<0.001, ** p<0.01, * p<0.05

References

    1. Schnitzer TJ, Ekman EF, Spierings EL, Greenberg HS, Smith MD, Brown MT, et al. Efficacy and safety of tanezumab monotherapy or combined with non-steroidal anti-inflammatory drugs in the treatment of knee or hip osteoarthritis pain. Ann Rheum Dis. 2015;74(6):1202–1211. doi: 10.1136/annrheumdis-2013-204905. - DOI - PubMed
    1. Neogi T, Guermazi A, Roemer F, Nevitt MC, Scholz J, Arendt-Nielsen L, et al. Association of Joint Inflammation With Pain Sensitization in Knee Osteoarthritis: The Multicenter Osteoarthritis Study. Arthritis Rheumatol Hoboken NJ. 2016;68(3):654–661. doi: 10.1002/art.39488. - DOI - PMC - PubMed
    1. Baker K, Grainger A, Niu J, Clancy M, Guermazi A, Crema M, et al. Relation of synovitis to knee pain using contrast-enhanced MRIs. Ann Rheum Dis. 2010;69(10):1779–1783. doi: 10.1136/ard.2009.121426. - DOI - PMC - PubMed
    1. Felson DT, Niu J, Neogi T, Goggins J, Nevitt MC, Roemer F, et al. Synovitis and the risk of knee osteoarthritis: the MOST Study. Osteoarthritis Cartil. 2016;24(3):458–464. doi: 10.1016/j.joca.2015.09.013. - DOI - PMC - PubMed
    1. Philpott HT, Birmingham TB, Pinto R, Primeau CA, Arsenault D, Lanting BA, et al. Synovitis Is Associated With Constant Pain in Knee Osteoarthritis: A Cross-sectional Study of OMERACT Knee Ultrasound Scores. J Rheumatol. 2021;49(1):89–97. doi: 10.3899/jrheum.210285. - DOI - PubMed

Substances