. 2024 Mar;14(3):e1630.
doi: 10.1002/ctm2.1630.

JCAD deficiency delayed liver regenerative repair through the Hippo-YAP signalling pathway

Affiliations

JCAD deficiency delayed liver regenerative repair through the Hippo-YAP signalling pathway

Li Zhang et al. Clin Transl Med. 2024 Mar.

Abstract

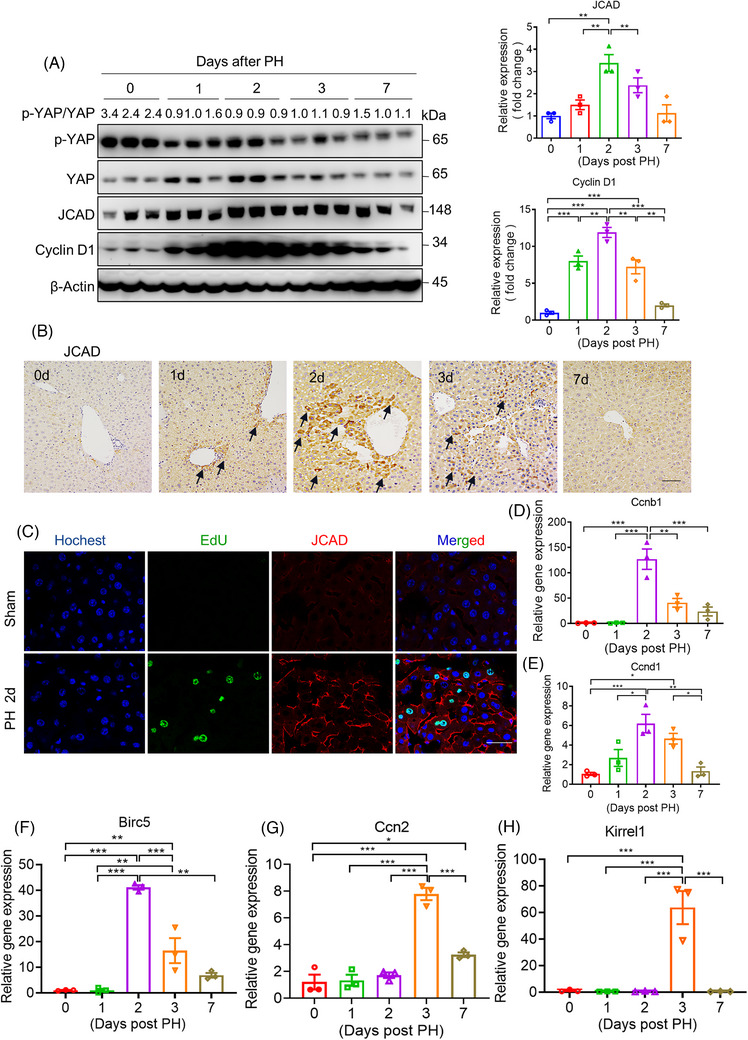
Background and aims: Liver regeneration retardation post partial hepatectomy (PH) is a common clinical problem after liver transplantation. Identification of key regulators in liver regeneration post PH may be beneficial for clinically improving the prognosis of patients after liver transplantation. This study aimed to clarify the function of junctional protein-associated with coronary artery disease (JCAD) in liver regeneration post PH and to reveal the underlying mechanisms.

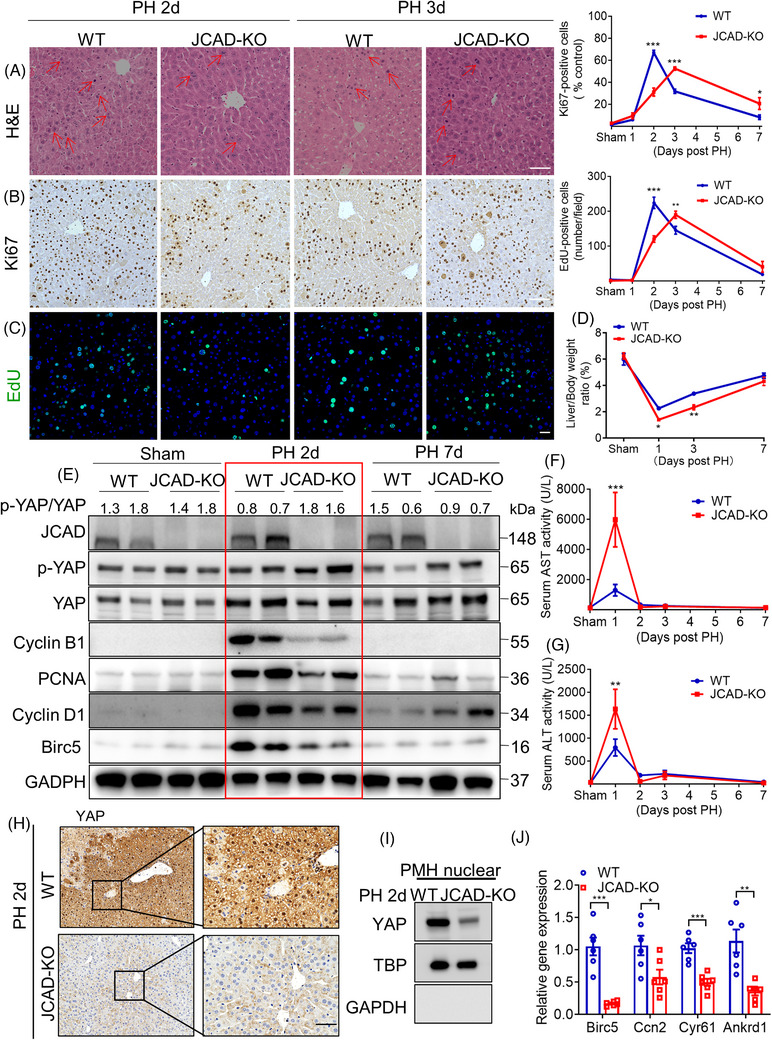
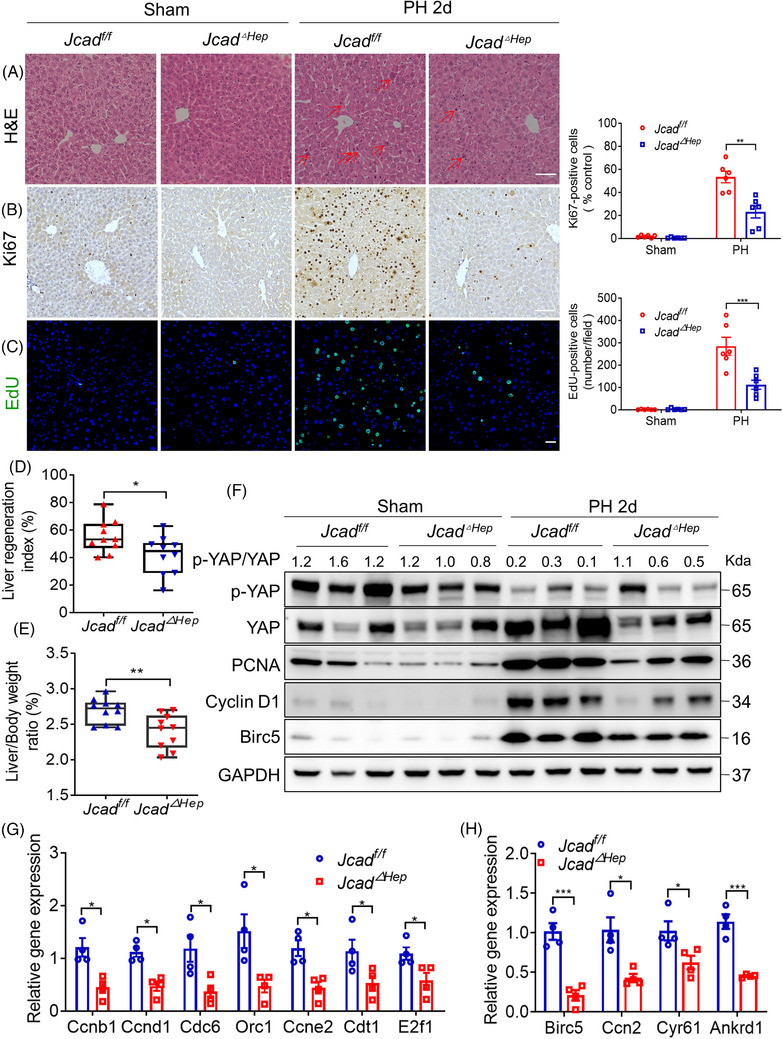
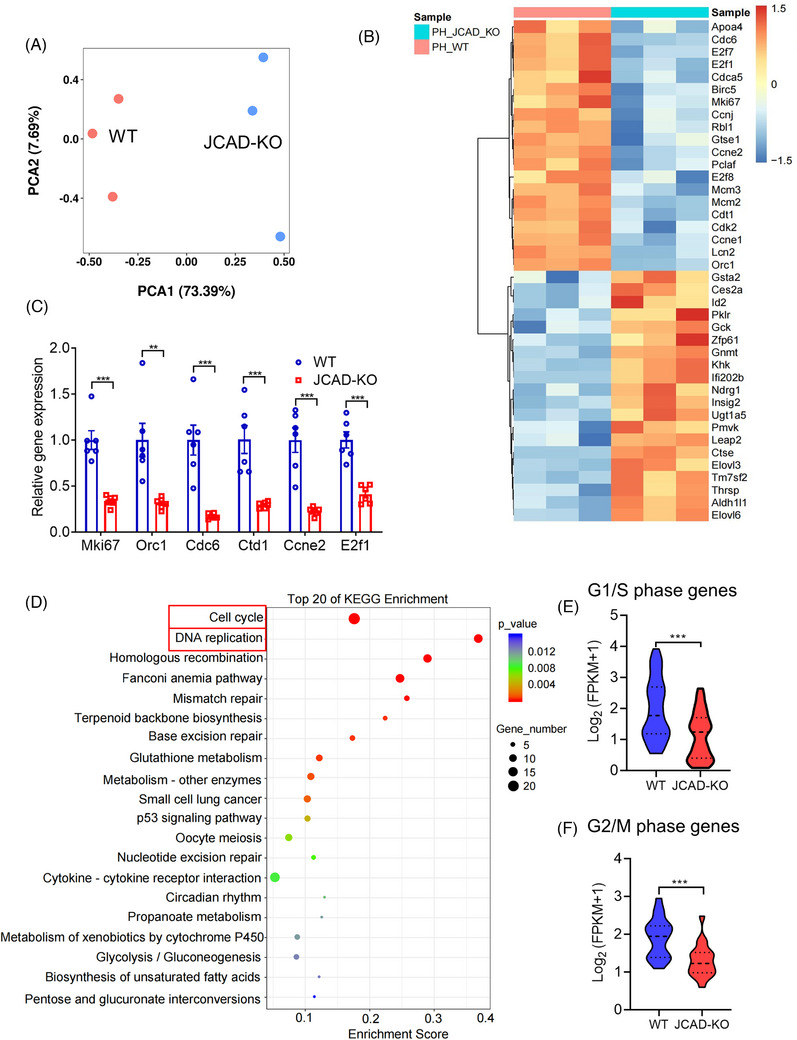
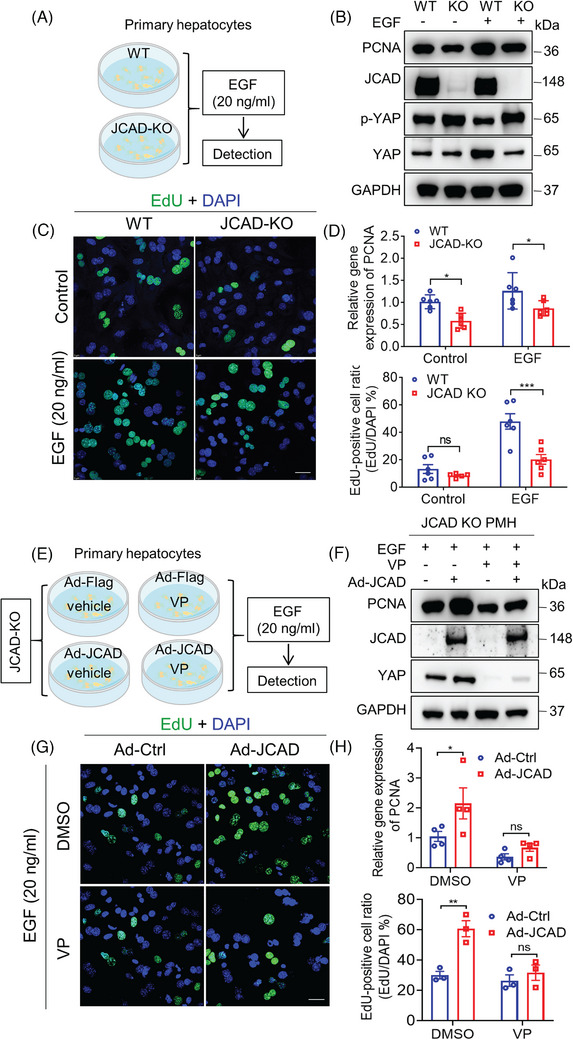
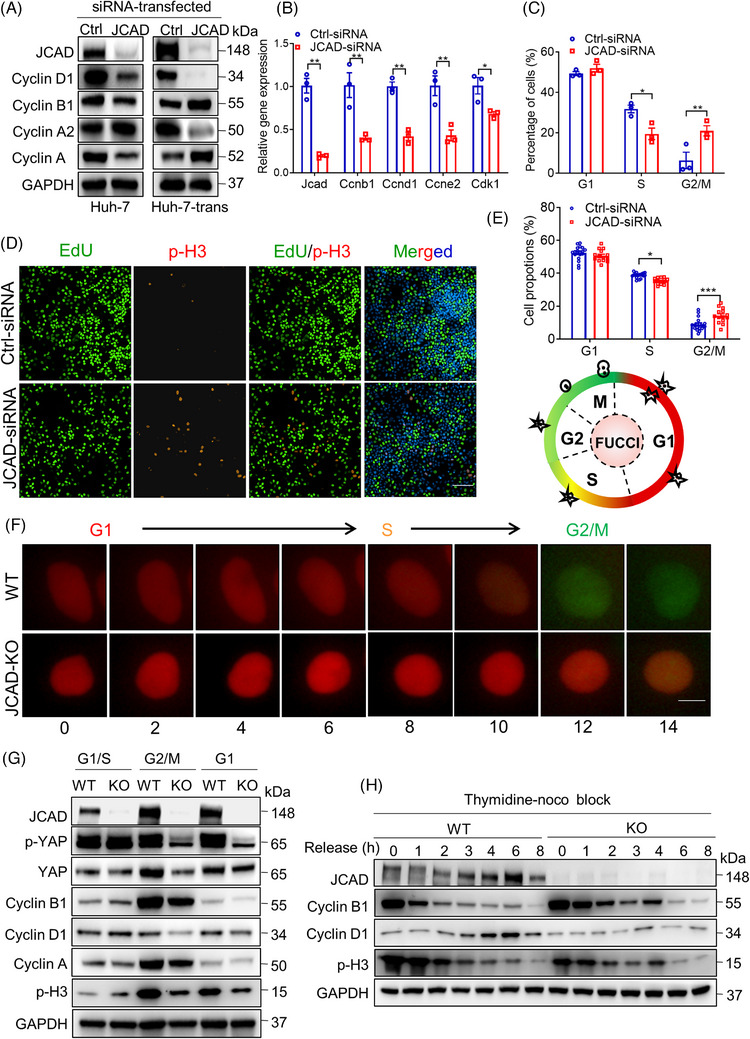
Methods: JCAD knockout (JCAD-KO), liver-specific JCAD-KO (Jcad△Hep) mice and their control group were subjected to 70% PH. RNA sequencing was conducted to unravel the related signalling pathways. Primary hepatocytes from KO mice were treated with epidermal growth factor (EGF) to evaluate DNA replication. Fluorescent ubiquitination-based cell cycle indicator (FUCCI) live-imaging system was used to visualise the phases of cell cycle.

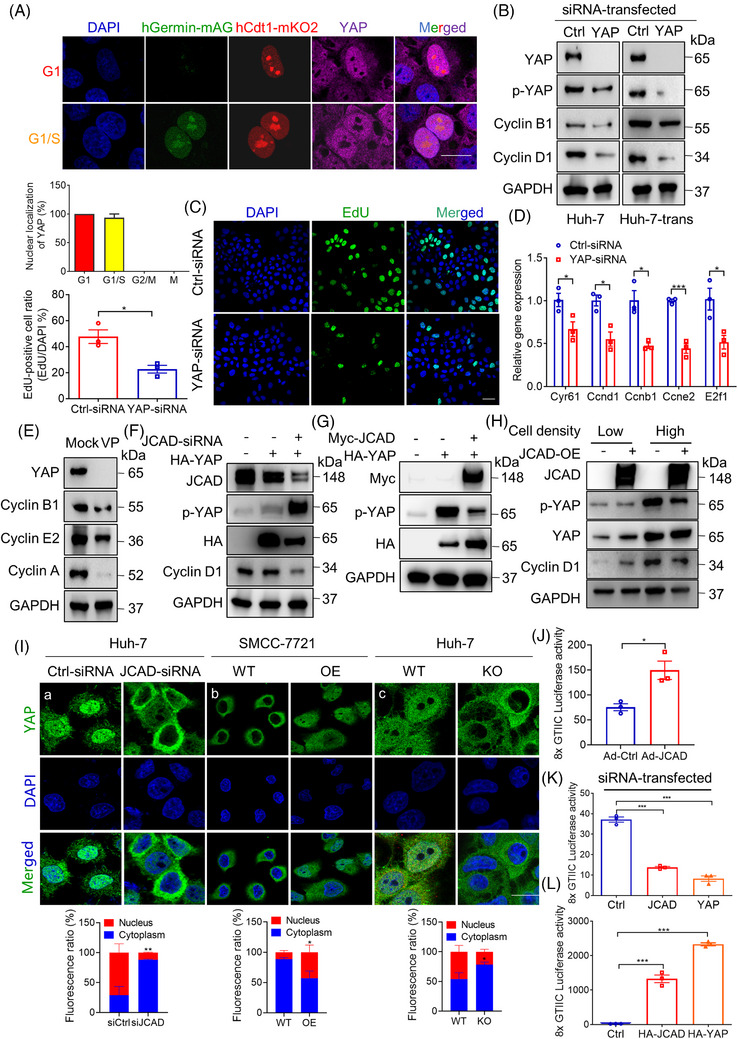
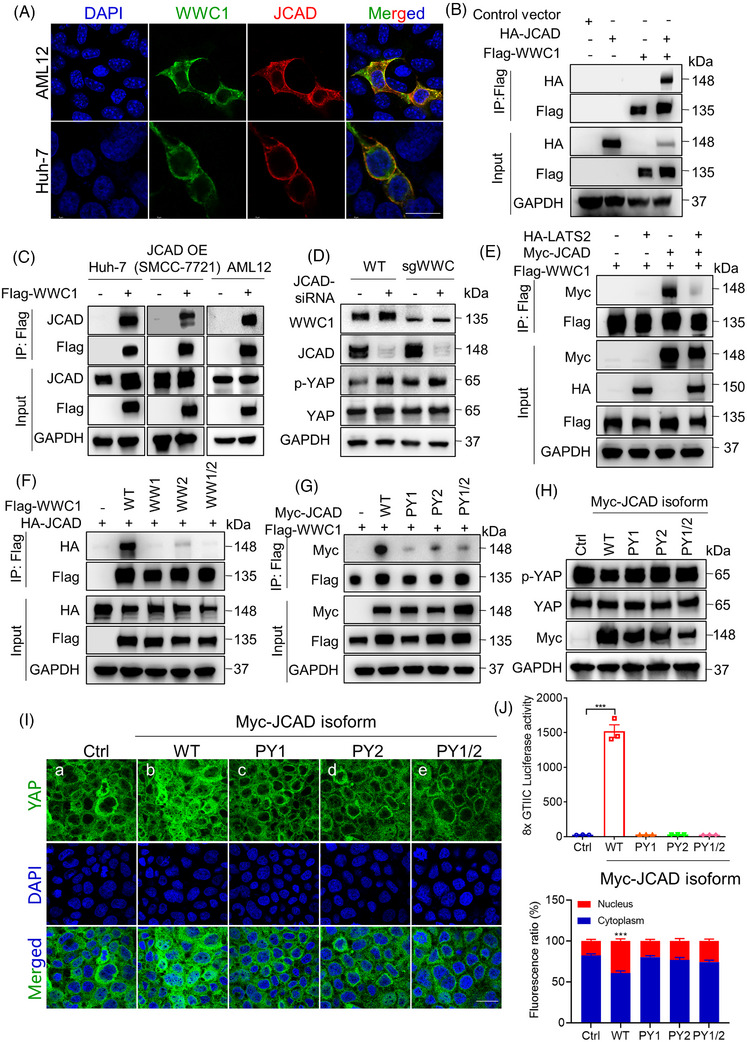
Results: Both global and liver-specific JCAD deficiency postponed liver regeneration after PH as indicated by reduced gene expression of cell cycle transition and DNA replication. Prolonged retention in G1 phase and failure to transition over the cell cycle checkpoint in JCAD-KO cell line was indicated by a FUCCI live-imaging system as well as pharmacologic blockage. JCAD replenishment by adenovirus reversed the impaired DNA synthesis in JCAD-KO primary hepatocyte in exposure to EGF, which was abrogated by a Yes-associated protein (YAP) inhibitor, verteporfin. Mechanistically, JCAD competed with large tumour suppressor 2 (LATS2) for WWC1 interaction, leading to LATS2 inhibition and thereafter YAP activation, and enhanced expression of cell cycle-associated genes.

Conclusion: JCAD deficiency led to delayed regeneration after PH as a result of blockage in cell cycle progression through the Hippo-YAP signalling pathway. These findings uncovered novel functions of JCAD and suggested a potential strategy for improving graft growth and function post liver transplantation.

Key points: JCAD deficiency leads to an impaired liver growth after PH due to cell division blockage. JCAD competes with LATS2 for WWC1 interaction, resulting in LATS2 inhibition, YAP activation and enhanced expression of cell cycle-associated genes. Delineation of JCADHippoYAP signalling pathway would facilitate to improve prognosis of acute liver failure and graft growth in living-donor liver transplantation.

Keywords: Hippo–YAP signalling pathway; JCAD; WWC1; cell cycle phase visualisation; liver regeneration.


Conflict of interest statement

The authors declare they have no competing financial interests associated with conduction of this investigation.

Figures

FIGURE 1
FIGURE 1
Junctional protein‐associated with coronary artery disease (JCAD) expression was increased in mice after partial hepatectomy (PH). Male wild‐type (WT) mice at 8‐week‐old were subjected to PH. (A) Western blotting was conducted to detect p‐YAP, Yes‐associated protein (YAP), JCAD and cyclin D1 levels in liver samples after 70% PH at different time points, and β‐actin was used as an internal control. Ratio of p‐YAP over YAP was presented as fold change of p‐YAP. Densitometric quantification of imaging bands for JCAD and cyclin D1 were shown (n = 3, one‐way analysis of variance [ANOVA] with Tukey's honest significant difference [HSD] test). (B) Representative immunohistochemical staining of JCAD at different time points after PH. The positive area was indicated by black arrow. Scale bars, 50 μm. (C) JCAD and 5‐ethynyl‐2′‐deoxyuridine (EdU) were co‐stained in liver samples 2 days post PH. Blue: nucleus; green: EdU; red: JCAD. Scale bars, 25 μm. (D–H) Relative gene expression of Ccnb1 (cyclin B1), Ccnd1 (cyclin D1), Birc5, Ccn2 (CTGF) and Kirrel1 was detected by quantitative reverse transcriptase polymerase chain reaction (RT‐qPCR) with β‐actin as the internal control (n = 3, one‐way ANOVA with Tukey's HSD test). All data are presented as mean ± standard error of mean (SEM), * p < .05, ** p < .01, *** p < .001 compared with control (Ctrl) group.
FIGURE 2
FIGURE 2
Junctional protein‐associated with coronary artery disease (JCAD) deficiency decelerated liver regeneration after partial hepatectomy (PH). (A–C) Representative micrographs of haematoxylin and eosin (H&E), Ki67 and 5‐ethynyl‐2′‐deoxyuridine (EdU) staining in wild‐type (WT) and JCAD knockout (JCAD‐KO) mice 2 or 3 days post PH (n = 6, two‐way analysis of variance [ANOVA] with Tukey's multiple comparisons). Mitotic hepatocytes were indicated by red arrows in the H&E‐stained liver sections. Ki67‐positive rate was presented as a ratio of positive cells/total cells in 100× filed. EdU‐positive cells were counted according to the fluorescent cells per 100× field. At least five fields were counted for each sample. Scale bars, 50 μm. (D) Ratio of liver over body weight was presented as ST/M (ST: harvested liver residue post PH; M, original mouse weight) (n = 6, two‐way ANOVA with Tukey's multiple comparisons). (E) Expression of proliferative cell nuclear antigen (PCNA), cyclin B1 and cyclin D1 in liver tissue of JCAD‐KO mice and WT mice 2 or 3 days post PH was determined by Western blotting (WB), and glyceraldehyde phosphate dehydrogenase (GAPDH) was used as a loading control. Serum aspartate aminotransferase (AST) (F) and alanine aminotransferase (ALT) (G) levels in JCAD‐KO and WT control post PH at indicated time points (n = 6, two‐way ANOVA with Tukey's multiple comparisons). (H) Immunohistochemical staining of Yes‐associated protein (YAP) in WT and JCAD‐KO mice 2 days post PH. Scale bars, 50 μm. (I) Nuclear expression of YAP in primary mouse hepatocytes (PMH) isolated in WT and JCAD‐KO mice 2 days post PH. (J) Relative expressions of YAP target genes in WT and JCAD‐KO mice 2 days post PH (n = 6, Student's t‐test). All data are presented as mean ± standard error of mean (SEM), * p < .05, ** p < .01, *** p < .001 compared to WT mice. TBP, TATA‐binding protein.
FIGURE 3
FIGURE 3
Hepatic junctional protein‐associated with coronary artery disease (JCAD) deficiency decelerated liver regeneration after partial hepatectomy (PH). (A–C) Representative micrographs of haematoxylin and eosin (H&E), Ki67 and 5‐ethynyl‐2′‐deoxyuridine (EdU) staining in liver sections of Jcadf/f and Jcad△Hep mice 2 days post PH. Mitotic hepatocytes were indicated by arrows in the H&E‐stained liver sections. Ki67 and EdU‐positive cells were counted in 100× fields. Scale bars, 50 μm (n = 6, two‐way analysis of variance [ANOVA] with Tukey's multiple comparisons). (D and E) Index of liver regeneration and ratio of liver over body weight were reduced in Jcad△Hep mice compared to JCADf/f post PH (n = 10, Student's t‐test). (F) Expression of proliferation‐related proteins in Jcadf/f and Jcad△Hep mice was measured by Western blotting (WB), and GAPDH was used as a loading control. (G) Hepatic expression of key genes involved in cell cycle, such as Ccnb1 and Ccnd1, was suppressed in Jcad△Hep mice (n = 4, Student's t‐test). (H) Relative expressions of Yes‐associated protein (YAP) target genes in JCADf/f and Jcad△Hep mice 2 days post PH (n = 4, Student's t‐test). All data are presented as mean ± standard error of mean (SEM). * p < .05, ** p < .01, *** p < .001 compared to JCADf/f mice.
FIGURE 4
FIGURE 4
RNA‐sequencing analysis of liver samples in wild‐type (WT) and junctional protein‐associated with coronary artery disease knockout (JCAD‐KO) mice 2 days post partial hepatectomy (PH). (A) Principal component analysis (PCA) was performed in RNA‐sequencing data of WT and JCAD‐KO mice 2 days post PH. (B) Heatmap of gene expression profiles post PH. (C) mRNA levels of genes involved in cell cycle were determined by reverse transcriptase polymerase chain reaction (RT‐PCR), and presented as relative expression levels using β‐actin as a house‐keeping gene control (n = 6, Student's t‐test). (D) Kyoto Encyclopedia of Genes and Genomes (KEGG) pathway analysis demonstrated that the terms associated with the cell cycle and DNA replication are the most enriched in the differential genes. (E and F) Cell cycle genes characteristic of the S phase (n = 51, Student's t‐test) and G2‐M transition (n = 18, Student's t‐test) were significantly downregulated by JCAD‐KO, the median (middle line), 25th and 75th percentile (dot plot) was indicated. All data are presented as mean ± standard error of mean (SEM). ** p < .01, *** p < .001 compared to WT mice.
FIGURE 5
FIGURE 5
Junctional protein‐associated with coronary artery disease (JCAD) sensitised primary hepatocytes to epidermal growth factor (EGF) stimulation via Hippo signalling pathway. (A) Primary hepatocytes were isolated from wild‐type (WT) and JCAD knockout (JCAD‐KO) mice and stimulated with 20 ng/mL murine EGF for 24 h. (B) Proliferating cell nuclear antigen (PCNA), p‐YAP and Yes‐associated protein (YAP) protein levels were determined by Western blot analysis. (C) Less 5‐ethynyl‐2′‐deoxyuridine (EdU)‐positive cells were stained with or without EGF stimulation. Ratio of EdU‐positive cells was presented as EdU‐positive cells over 4′,6‐diamidino‐2‐phenylindole (DAPI) per field (n = 6, two‐way analysis of variance [ANOVA] with Tukey's multiple comparisons). At least five fields were counted. (D) PCNA gene expression was less responding in JCAD‐KO hepatocytes with or without EGF (n = 6, two‐way ANOVA with Tukey's multiple comparisons). (E) The cell‐processing flow diagram is described as follows. Primary hepatocytes were isolated from JCAD‐KO mice and infected with either control adenovirus (Ad‐Ctrl) or JCAD expressing adenovirus (Ad‐JCAD) for 48 h, at 24 h post infection, 20 ng/mL EGF with or without verteporfin (VP) (5 μM) was added for another 24 h. (F–H) VP abolished increased expression of PCNA and EdU incorporation induced by Ad‐JCAD infection (H, n = 4; G, n = 3, two‐way ANOVA with Tukey's multiple comparisons). At least five images were taken for each treatment. Scale bars, 25 μm. Representative images were chosen from three independent experiments. All data are presented as mean ± standard error of mean (SEM), * p < .05, ** p < .01, *** p < .001 compared to control group.
FIGURE 6
FIGURE 6
Junctional protein‐associated with coronary artery disease (JCAD) deficiency resulted in mitosis blockage. (A) Western blot of cell cycle‐associated proteins in cell lines transfected with JCAD‐siRNA. (B) Expression of genes associated with cell cycle checkpoint of Huh‐7 cells transfected with JCAD‐siRNA (n = 3, Student's t‐test). (C) Distribution of cell cycle phases was measured by flow cytometry followed by propidium iodide (PI) staining (n = 3, two‐way analysis of variance [ANOVA] with Tukey's multiple comparisons). (D) Representative images of 5‐ethynyl‐2′‐deoxyuridine (EdU) and phosphohistone 3 (p‐H3) staining. Scale bars, 100 μm. (E) Phase proportion of cell cycle was depicted by p‐H3 (G2/M) and EdU (S) staining after siRNA transfection (n = 14, two‐way ANOVA with Tukey's multiple comparisons). (F) Live imaging of cell cycle phases in a high content screening modality for JCAD knockout (JCAD‐KO) Huh‐7 cells transfected with a fluorescent ubiquitination‐based cell cycle indicator (FUCCI) system. Cell cycle transition was impeded in JCAD‐KO cells, and images were taken every 2 h for total of 24 h (data not shown for shots taken 16–24 h for next round of cell cycle entrance in wild‐type [WT] group, red: G1 phase, yellow: S phase, green: G2/M phase). Scale bar, 10 μm. (G) Entrance into G2/M phase of JCAD‐KO Huh‐7 cells was postponed after being released from S phase synchronisation by double thymidine block. (H) JCAD‐KO cells exhibited prolonged expression of cyclin B1 and p‐H3, and cyclin D1 failed to increase from the basic level after released from G2/M phase synchronisation by thymidine–nocodazole block. Ccnb1: cyclin B1; Ccnd1: cyclin D1; Ccne1: cyclin E1; Cdk1: cyclin‐dependent kinase‐1. Every experiment was repeated for three times. All data are presented as mean ± standard error of mean (SEM), compared to control (Ctrl) group, * p < .05, ** p < .01.
FIGURE 7
FIGURE 7
Junctional protein‐associated with coronary artery disease (JCAD) modulate cell cycle transition in a Hippo–YAP pathway‐dependent manner. (A) Yes‐associated protein (YAP) nuclear localisation was mainly distributed in G1 and S phase. Huh‐7 cells transfected with fluorescent ubiquitination‐based cell cycle indicator (FUCCI) were stained with YAP, and YAP nuclear localisation were visualised in different phases of cell cycle by FUCCI live imaging. Scale bars, 20 μm. (B) Western blot analysis of proteins involved in cell cycle in Huh‐7 and Huh‐7‐trans cells transfected with control or YAP‐siRNA. (C) Cell transfected with YAP‐siRNA exhibited reduced 5‐ethynyl‐2′‐deoxyuridine (EdU) staining. EdU‐positive cell ratio was presented by EdU‐positive cells/4′,6‐diamidino‐2‐phenylindole (DAPI) per field (n = 3, Student's t‐test). Scale bars, 50 μm. (D) Gene expression of cell cycle checkpoint‐related proteins in Huh‐7 cells transfected with YAP‐siRNA (n = 3, Student's t‐test). (E) YAP inhibitor verteporfin (VP) reduced expression of cell cycle‐related proteins. Huh‐7 cells were treated with 5 μM VP for 24 h. (F) Huh‐7 cells were transfected with JCAD‐siRNA or HA‐YAP, and expression of Hippo signal pathway proteins was determined. (G) HA‐YAP were transfected with or without Myc‐JCAD to Huh‐7 to modulate p‐YAP activity. (H) JCAD‐OE cells were plated at different cell density, and key proteins in the Hippo signal pathway were determined by Western blot analysis. (I) YAP nuclear and cytosol distribution was determined in cells transfected with JCAD‐siRNA (a) or stably overexpressing JCAD (b) or with JCAD stably knocked‐out (c). At least five fields for each treatment were counted. Scale bars, 20 μm. (J–L) JCAD enhanced YAP transcriptional activity. Wild‐type (WT) mouse primary hepatocyte infected with JCAD expressing adenovirus (Ad‐JCAD) (J) and Huh‐7 cells were transiently transfected with transcriptional enhanced associate domain (TEAD)‐responsive 8xGTIIC luciferase reporter gene (Renilla luciferase reporter plasmid pRL‐SV40 as an internal control) together with JCAD‐siRNA (K) or HA‐JCAD plasmid (L), and YAP‐siRNA or HA‐YAP was transfected as a positive control (n = 3, Student's t‐test in (J) and one‐way analysis of variance [ANOVA] with Tukey's HSD in (K) and (L)). Each experiment was repeated for three times. All data are presented as mean ± standard error of mean (SEM), compared with control (Ctrl) group, * p < .05, ** p < .01, *** p < .001.
FIGURE 8
FIGURE 8
Junctional protein‐associated with coronary artery disease (JCAD) modulated the Hippo signalling pathway through interacting with WWC1. (A) JCAD and WWC1 were co‐localised in cytoplasmic membrane and proximity. AML12 and Huh‐7 cells were transfected with Flag‐WWC1 and HA‐JCAD; Flag‐tag and HA‐tag were stained in green and red, respectively. Scale bar, 20 μm. (B) HEK293T cells were transiently transfected with HA‐JCAD and Flag‐WWC1. Co‐immunoprecipitation (Co‐IP) analysis was performed. (C) Flag‐WWC1 was transfected in Huh‐7 (which highly expressed JCAD), SMCC‐7721 cells with JCAD stably overexpression as well as AML12 cells, and Flag‐tag was immunoprecipitated followed by JCAD immunoblotting. (D) HEK293A cells with WWC stably knocked‐down were transiently transfected with JCAD‐siRNA; and p‐YAP was determined by Western blot analysis. (E) Large tumour suppressor 2 (LATS2) competed with JCAD for binding to WWC1. HEK293T cells were transfected with Myc‐JCAD, HA‐LATS2 and Flag‐WWC1, followed by Co‐IP assay. (F) WWC1 interacted with JCAD at the WW domain in WWC1. WWC1 cells with mutations at WW1, WW2 or WW1/2 domains were transfected together with HA‐JCAD; and Co‐IP assay was conducted against Flag‐tag. (G) WWC1 interacted with JCAD at the PPxY domain in JCAD. PY1, PY2 or PY1/2‐mutated Myc‐JCAD were co‐transfected with Flag‐WWC1; and Co‐IP assay was conducted against Flag‐tag. (H–J) Huh‐7 cell was transfected with either wild type (WT) (b), PY1 (c), PY2 (d) or PY1/2 (e) mutant of Myc‐JCAD, and immunoblot of Yes‐associated protein (YAP) and p‐YAP (H) immunofluorescent assay of YAP (I) and 8xGTIIC dual luciferase assay (J) were conducted (n = 3, one‐way analysis of variance [ANOVA] with Tukey's HSD). Scale bars, 20 μm. All data are presented as mean ± standard error of mean (SEM), compared to control (Ctrl) group, *** p < .001.

References

    1. Chen X, Murad M, Cui YY, et al. miRNA regulation of liver growth after 50% partial hepatectomy and small size grafts in rats. Transplantation. 2011;91(3):293‐299. - PubMed
    1. Rela M, Reddy MS. Living donor liver transplant (LDLT) is the way forward in Asia. Hepatol Int. 2017;11(2):148‐151. - PubMed
    1. Ghobrial RM, Freise CE, Trotter JF, et al. Donor morbidity after living donation for liver transplantation. Gastroenterology. 2008;135(2):468‐476. - PMC - PubMed
    1. Adam R, Karam V, Delvart V, et al. Evolution of indications and results of liver transplantation in Europe. A report from the European Liver Transplant Registry (ELTR). J Hepatol. 2012;57(3):675‐688. - PubMed
    1. Abecassis MM, Fisher RA, Olthoff KM, et al. Complications of living donor hepatic lobectomy—a comprehensive report. Am J Transplant. 2012;12(5):1208‐1217. - PMC - PubMed

Publication types

MeSH terms

Substances