

A novel growth-friendly system alleviates pulmonary dysplasia in early-onset scoliosis combined with thoracic insufficiency syndrome: Radiological, pathological, and transcriptomic assessments
- PMID: 38509966
- PMCID: PMC10951595
- DOI: 10.1016/j.heliyon.2024.e27887
A novel growth-friendly system alleviates pulmonary dysplasia in early-onset scoliosis combined with thoracic insufficiency syndrome: Radiological, pathological, and transcriptomic assessments
Abstract
Background: The posterior procedure utilizing growth-friendly techniques is the golden standard for patients with early-onset scoliosis combined with thoracic insufficiency syndrome (EOS + TIS). Pulmonary hypoplasia is the main cause of dying prematurely in the EOS + TIS. This study assessed the therapeutic impact of a novel growth-friendly system on the pulmonary development of piglet's EOS + TIS model.
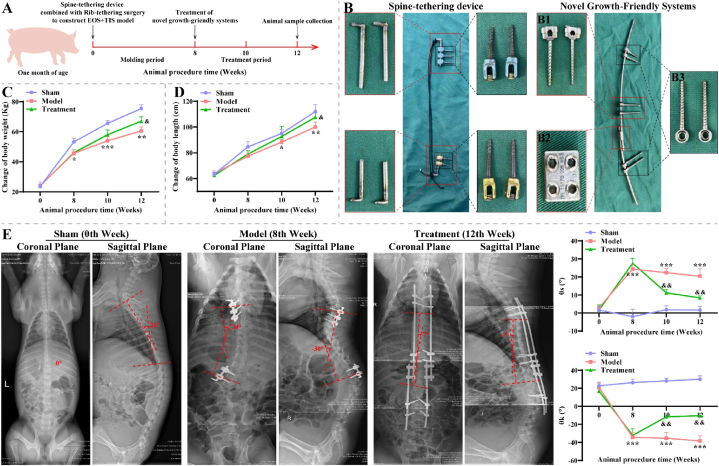
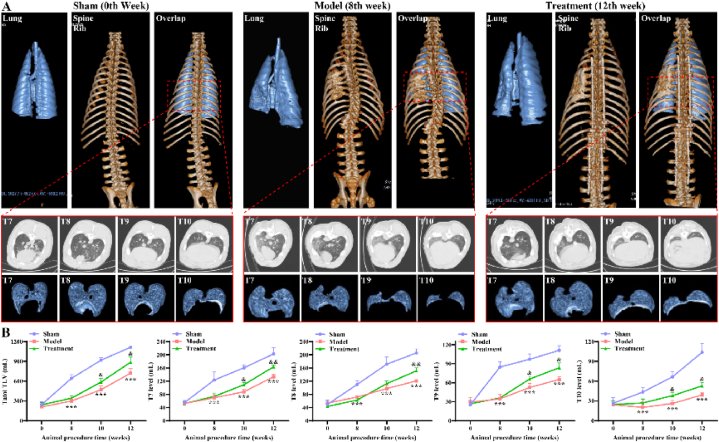
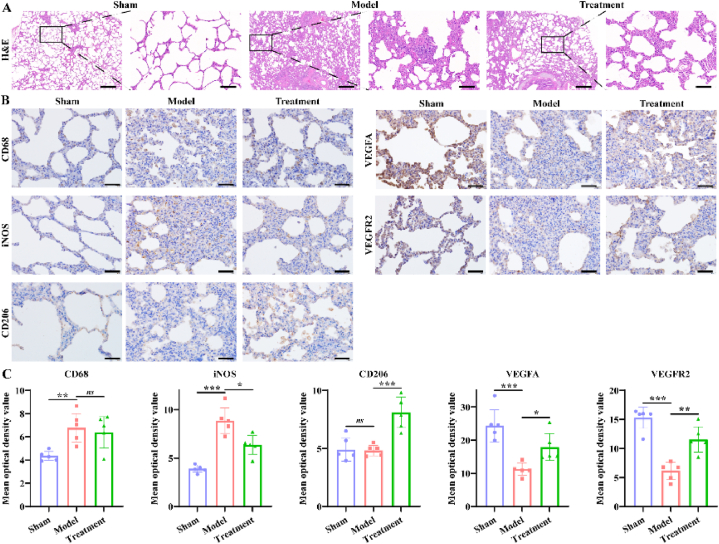
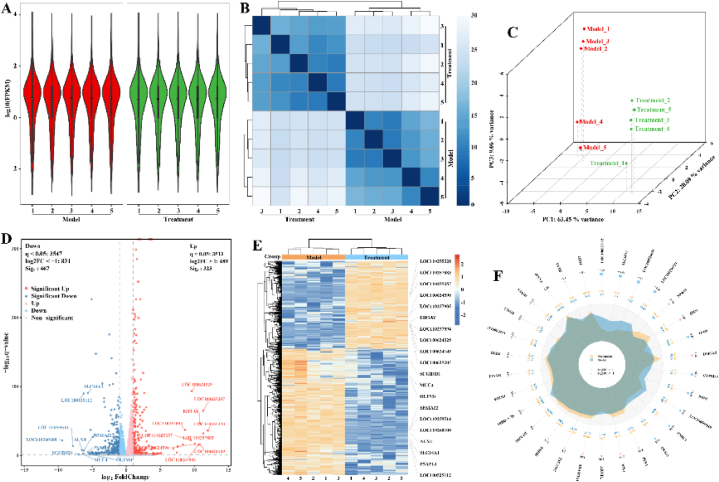
Methods: The animal procedure period lasts 12 weeks, of which the construction of the EOS + TIS was performed at 0-8 weeks, and implantation of a novel growth-friendly system was applied at 8-12 weeks. During the animal procedure, X-rays and CT were performed to observe scoliosis, thorax, and lungs. After 12 weeks, pathological changes in lung tissue were assessed using HE and IHC staining. RNA-seq characterized novel growth-friendly system-associated differentially expressed genes (DEGs) and validated using RT-qPCR, western blotting, and IHC.
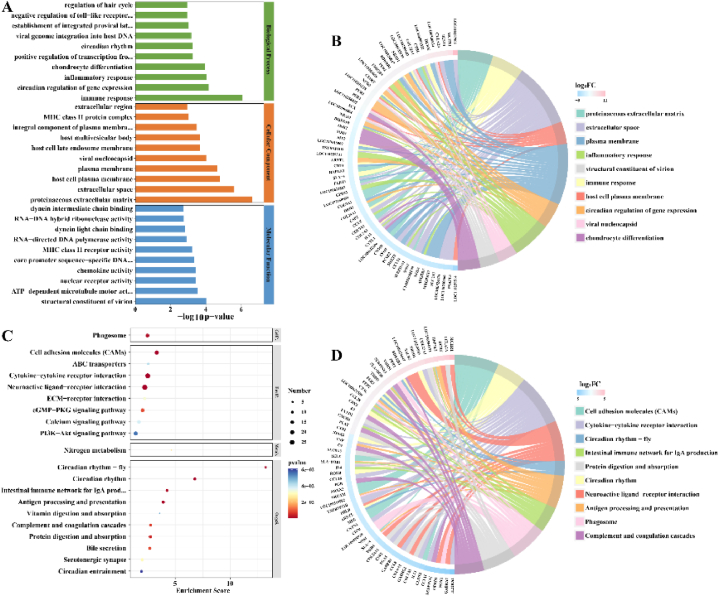
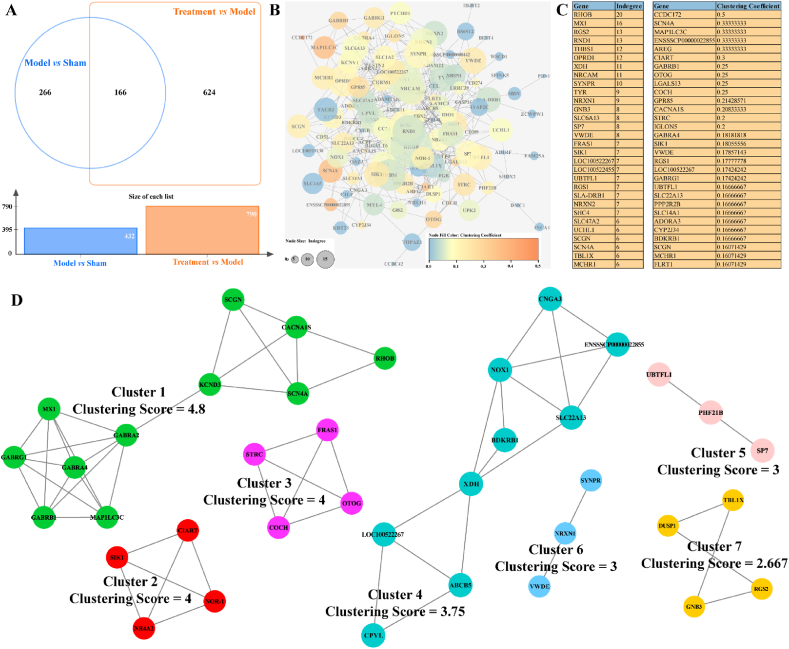
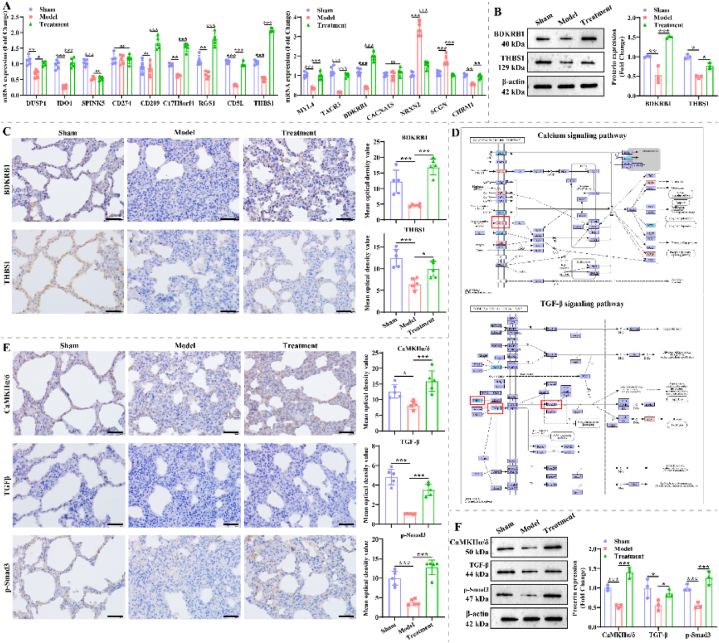
Results: Implantation of the novel growth-friendly system increased body weight, body length, and total lung volume, as well as decreased the coronal and sagittal Cobb angles for the EOS + TIS model. It also ameliorated EOS + TIS-induced thickening of the alveolar wall, increased alveolar spaces, and decreased alveolar number and diameter. In lung tissue, a total of 790 novel growth-friendly system-associated DEGs were identified, and they were mainly involved in the regulation of immune, inflammatory, calcium transport, and vascular development. Among these DEGs, BDKRB1, THBS1, DUSP1, IDO1, and SPINK5 were hub genes, and their differential expression was consistent with RNA-seq results in lung tissues.
Conclusion: The novel growth-friendly system has mitigated scoliosis and pulmonary hypoplasia in the EOS + TIS model. We further elucidate the molecular mechanisms underlying the amelioration of pulmonary hypoplasia.
Keywords: Early-onset scoliosis; Growing rod; Pathology; Pulmonary hypoplasia; Radiology; Thoracic insufficiency syndrome; Transcriptomics.
© 2024 The Authors.
Conflict of interest statement
The authors declare that they have no known competing financial interests or personal relationships that could have appeared to influence the work reported in this paper.
Figures
Similar articles
-
A porcine model of early-onset scoliosis combined with thoracic insufficiency syndrome: Construction and transcriptome analysis.Gene. 2023 Mar 30;858:147202. doi: 10.1016/j.gene.2023.147202. Epub 2023 Jan 13. Gene. 2023. PMID: 36646188
-
Quality of Life Among Patients with Early-Onset Scoliosis Treated with Magnetically Controlled Growing Rods-Early-Term Results.World Neurosurg. 2021 Nov;155:e522-e528. doi: 10.1016/j.wneu.2021.08.096. Epub 2021 Aug 28. World Neurosurg. 2021. PMID: 34464772
-
Complications in using the vertical expandable prosthetic titanium rib (VEPTR) in children.J Pediatr Surg. 2016 Nov;51(11):1747-1750. doi: 10.1016/j.jpedsurg.2016.06.014. Epub 2016 Jun 26. J Pediatr Surg. 2016. PMID: 27397045 Clinical Trial.
-
Early-onset scoliosis: a narrative review.EFORT Open Rev. 2022 Aug 4;7(8):599-610. doi: 10.1530/EOR-22-0040. EFORT Open Rev. 2022. PMID: 35924646 Free PMC article. Review.
-
Complications of growth-sparing surgery in early onset scoliosis.Spine (Phila Pa 1976). 2010 Dec 1;35(25):2193-204. doi: 10.1097/BRS.0b013e3181f070b5. Spine (Phila Pa 1976). 2010. PMID: 21102293 Review.
Cited by
-
Mechanical stress facilitates calcium influx and growth of alveolar epithelial cells via activation of the BDKRB1/Ca2+/CaMKII/MEK1/ERK axis.Respir Res. 2025 Apr 28;26(1):168. doi: 10.1186/s12931-025-03240-7. Respir Res. 2025. PMID: 40296124 Free PMC article.
-
Validation of the Korean Version of the 24-Item Early-Onset Scoliosis Questionnaire: A Multicenter Study from the Korean Research Society of Spinal Deformity.Clin Orthop Surg. 2025 Feb;17(1):123-129. doi: 10.4055/cios24210. Epub 2025 Jan 14. Clin Orthop Surg. 2025. PMID: 39912072 Free PMC article.
-
Thrombospondin-1 Airway Expression and Thrombospondin-1 Gene Variants Are Associated with Bronchopulmonary Dysplasia in Extremely Low-Birth-Weight Infants: A Pilot Study.Children (Basel). 2025 Mar 28;12(4):424. doi: 10.3390/children12040424. Children (Basel). 2025. PMID: 40338233 Free PMC article.
References
-
- Karol L.A. The natural history of early-onset scoliosis. Journal of pediatric orthopedics. 2019;39(6):S38–s43. Supplement 1 Suppl 1. - PubMed
LinkOut - more resources
Full Text Sources
Research Materials
Miscellaneous
