. 2024 Mar 9;10(6):e27049.
doi: 10.1016/j.heliyon.2024.e27049. eCollection 2024 Mar 30.

Identification of circadian rhythm-related gene classification patterns and immune infiltration analysis in heart failure based on machine learning

Affiliations

Identification of circadian rhythm-related gene classification patterns and immune infiltration analysis in heart failure based on machine learning

Xuefu Wang et al. Heliyon. .

Abstract

Background: Circadian rhythms play a key role in the failing heart, but the exact molecular mechanisms linking changes in the expression of circadian rhythm-related genes to heart failure (HF) remain unclear.

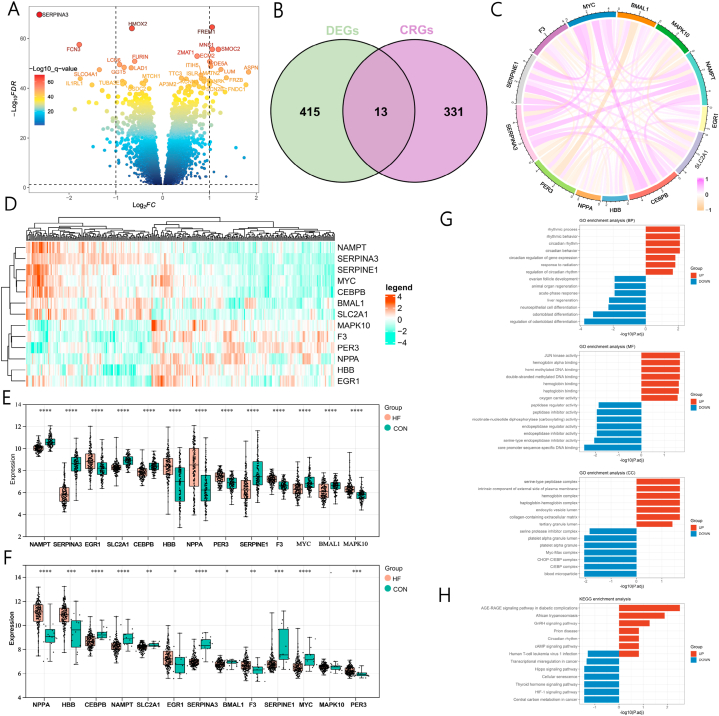
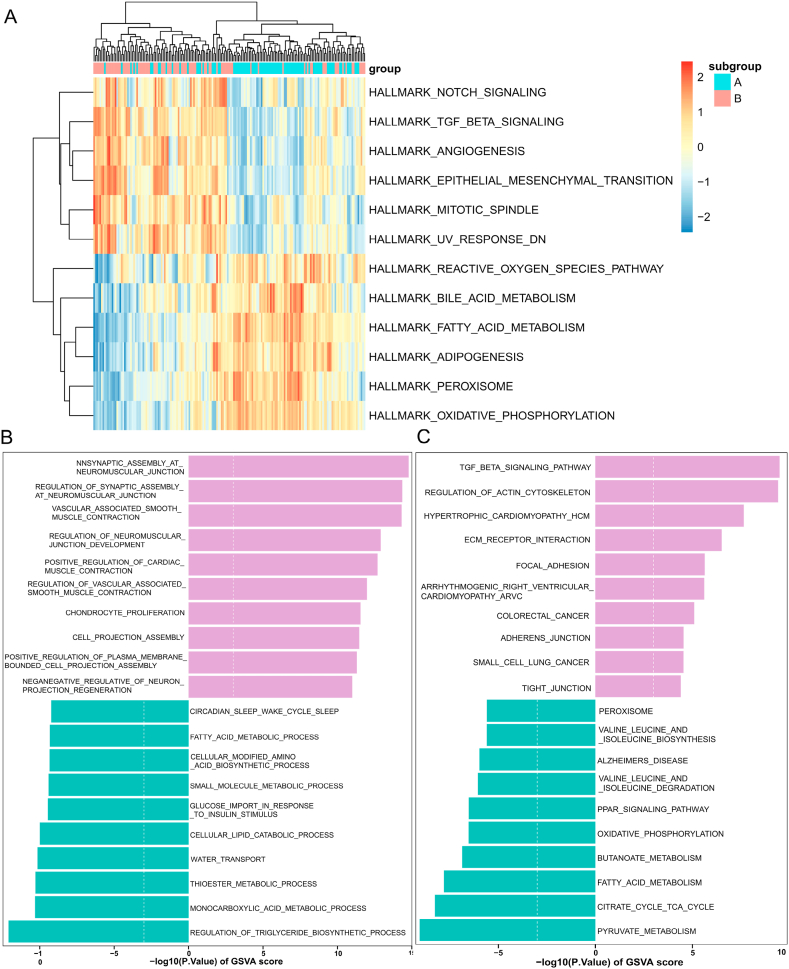
Methods: By intersecting differentially expressed genes (DEGs) between normal and HF samples in the Gene Expression Omnibus (GEO) database with circadian rhythm-related genes (CRGs), differentially expressed circadian rhythm-related genes (DE-CRGs) were obtained. Machine learning algorithms were used to screen for feature genes, and diagnostic models were constructed based on these feature genes. Subsequently, consensus clustering algorithms and non-negative matrix factorization (NMF) algorithms were used for clustering analysis of HF samples. On this basis, immune infiltration analysis was used to score the immune infiltration status between HF and normal samples as well as among different subclusters. Gene Set Variation Analysis (GSVA) evaluated the biological functional differences among subclusters.

Results: 13 CRGs showed differential expression between HF patients and normal samples. Nine feature genes were obtained through cross-referencing results from four distinct machine learning algorithms. Multivariate LASSO regression and external dataset validation were performed to select five key genes with diagnostic value, including NAMPT, SERPINA3, MAPK10, NPPA, and SLC2A1. Moreover, consensus clustering analysis could divide HF patients into two distinct clusters, which exhibited different biological functions and immune characteristics. Additionally, two subgroups were distinguished using the NMF algorithm based on circadian rhythm associated differentially expressed genes. Studies on immune infiltration showed marked variances in levels of immune infiltration between these subgroups. Subgroup A had higher immune scores and more widespread immune infiltration. Finally, the Weighted Gene Co-expression Network Analysis (WGCNA) method was utilized to discern the modules that had the closest association with the two observed subgroups, and hub genes were pinpointed via protein-protein interaction (PPI) networks. GRIN2A, DLG1, ERBB4, LRRC7, and NRG1 were circadian rhythm-related hub genes closely associated with HF.

Conclusion: This study provides valuable references for further elucidating the pathogenesis of HF and offers beneficial insights for targeting circadian rhythm mechanisms to regulate immune responses and energy metabolism in HF treatment. Five genes identified by us as diagnostic features could be potential targets for therapy for HF.

Keywords: Bioinformatics; Circadian rhythm; Heart failure; Immune infiltration; Machine learning; Unsupervised clustering.


Conflict of interest statement

The authors declare that they have no known competing financial interests or personal relationships that could have appeared to influence the work reported in this paper.

Figures

Fig. 1
Fig. 1
Flowchart of this study.
Fig. 2
Fig. 2
Identification and functional enrichment analysis of DE-CRGs. (A) DEGs between HF and normal samples. (B) The common genes of DEGs and CRGs in HF. (C) Correlation chord diagram of DE-CRGs. Red represents positive correlations, and orange represents negative correlations. (D) Heatmap showing the expression levels of 13 CRGs in HF and control samples. (E, F) Boxplots and scatter plots displaying the expression differences of thirteen CRGs in GSE57338 and GSE5406. (G) GO enrichment analysis of DE-CRGs. (H) KEGG enrichment analysis of DE-CRGs. DE-CRGs, differentially expressed circadian rhythm-related genes; CRGs: circadian rhythm-related gene; DEGs: differentially expressed genes; HF: heart failure; GO: gene ontology; KEGG: Kyoto Encyclopedia of Genes and Genomes. *P < 0.05, **P < 0.01, ***P < 0.001. (For interpretation of the references to colour in this figure legend, the reader is referred to the Web version of this article.)
Fig. 3
Fig. 3
Multiple machine learning methods for screening circadian rhythm-related diagnostic biomarkers. (A) Random forest tree. (B) Gini importance measure. (C) SVM-RFE algorithm selects feature genes. N = 13 represents the optimal number of selectable variables. (D) Z-score changes during Boruta operation. Green represents confirmed features, and blue represents the importance of minimum, average, and maximum shadow features, respectively. (E) MZSA distinguishes important and non-important features. Yellow is determined to be an important feature. (F) XGBoost ranks the importance of genes. (G) ROC curve evaluating the accuracy of the XGBoost model. (H) Intersection of genes selected by the four machine learning algorithms. (I) Fold change of genes with potential diagnostic value. MZSA, maximum Z score among shadow attributes. (For interpretation of the references to colour in this figure legend, the reader is referred to the Web version of this article.)
Fig. 4
Fig. 4
Development and validation of CRGs as diagnostic features for HF. (A) Forest plot of multivariable logistic regression analysis. (B) Nomogram showing the probability of HF occurrence based on nine genes. (C) Calibration curve validation of the Nomogram. (D, E) Expression levels of nine diagnostic markers in two external datasets. *P < 0.05 **P < 0.01 ***P < 0.001. (F) Receiver operating characteristic (ROC) curves of diagnostic markers that showed expression differences in both external datasets. (G) ROC curves showing the diagnostic value of five feature genes in the GSE26887 dataset. (H) ROC curves of the five feature genes in the GSE79962 dataset.
Fig. 5
Fig. 5
SsGSEA analysis of HF and normal samples. (A) Heatmap demonstrating the difference in immune cell infiltration in HF and normal samples (B) Infiltration scores of 28 immune cells in cardiac tissue from HF patients and normal. ns = not significant, *p < 0.05, **p < 0.01, ***p < 0.001 (C, D) The best variable with a non-zero coefficient in the immune cell subpopulation was obtained by LASSO regression. ssGSEA ,Single Sample Gene Set Enrichment Analysis.
Fig. 6
Fig. 6
(A–E) Correlation between immune cells and SERPINA3, NAMPT, NPPA, MAPKI0 and SLC2A1.
Fig. 7
Fig. 7
Unsupervised clustering analysis based on DE-CRGs expression spectrum. (A) Consensus clustering matrix for k = 2, defining two different subtypes of circadian expression patterns. (B) Cumulative distribution function (CDF) curves for k = 1–9. (C) CDF delta area curves. (D) Consensus clustering scores when k is 2–9. (E) Principal component analysis (PCA) visualization of the sample distribution of the two clusters. (F) Expression of the 13 CRGs in the two clusters. (G) Gene set variance analysis (GSVA) based on the HALLMARK gene set. DE-CRGs, differentially expressed circadian rhythm-related genes.
Fig. 8
Fig. 8
Identification of HF gene subgroups based on DEGs associated with CRG subtypes. (A) Heatmap of differential expression of DEGs between the two CRG subtypes. (B) GSEA enrichment analysis of DEGs between two CRG subtypes. (C) Heatmap of NMF clustering at k = 2. (D) Distribution of cophenetic, residuals, RSS, silhouette, Var and dispersion with a rank of 2–10. (E) PCA plots showing differences in sample clustering between two HF gene subgroups. (F) Variation in gene subgroups for two different clustering methods. (G) Expression box plots and scatter plots of 13 CRGs. (H) Immune cell infiltration scores in 28 between the two subgroups. NMF, non-negative matrix decomposition; GSEA, gene set enrichment analysis.
Fig. 9
Fig. 9
GSVA analysis to assess biological function and pathway differences between the two subgroups. (A) GSVA analysis based on the HALLMARK gene set. (C) Biological process analysis based on the GO gene set. (C) Enrichment pathway based on the KEGG pathway. GSVA, genomic variation analysis.
Fig. 10
Fig. 10
Identification of hub genes between the two subgroups by the WGCNA method. (A) The network constructed when power index 6 was chosen as the appropriate soft threshold was more consistent with a scale-free topology. (B) Co-expression networks were constructed based on the optimal soft threshold to divide the genes into 11 different modules. (C) Cluster tree and correlation heat map between modules. (D) Correlation and significance between modules and features. the highest correlation was found between MEblack and features. (E) Scatter plot of module feature genes in the black module. mm and gs were positively correlated. (F) Protein-protein interaction network (PPI) ranking of gene importance. (G, H) GO and KEGG enrichment analysis of the top 50 significant genes in the PPI network. mm, module membership; GS, gene significance; GO, gene ontology; KEGG, Kyoto Encyclopedia of Genes and Genomes.
Fig. 11
Fig. 11
Association of hub genes with cardiovascular disease, evidence from the CTD database. (A–J) Relationship between expression levels of AQP4, KALRN, LRCC7, DLG1, MAP2, NPPA, ERBB4, NRG1, NTN1, and GRIN2A and inferred scores of cardiovascular disease. CTD, Comparative Toxicogenomics Database.

Similar articles

Cited by

References

    1. McDonagh T.A., Metra M., Adamo M., Gardner R.S., Baumbach A., Böhm M., Burri H., Butler J., Čelutkienė J., Chioncel O., Cleland J.G.F., Coats A.J.S., Crespo-Leiro M.G., Farmakis D., Gilard M., Heymans S., Hoes A.W., Jaarsma T., Jankowska E.A., Lainscak M., Lam C.S.P., Lyon A.R., McMurray J.J.V., Mebazaa A., Mindham R., Muneretto C., Francesco Piepoli M., Price S., Rosano G.M.C., Ruschitzka F., Kathrine Skibelund A. 2021 ESC Guidelines for the diagnosis and treatment of acute and chronic heart failure. Eur. Heart J. 2021;42:3599–3726. - PubMed
    1. Orso F., Fabbri G., Maggioni A.P. Epidemiology of heart failure. Handb. Exp. Pharmacol. 2017;243:15–33. - PubMed
    1. Rossignol P., Hernandez A.F., Solomon S.D., Zannad F. Heart failure drug treatment. Lancet. 2019;393:1034–1044. - PubMed
    1. McDonagh T.A., Metra M., Adamo M., Gardner R.S., Baumbach A., Böhm M., Burri H., Butler J., Čelutkienė J., Chioncel O., Cleland J.G.F., Crespo-Leiro M.G., Farmakis D., Gilard M., Heymans S., Hoes A.W., Jaarsma T., Jankowska E.A., Lainscak M., Lam C.S.P., Lyon A.R., McMurray J.J.V., Mebazaa A., Mindham R., Muneretto C., Francesco Piepoli M., Price S., Rosano G.M.C., Ruschitzka F., Skibelund A.K. Eur Heart J; 2023. Focused Update of the 2021 ESC Guidelines for the Diagnosis and Treatment of Acute and Chronic Heart Failure. 2023. - PubMed
    1. Tsao C.W., Aday A.W., Almarzooq Z.I., Anderson C.A.M., Arora P., Avery C.L., Baker-Smith C.M., Beaton A.Z., Boehme A.K., Buxton A.E., Commodore-Mensah Y., Elkind M.S.V., Evenson K.R., Eze-Nliam C., Fugar S., Generoso G., Heard D.G., Hiremath S., Ho J.E., Kalani R., Kazi D.S., Ko D., Levine D.A., Liu J., Ma J., Magnani J.W., Michos E.D., Mussolino M.E., Navaneethan S.D., Parikh N.I., Poudel R., Rezk-Hanna M., Roth G.A., Shah N.S., St-Onge M.P., Thacker E.L., Virani S.S., Voeks J.H., Wang N.Y., Wong N.D., Wong S.S., Yaffe K., Martin S.S. Heart disease and stroke statistics-2023 update: a report from the American heart association. Circulation. 2023;147:e93–e621. - PubMed