

Spatial patterns, factors, and ethnic differences: A study on ethnic minority villages in Yunnan, China
- PMID: 38510005
- PMCID: PMC10950889
- DOI: 10.1016/j.heliyon.2024.e27677
Spatial patterns, factors, and ethnic differences: A study on ethnic minority villages in Yunnan, China
Abstract
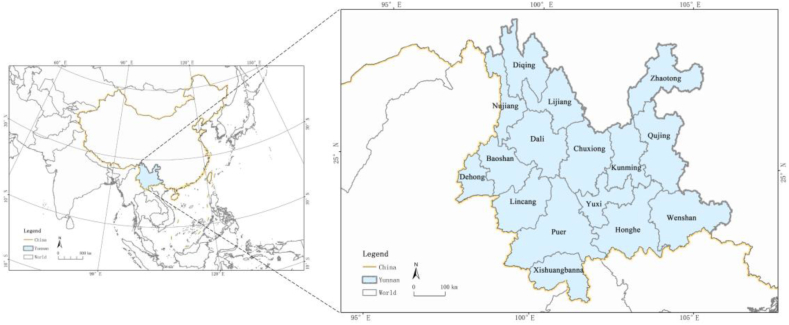
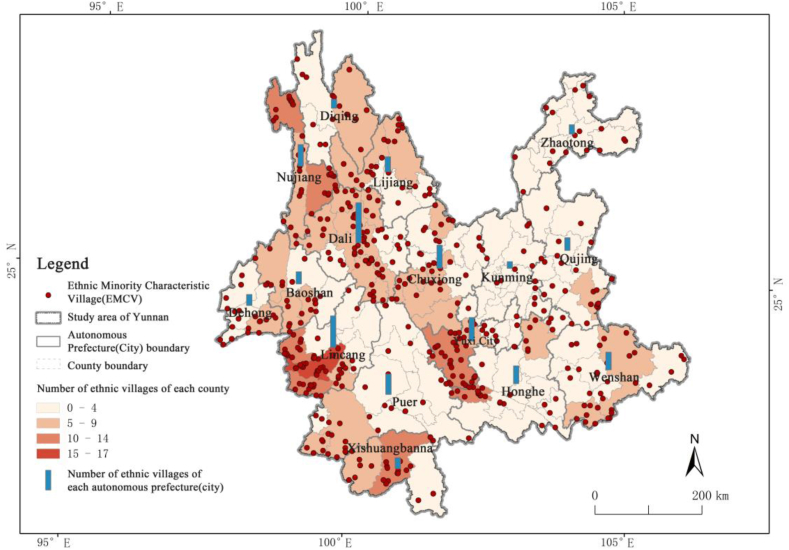
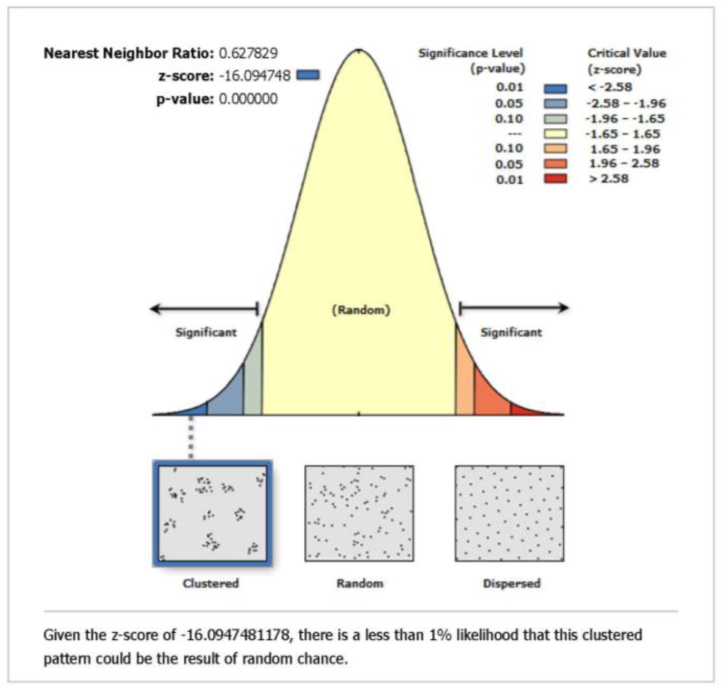
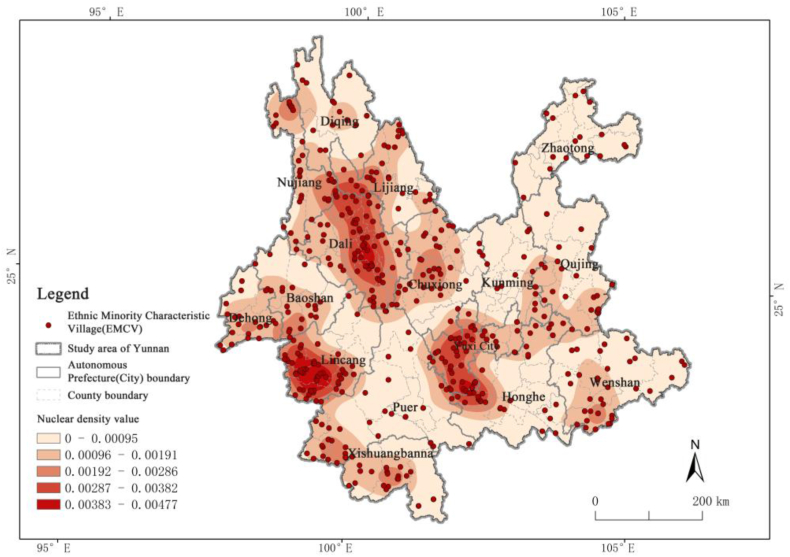
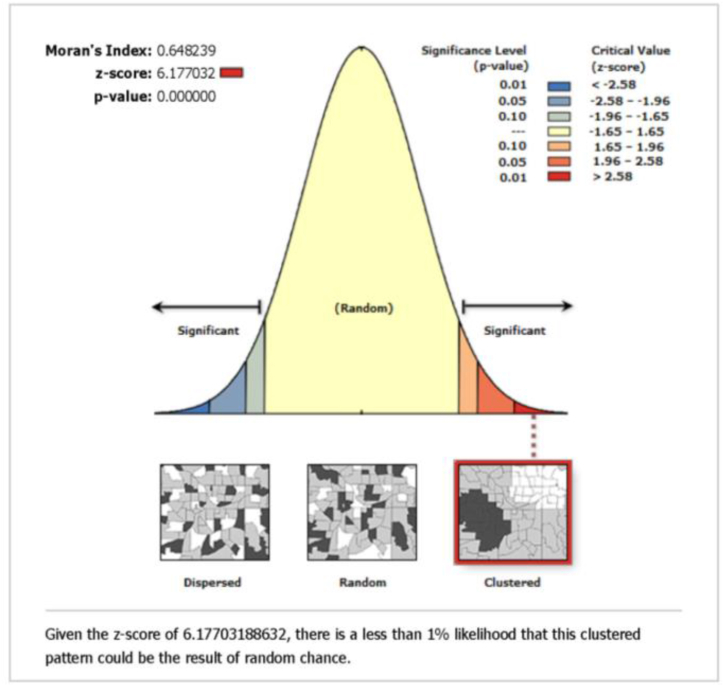
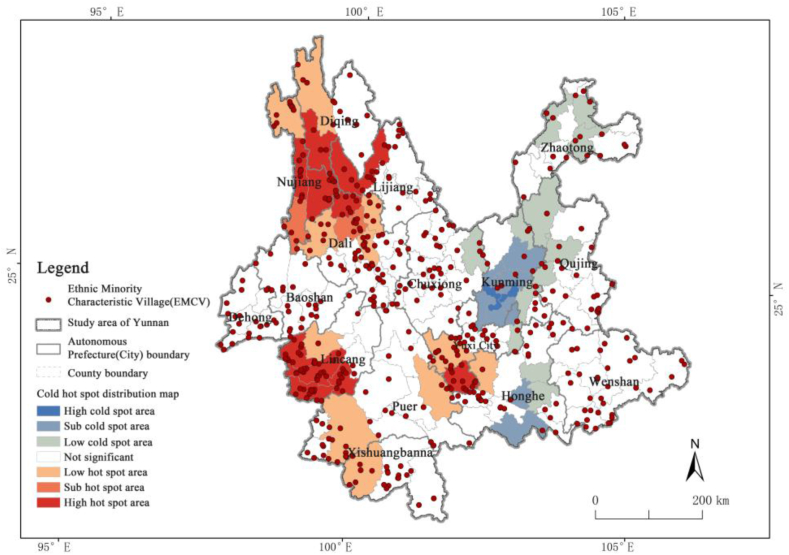
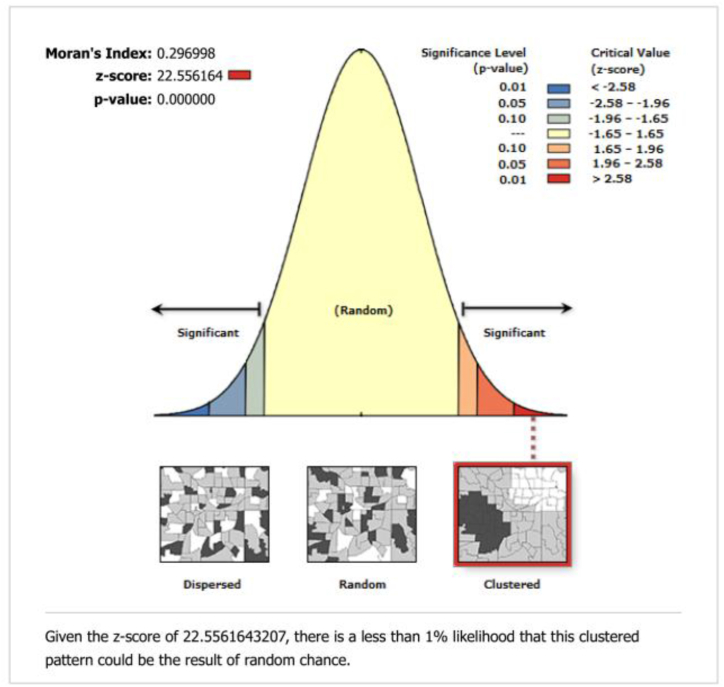
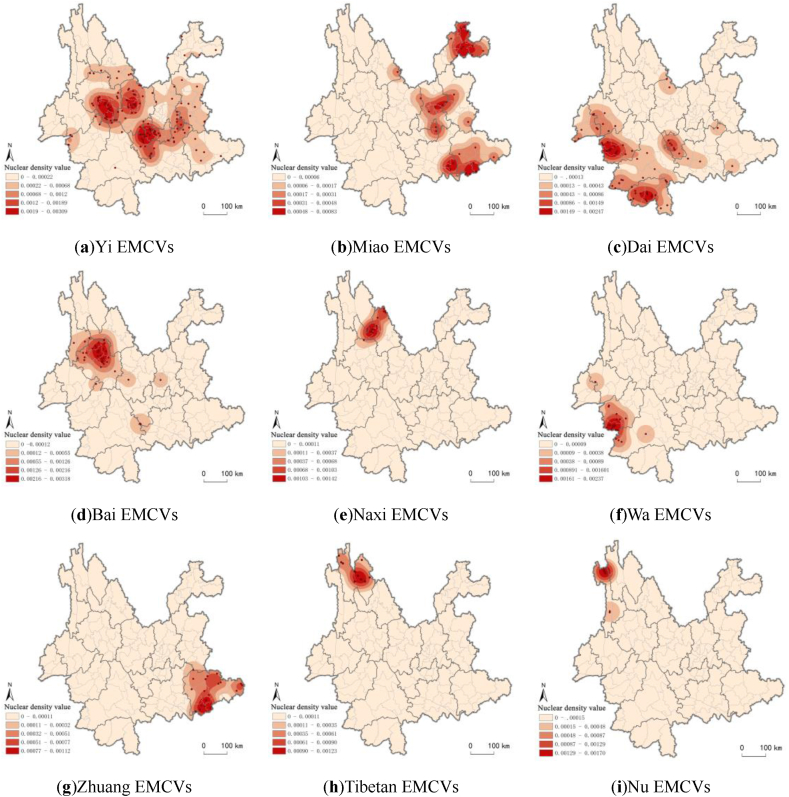
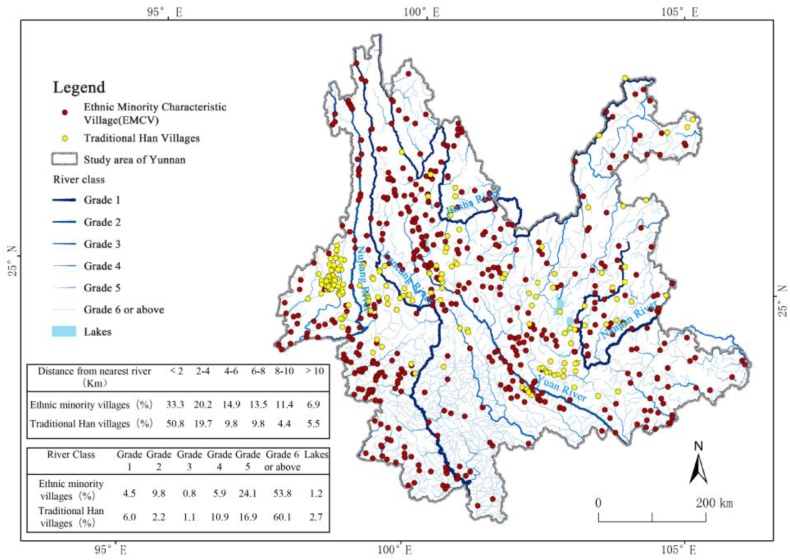
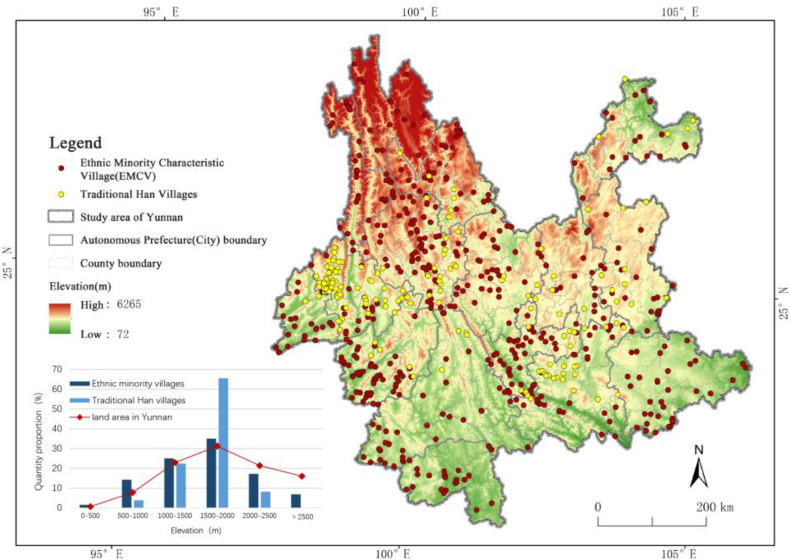
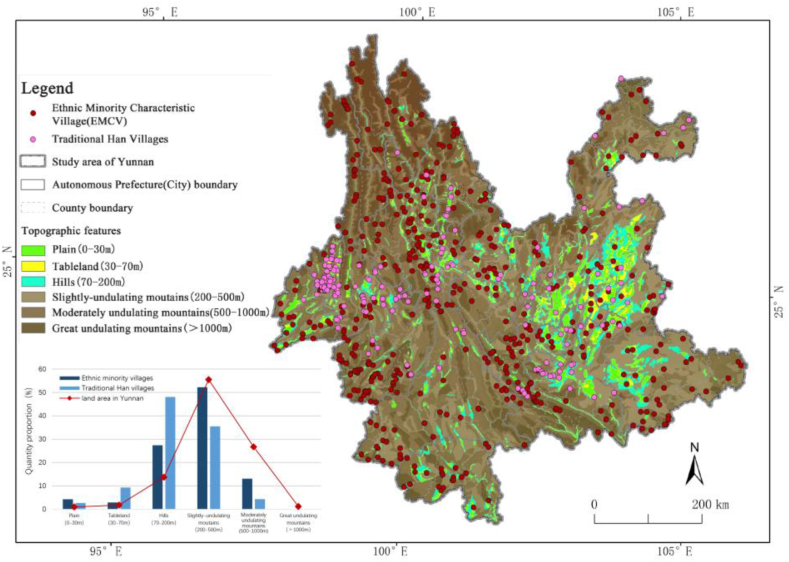
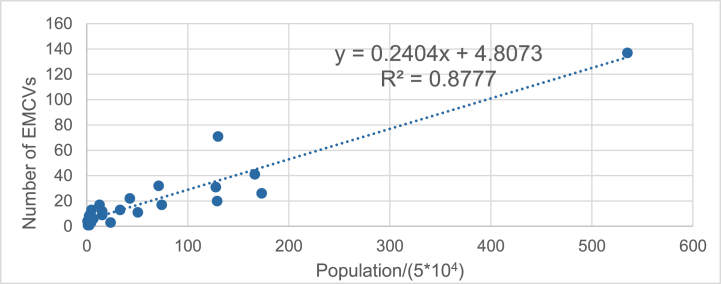
This paper takes ethnic minority villages in Yunnan province of China, which have significant characteristics of multi-ethnic integration, as the research object. Through various spatial statistical analysis methods, we analyzed the overall distribution characteristics of ethnic villages in Yunnan, the distribution difference among various ethnic groups, and the influencing factors of the distribution pattern. It was found that: (1) The ethnic minority villages in Yunnan generally exhibit a kernel density characteristic of "three concentrated areas and multiple scattered points" and distribution characteristic of "hot spots in the west and cold spots in the east". Each ethnic group has a relatively concentrated region, presenting significant ethnic autocorrelation. (2) The differences in the relationship between villages and landscape among various ethnic groups have given rise to a unique three-dimensional distribution pattern, which is relate to ethnic origin and livelihood culture. Meanwhile, Han traditional villages tend to occupy areas with relatively better geographical conditions. (3) Natural factors, such as topographic relief, the distance between ethnic villages and rivers, and elevation, have a significant impact on the distribution of ethnic villages in Yunnan. Meanwhile, test results of social and human factors, including the distance from central cities, per capita GDP, and the gross annual output values of primary industry, indicate that the development of social economy and the promotion of urbanization pose challenges to the preservation of ethnic villages.
Keywords: Ethnic differentiation; Ethnic minority villages; Human factor; Natural factor; Spatial distribution.
© 2024 The Authors. Published by Elsevier Ltd.
Conflict of interest statement
The authors declare the following financial interests/personal relationships which may be considered as potential competing interests:Xiao Dawei reports financial support was provided by 10.13039/501100001809National Natural Science Foundation of China (51778232). Zhuo Xiaolan reports financial support was provided by Guangdong Basic and Applied Basic Research Foundation (2023A1515011702). If there are other authors, they declare that they have no known competing financial interests or personal relationships that could have appeared to influence the work reported in this paper.
Figures
References
-
- Liu Z., Li Z. Research on the protection and planning construction of featured villages of ethnic minorities during the process of urbanization: a case study on the special ancient village of guilin, guangxi[J] Social Sciences in Guangxi. 2015;31(9):31–34.
-
- Yuqing G., Liwen L., Lingyan C. Socio-Economic Planning Sciences; 2023. Rural Revitalization of China: A New Framework, Measurement and forecast[J] p. 89.
-
- Wang S., Zhang W. vol. 3. Yunnan National Publishing House; Kunming: 2002. (Geography of Yunnan[M]).
-
- Wang W., Long X. vol. 9. Yunnan University Press; Kunming: 2018. (Summary of the History and Culture of Yunnan Nationalities[M]).
LinkOut - more resources
Full Text Sources
