. 2024 Mar;3(3):283-300.
doi: 10.1038/s44161-024-00428-w. Epub 2024 Feb 14.

YAP induces a neonatal-like pro-renewal niche in the adult heart

Affiliations

YAP induces a neonatal-like pro-renewal niche in the adult heart

Rich Gang Li et al. Nat Cardiovasc Res. 2024 Mar.

Abstract

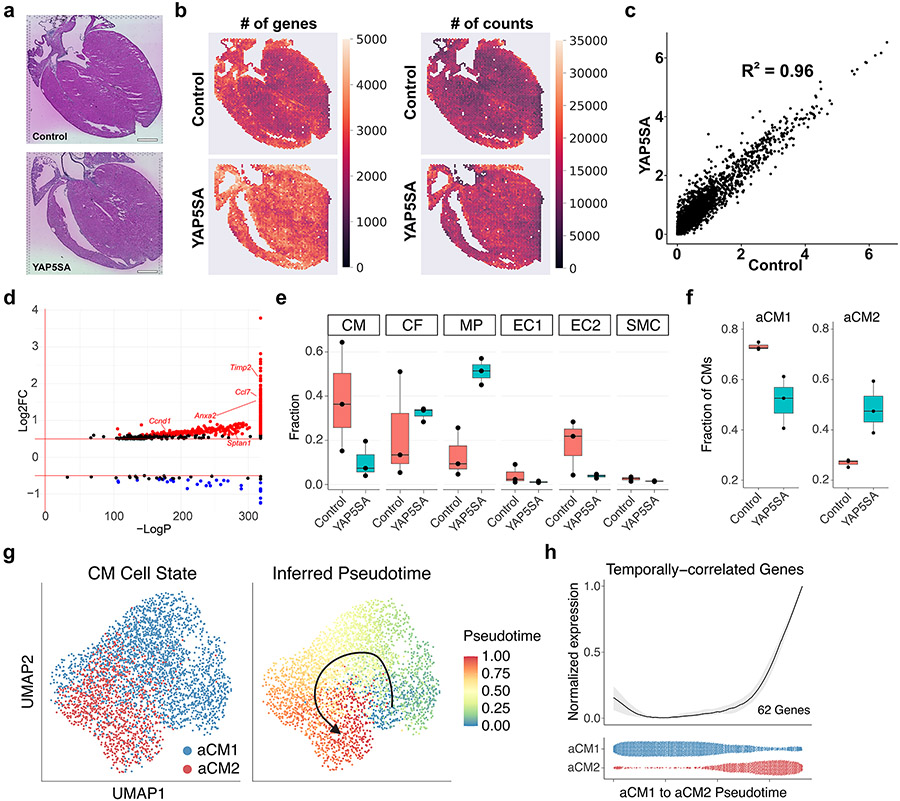
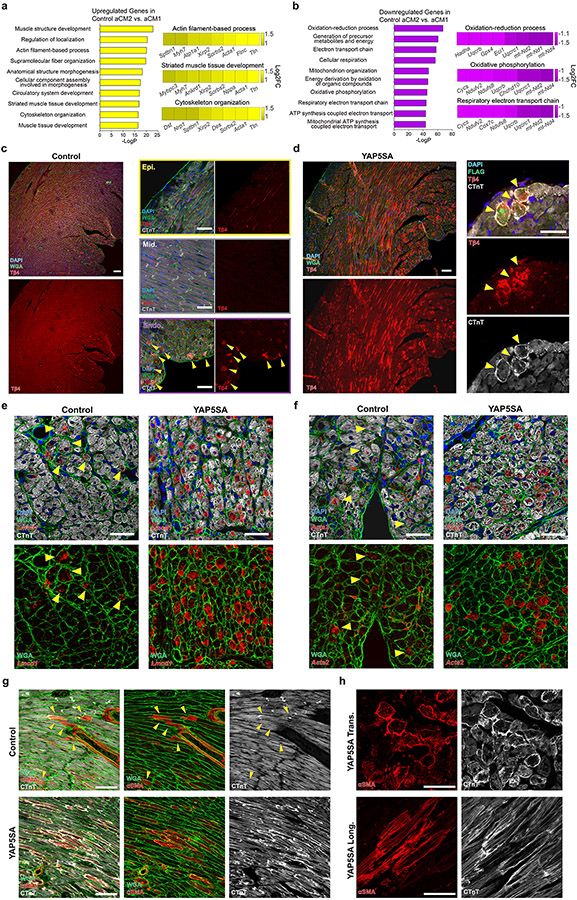
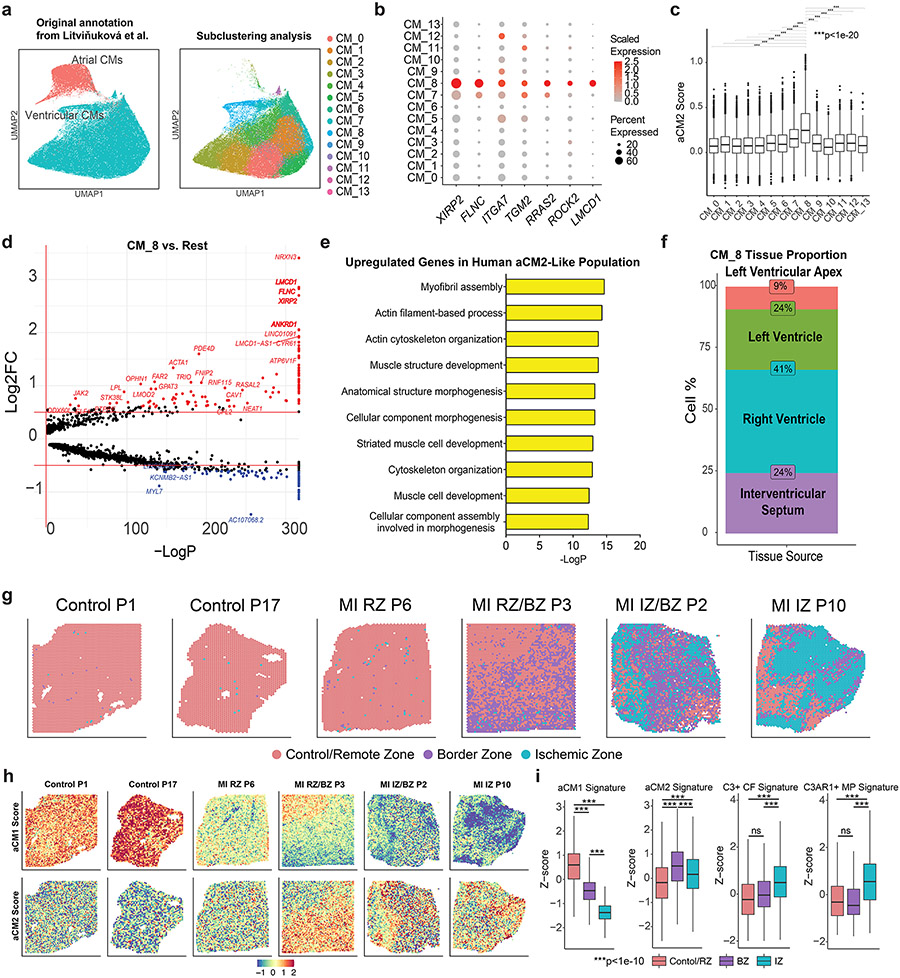
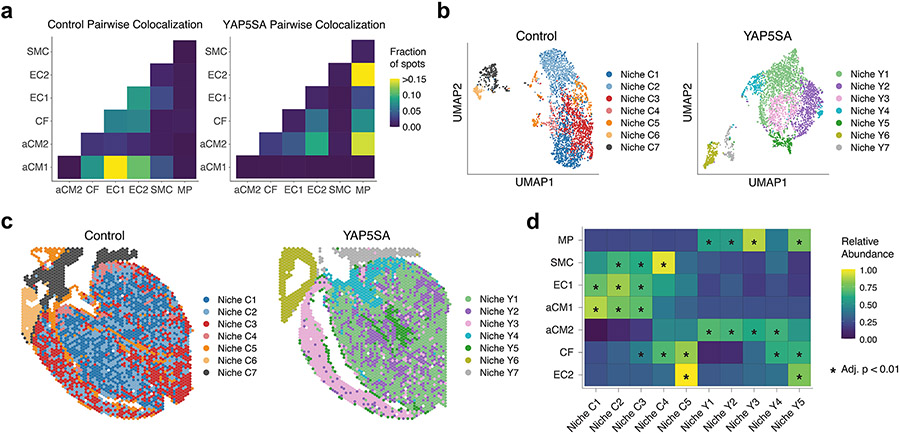
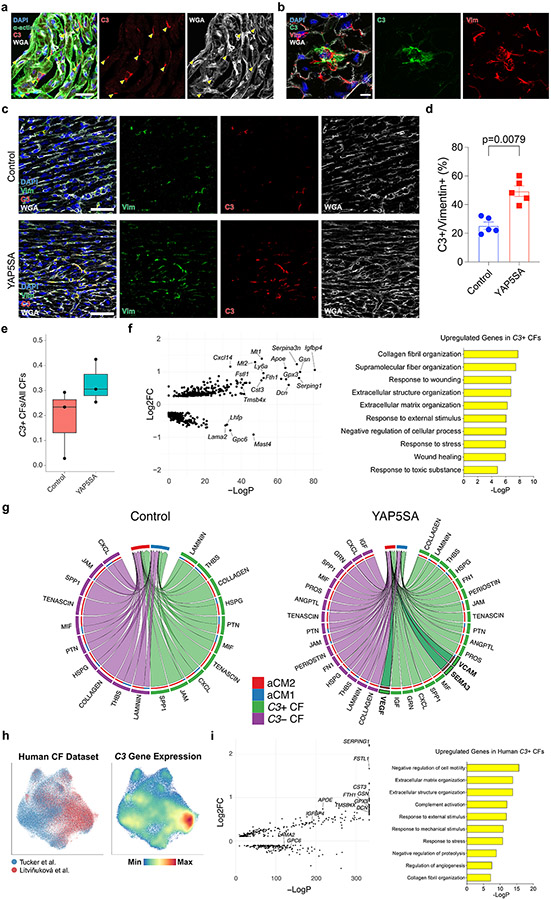
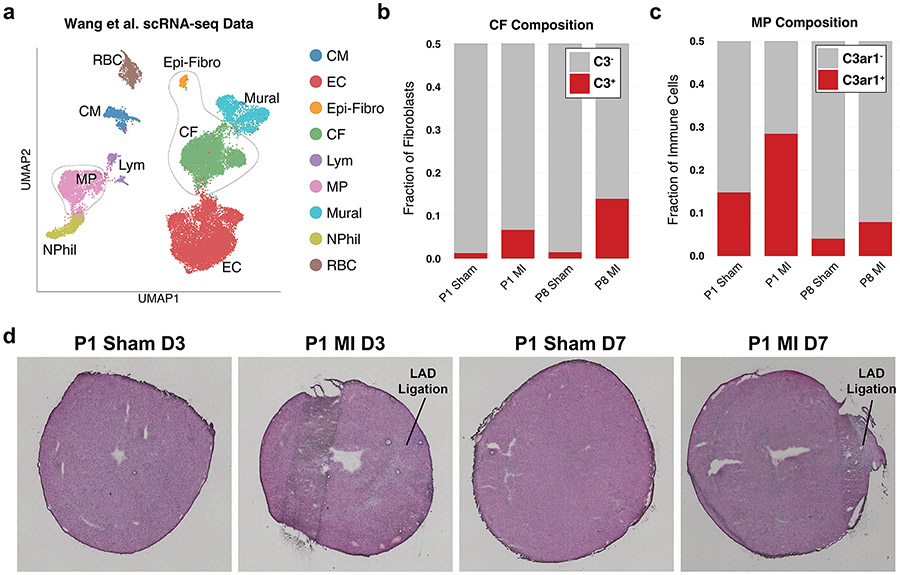
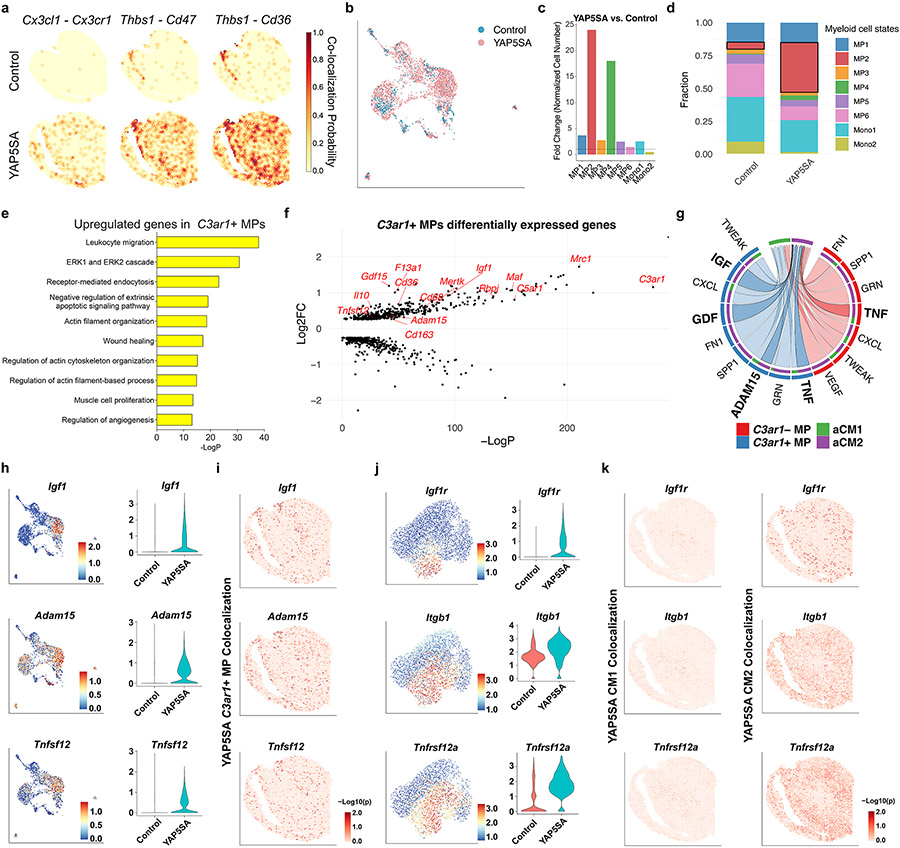
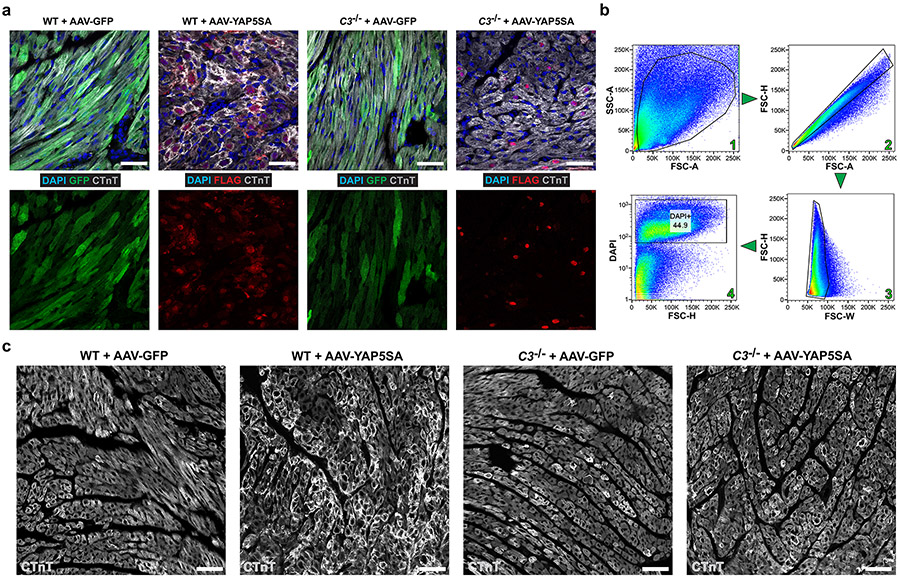
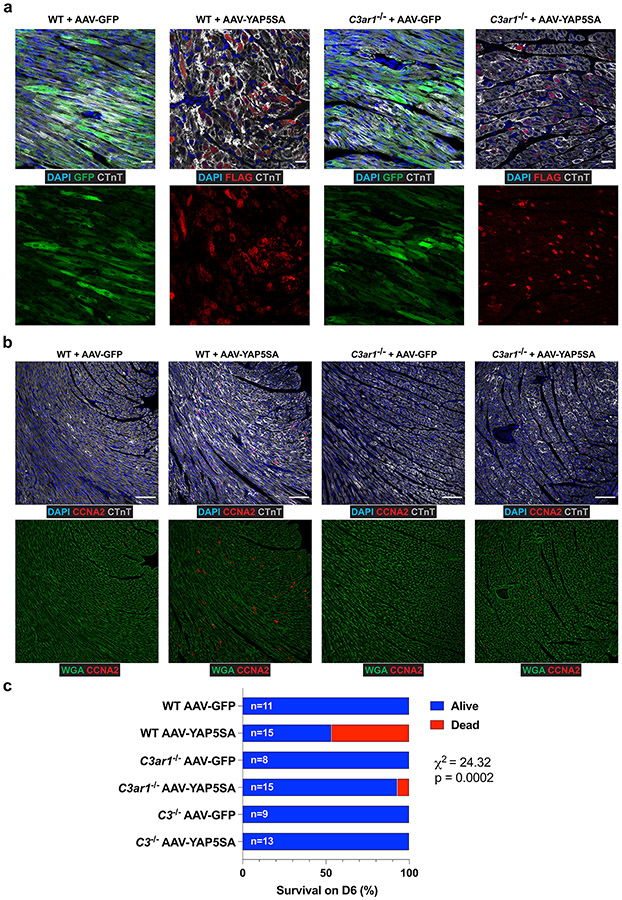
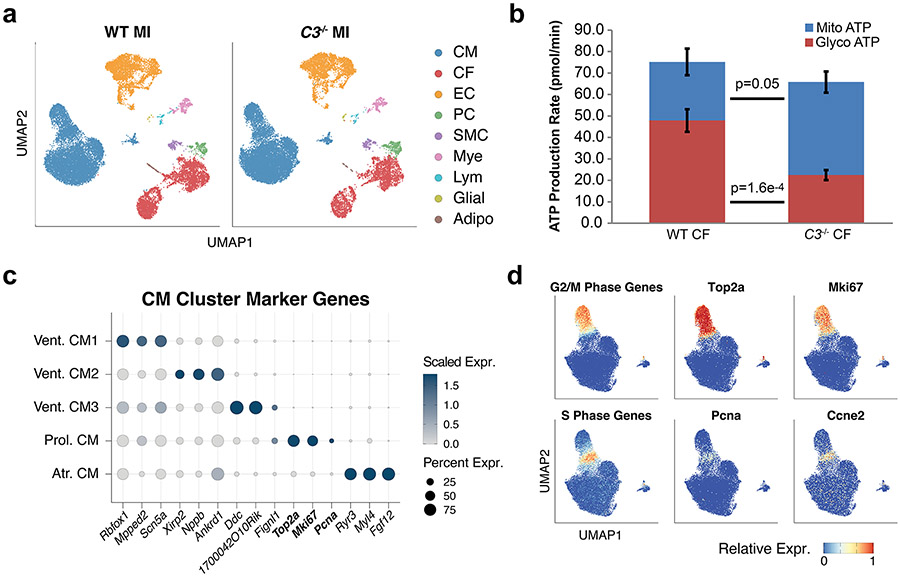
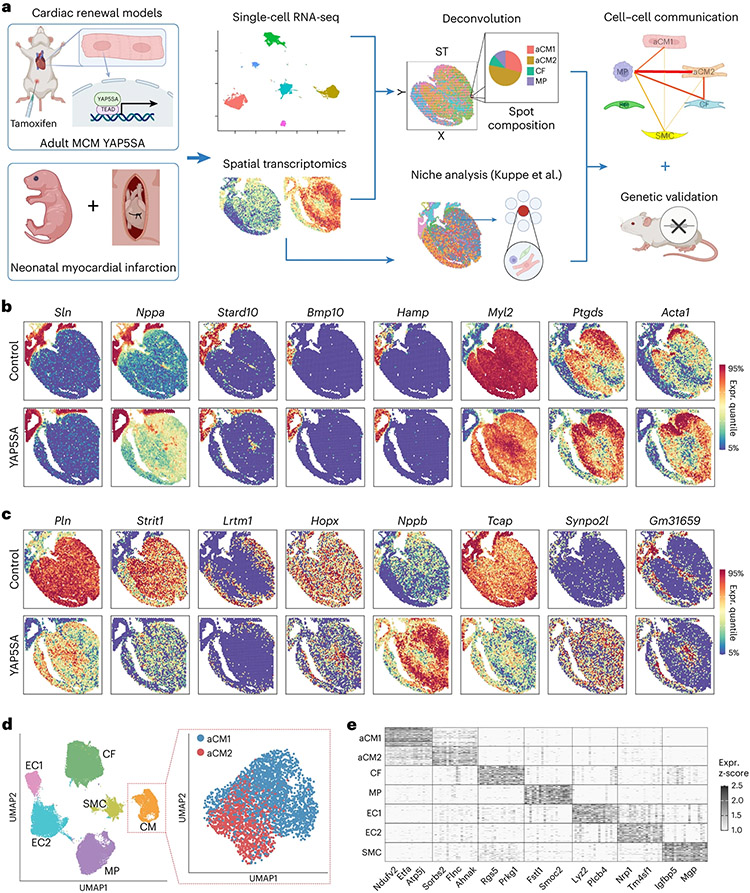
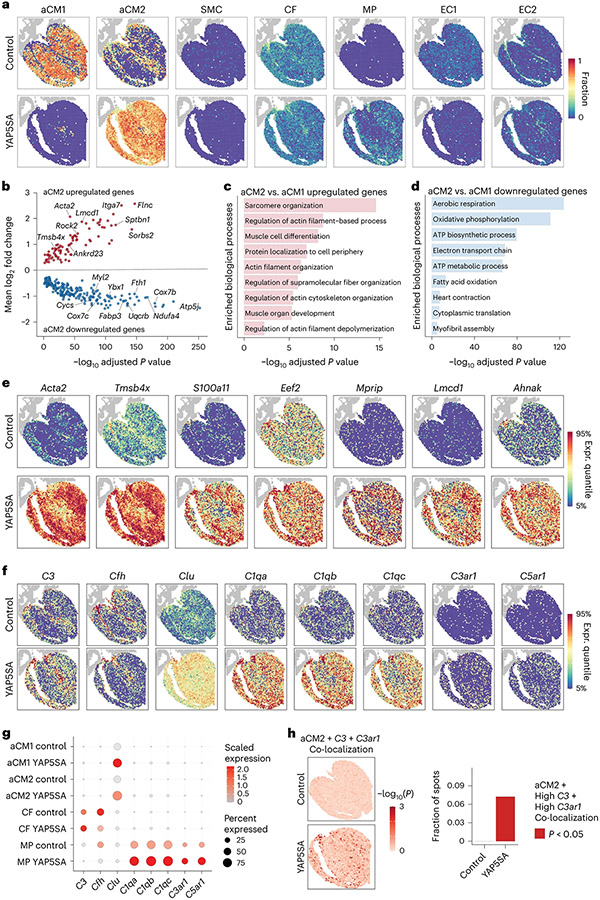
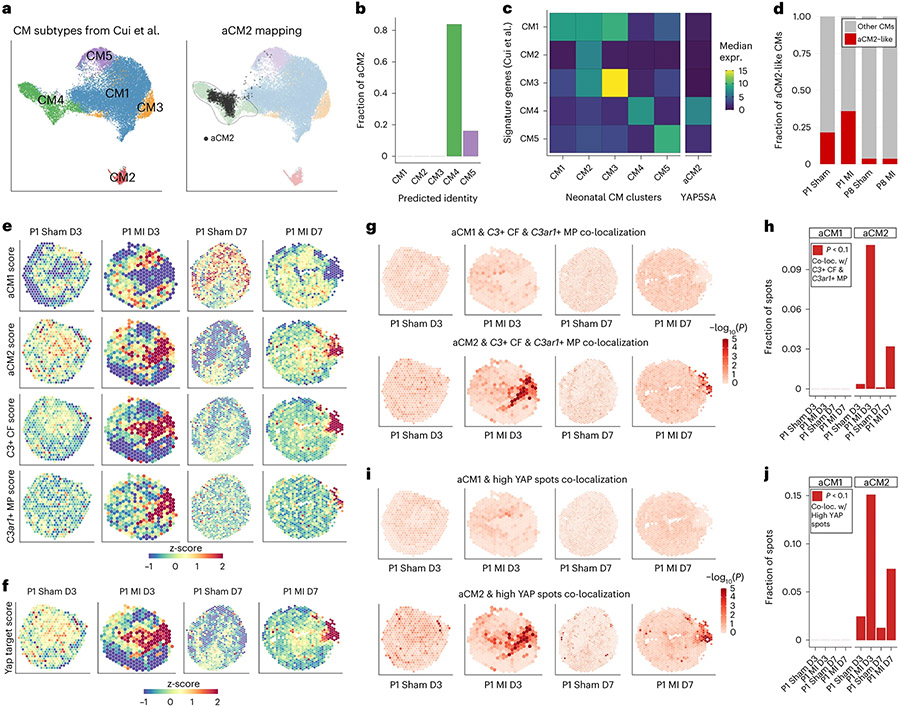
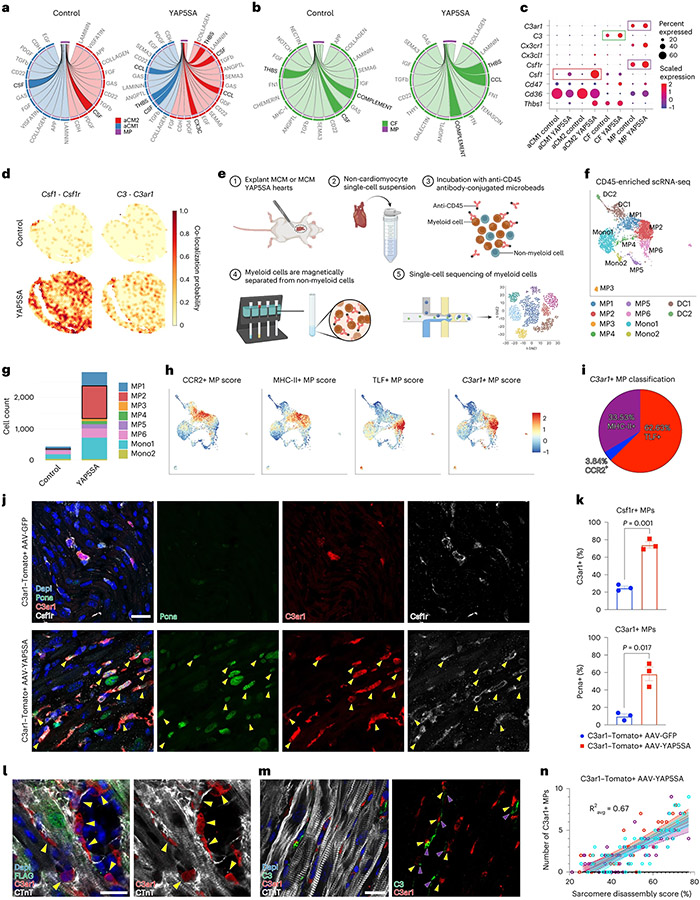
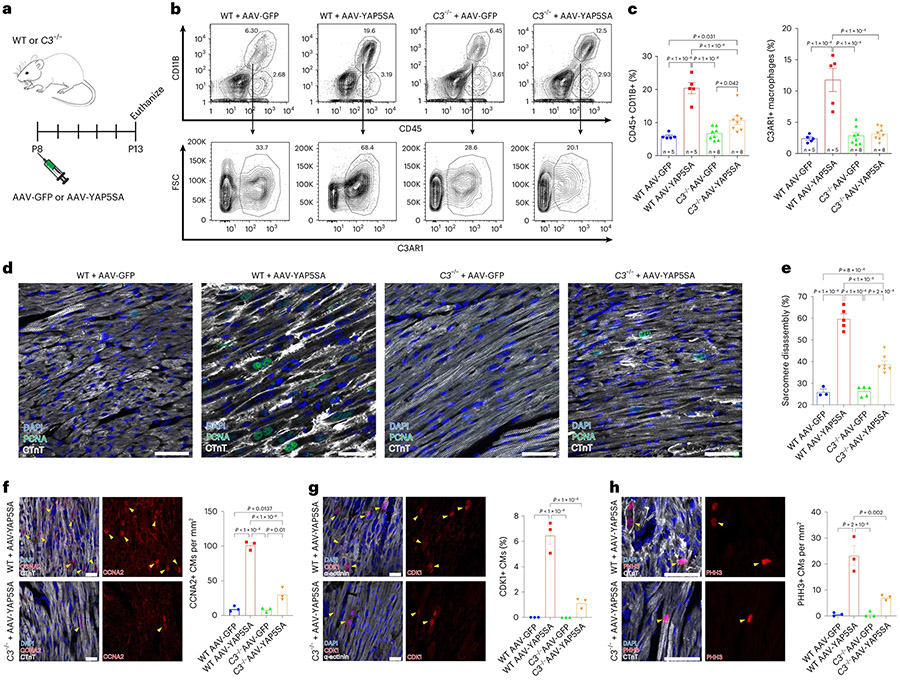
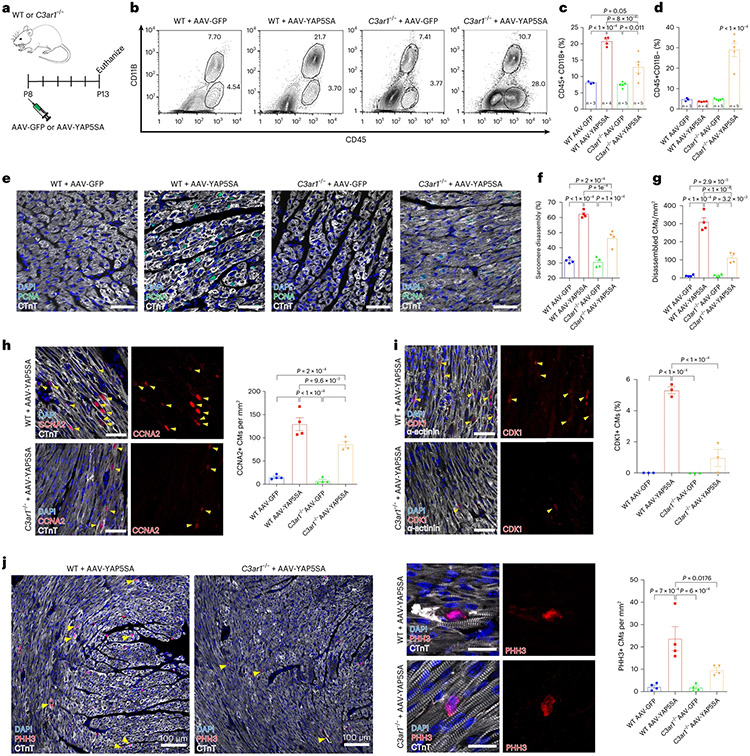
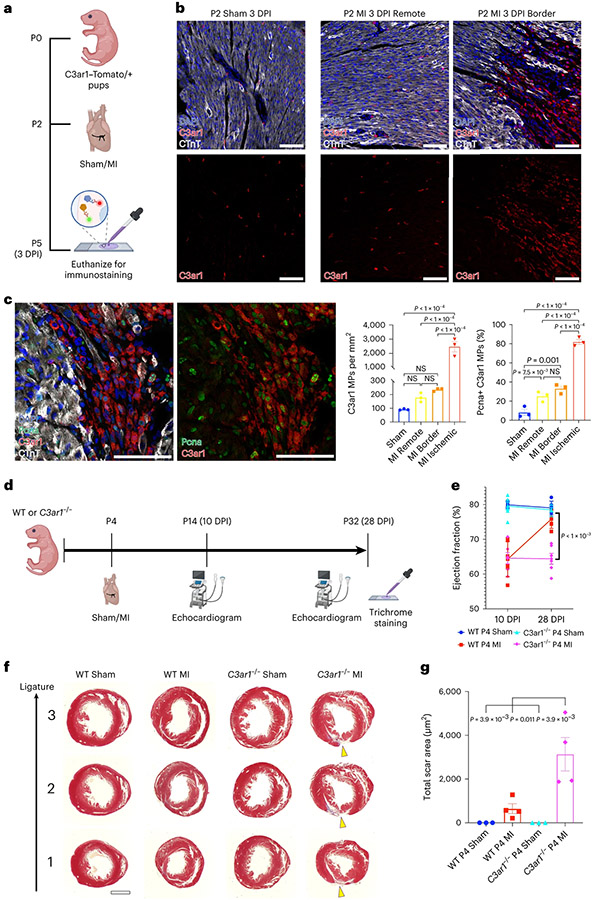
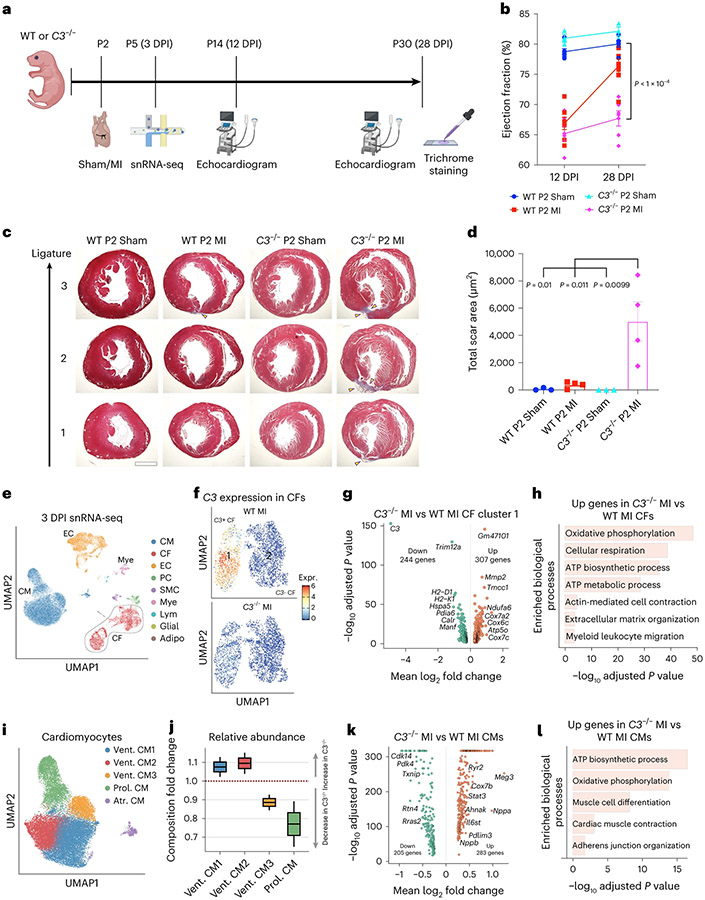
After myocardial infarction (MI), mammalian hearts do not regenerate, and the microenvironment is disrupted. Hippo signaling loss of function with activation of transcriptional co-factor YAP induces heart renewal and rebuilds the post-MI microenvironment. In this study, we investigated adult renewal-competent mouse hearts expressing an active version of YAP, called YAP5SA, in cardiomyocytes (CMs). Spatial transcriptomics and single-cell RNA sequencing revealed a conserved, renewal-competent CM cell state called adult (a)CM2 with high YAP activity. aCM2 co-localized with cardiac fibroblasts (CFs) expressing complement pathway component C3 and macrophages (MPs) expressing C3ar1 receptor to form a cellular triad in YAP5SA hearts and renewal-competent neonatal hearts. Although aCM2 was detected in adult mouse and human hearts, the cellular triad failed to co-localize in these non-renewing hearts. C3 and C3ar1 loss-of-function experiments indicated that C3a signaling between MPs and CFs was required to assemble the pro-renewal aCM2, C3+ CF and C3ar1+ MP cellular triad.


Figures

Extended Data Fig. 1 ∣
Extended Data Fig. 1 ∣. Spatial transcriptomics and scRNAseq quality control.
a, H&E staining of tissue sections showing no gross morphologic differences between control and YAP5SA hearts. Scale = 1000 μm. b, Spatial transcriptomics dataset (n = 1 per genotype) with the number of genes (median: control, 2358; YAP5SA, 3323) and counts (average: control, 12,804; YAP5SA, 15,101) captured per spot. c, Correlation of gene expression between control and YAP5SA hearts (R2 = 0.96). d, Differentially expressed genes between YAP5SA and control hearts with increased expression of representative Yap target genes Ccnd1, Anxa2, Sptan1, Ccl7, and Timp1 in YAP5SA hearts. e, Single-cell RNA-seq cell-type composition across replicates shows increased MPs in YAP5SA hearts (n = 3 per genotype). f, aCM1 proportion is decreased and aCM2 proportion is increased in YAP5SA compared to Control hearts (n = 3 per genotype). g, Pseudotime analysis using Slingshot trajectory inference showing potential transition from aCM1 to aCM2. h, Gene expression module modeled as a function of progression through the pseudotemporal trajectory. The 62 temporally correlated genes increasing during the transition from aCM1 to aCM2 are listed in Supplementary Table 2. Center lines in all box plots are shown as mean values and whiskers extended to a maximum of 1.5 x interquartile range beyond the boxes.
Extended Data Fig. 2 ∣
Extended Data Fig. 2 ∣. Validation of aCM2 marker genes.
a, GO analysis of upregulated genes in control murine aCM2 versus aCM1 showing increased structural gene expression, with the top GO terms and associated upregulated genes shown. b, GO analysis of downregulated genes in control murine CM2 versus control CM1 showing decreased metabolic processes, with the top GO terms and associated downregulated genes shown. c, Immunostaining showing Tβ4 (red) in the subendocardium and subepicardium of a wildtype control heart (left, scale = 100 μm). WGA (green) and DAPI (blue) stains were used for cell membrane and nuclei staining. Zoomed-in regions showing Tβ4 expression in cardiomyocytes of the subendocardium, no Tβ4 expression in the midmyocardium, and Tβ4 expression in the subepicardium (right, scale = 50 μm). d, Tβ4 expression is greatly increased in YAP5SA hearts (left, scale = 100 μm). High magnification images showing expression of Tβ4 in YAP5SA-activated CMs (FLAG positive, green) with sarcomere disassembly (CTnT, grey) (right, scale = 20 μm). e, aCM2 marker gene Lmcd1 (red) is expressed in some control subendocardial CMs (yellow arrows) and is increased in YAP5SA CMs. Scale = 50 μm. f, aCM2 marker gene Acta2 (red) is expressed in some control subendocardial CMs (yellow arrows) and is increased in YAP5SA CMs. Scale = 50 μm. g, Smooth muscle actin (;SMA), encoded by Acta2, is expressed in control subendocardial CMs (yellow arrowheads) and significantly increased in dedifferentiating YAP5SA CMs, identified by disorganized CTnT expression. Scale = 100 μm. h, High magnification images of transverse and longitudinal axes show colocalization of α-SMA with CMs undergoing sarcomere disassembly. Scale = 50 μm. Statistical significance for enriched GO terms was determined using a one-sided Fisher’s exact test, with an adjusted p value (Benjamini-Hochberg correction) < 0.05.
Extended Data Fig. 3 ∣
Extended Data Fig. 3 ∣. The adult human heart contains aCM2-like CMs.
a, Original annotation of human scRNA-seq data by Litviňuková et al. showing atrial and ventricular CMs (left). Subclustering of ventricular CMs revealed 14 distinct CM populations (right). b, Expression profile of CM2 marker genes in the 14 CM populations showed the highest expression in CM_8. The complement regulator CLU was also highly expressed in CM_8. c, Compared with the other CM populations, CM_8 showed the highest CM2 similarity score (***p < 0.001, one-way ANOVA with multiple comparisons, cell numbers in the 14 CM clusters range from 545 to 21,334). d, Volcano plot of differentially expressed genes between CM_8 and all other CM populations showing the upregulation of multiple CM2 marker genes. e, The top GO terms for upregulated genes in CM_8 were cytoskeletal organization terms, similar to those in CM2. f, Cellular origin composition of CM_8 showing that 9% of cells originated from the left ventricular apex, 24% from the left ventricle, 41% from the right ventricle, and 24% from the interventricular septum. g, Representative human heart ST control and MI samples from Kuppe et al. with annotations of remote, border, and ischemic zones based on Calcagno et al.. h, aCM1 and aCM2 scores for the representative tissue sections showing an increase of aCM2 signature in border zones of MI hearts. i, Quantification of 18 hearts from Kuppe et al. shows aCM1 is downregulated in both border and ischemic zones, while aCM2 is upregulated in the border zone compared to ischemic and remote zones. C3+ CF and C3ar1+ MP scores are increased in the ischemic zone but not in the border zone compared to the remote zone. Statistical significance was determined using a two-sided pairwise t-test. Center lines in all box plots are shown as mean values and whiskers extended to a maximum of 1.5 × interquartile range beyond the boxes.
Extended Data Fig. 4 ∣
Extended Data Fig. 4 ∣. Spatial niche analysis of Control versus YAP5SA hearts.
a, Pairwise co-localization between the major cell types based on deconvolved proportions shows MP significantly co-localizes with EC2, CF and aCM2 but not with aCM1. b, Unsupervised clustering of spots in the ST data yielded seven spatial niches for each genotype. c, Spatial niches mapped onto Control and YAP5SA hearts. d, Control Niche 5 (C5) is abundant in aCM2, CF, and EC2, while YAP5SA Niche 3 and 5 (Y3 & Y5) contains higher amount of aCM2, CF, and MP than other niches. Asterisks indicate increased composition of a cell type in a niche compared with other niches (one-sided Wilcoxon rank sum test, adjusted (adj.) P < 0.01).
Extended Data Fig. 5 ∣
Extended Data Fig. 5 ∣. C3+ CFs express cardioprotective and antifibrotic genes and is conserved between mouse and human.
a, immunofluorescence staining of CM marker α-actinin (green), C3 (red), nuclei counterstain DAPI (blue), and cell membrane marker wheat germ agglutinin (WGA, grey) shows expression of C3 in the subendocardium of control hearts. Scale = 50 μm. b, C3 (green) is colocalized with fibroblast marker vimentin (red). Scale = 20 μm. c, C3 (red) expression is increased in YAP5SA compared to Control hearts. Scale = 50 μm. d, Quantification of C3+ and vimentin+ cells in Control and YAP5SA hearts (n = 5 per genotype). e, Proportion of CFs expressing C3 in Control and YAP5SA hearts (n = 3 per genotype). f, Volcano plot (left) showing differentially expressed genes between C3-positive and C3-negative CFs and categorized as GO terms (right) showing increased expression of anti-fibrotic genes (Dcn, Igfbp4, and Cst3) and cardioprotective genes (Mt1, Mt2, and Fstl1) by C3-positive CFs. g, Ligand-receptor analysis from C3− or C3+ CFs to aCM1 and aCM2. VCAM, SEMA3, and VEGF pathway genes are upregulated in YAP5SA hearts. h, CFs from Litviňuková et al. and Tucker et al. shows a subpopulation of CFs with high C3 expression,. i, Volcano plot of differentially expressed genes between human C3+ CFs and C3− CFs shows the upregulation of many of the same genes as in the mouse, including FSTL1, DCN, CST3, and IGFBP4. GO analysis of genes upregulated in human C3+ versus C3− CFs shows extracellular matrix organization and immune activation terms, similar to the categories observed in murine C3+ CFs. Error bars indicate means ± s.e.m. Statistical significance was determined using a two-tailed Wilcoxon rank sum test. Center lines in all box plots are shown as mean values and whiskers extended to a maximum of 1.5 × interquartile range beyond the boxes.
Extended Data Fig. 6 ∣
Extended Data Fig. 6 ∣. aCM2 is induced following myocardial infarction.
a, UMAP projection of single-cell RNA sequencing data from Wang et al.. b, The proportion of C3-expressing CFs increase after MI in both P1 and PS hearts. c, P1 sham hearts have higher proportion of C3ar1-expressing MPs compared to P8 sham hearts. P1 MI induces a greater increase in C3ar1-expressing MPs compared to PS MI. d, H&E staining of P1 sham and MI heart sections 3 days and 7 days postsurgery (P1 Sham D3, P1 MI D3, P1 Sham D7, P1 MI D7) used for ST in Cui et al.. Data adapted from Cui et al.
Extended Data Fig. 7 ∣
Extended Data Fig. 7 ∣. C3ar1+ macrophages are anti-inflammatory and signal to cardiomyocytes.
a, Spatial colocalization probability of ligand-receptor gene pairs (Cx3cl1-Cx3cr1, Thbs1-Cd47, and Thbs1-Cd36) are increased in YAP5SA compared to Control hearts. b, UMAP projection of Control and YAP5SA myeloid cells. c, Most MP populations are increased in YAP5SA compared to Control hearts, with MP2 being most increased. d, MP2 macrophages are the most increased fraction in YAP5SA compared to control hearts. e, GO analysis of upregulated genes in C3ar1+ MPs versus C3ar1− MPs reveals terms associated with anti-inflammatory M2 MPs, such as anti-apoptosis, wound healing, and angiogenesis. Statistical significance was determined by one-sided Fisher’s exact test, with an adjusted p value (Benjamini-Hochberg correction) < 0.05. f, Differentially expressed genes include markers of M2 (Mertk, Mrc1, Il10, Maf, Cd163, Cd68, Cd36), cardiac growth (Igf1), anti-apoptosis (Gdf15), wound healing (F13a1), angiogenesis (Tnfsf12), and ECM degradation (Adam15). Statistical significance was determined by two-tailed Wilcoxon rank sum test. g, Ligand-receptor analysis from C3ar1+ MPs to aCM2 shows increased TNF, ADAM15, GDF, and IGF signaling. h, The expression of the MP ligand genes Igf1, Adam15, and Tnfsf12 are specific to C3ar1+ MPs increased in YAP5SA compared to Control. i, Colocalization of Igf1, Adam15, and Tnfsf12 expressing spots with C3ar1+ MPs in YAP5SA ST data. j, The expression of the aCM2 receptor genes Igf1r, Itgb1, and Tnfrsf12a are increased in YAP5SA compared to Control. k, Igf1r, Itgb1, and Tnfrsf12a expressing spots colocalize with aCM2 but not aCM1 in YAP5SA ST data. Statistical significance was determined by spatial colocalization testing (detailed in Methods).
Extended Data Fig. 8 ∣
Extended Data Fig. 8 ∣. AAV-GFP and AAV-YAP5SA are induced robustly in wildtype and C3−/− hearts.
a, Wildtype (WT) and C3−/− mice injected with AAV-GFP shows high transduction efficiency in cardiomyocytes, as seen in GFP expression (green). Wildtype (WT) and C3−/− mice injected with AAV-YAP5SA shows high transduction efficiency of YAP5SA, as evidenced by FLAG expression (red), in cardiomyocytes. Scale = 100 μm. b, Flow cytometry gating strategy for obtaining DAPI+ singlets (Non-CMs). c, Low magnification images showing increased sarcomere disassembly (CTnT, grey) in WT + AAV-YAP5SA compared to C3−/− + AAV-YAP5SA hearts. Scale = 50 μm.
Extended Data Fig. 9 ∣
Extended Data Fig. 9 ∣. AAV-GFP and AAV-YAP5SA are induced robustly in wildtype and C3ar1−/− hearts.
a, Wildtype (WT) and C3ar1−/− mice injected with AAV-GFP shows high transduction efficiency in cardiomyocytes, as seen in GFP expression (green). Wildtype (WT) and C3ar1−/− mice injected with AAV-YAP5SA shows high transduction efficiency of YAP5SA, as evidenced by FLAG expression (red), in cardiomyocytes. Scale bars = 100 μm. b, Representative images of S to G2 marker CCNA2 (red) shows a decrease in C3ar1−/− + AAV-YAP5SA CMs compared to WT + AAV-YAP5SA CMs. Scale bars = 100 μm. c, Survival of mice injected with AAV-GFP or AAV-YAP5SA. WT mice have reduced survival at D6 compared to C3ar1−/− and C3−/− mice injected with AAV-YAP5SA (53.3% vs. 93.3% and 100%). Statistical significance was determined using a chi-squared test.
Extended Data Fig. 10 ∣
Extended Data Fig. 10 ∣. Single-nucleus RNA sequencing of WT and C3−/− P2 MI 3 DPI hearts.
a, integrated UMAP projection of WT MI and C3−/− MI hearts 3 DPI (n = 2 each group). b, Quantification of basal ATP production rate, comprised of mitochondrial and glycolytic ATP production, in cultured WT and C3−/− cardiac fibroblasts (n = 20 wells). c, Cardiomyocyte marker genes showing a proliferative cluster expressing Top2a, Mki67, and Pcna. d, Feature plots showing aggregated proliferative gene signatures and example genes expressed by the Prol. CM cluster. Statistical significance was determined using a two-sided t-test. Error bars indicate means ± s.e.m.
Fig. 1 ∣
Fig. 1 ∣. Combining single-cell and ST to assay in vivo cardiac renewal.
a, Experimental workflow for the integration of scRNA-seq and ST data in two different cardiac renewal models: CM-specific expression of YAP5SA and neonatal MI. The scRNA-seq data were used as a reference for performing deconvolution on ST data to obtain the cellular composition per spot. Niche analysis, as described by Kuppe et al., was also performed to find spatial cellular niches. Ligand–receptor and correlation analyses were performed to infer cell–cell interactions between each cell type for each spot. The importance of the ligand/receptor genes was tested using genetic knockout mouse models. b, Spatial RNA-seq shows known representative atrial (Sln, Nppa and Stard10), right atrial (Bmp10) and ventricular (Myl2) genes and novel right atrial (Hamp) and left-sided (Ptgds and Acta1) genes. c, Dysregulated genes in YAP5SA hearts compared to control hearts, including regulators of cardiac contractility (Pln and Strit1), sarcomere formation (Tcap and Synpo2l), cardiac development (Hopx) and cardiac stress (Nppb). Gm31659 is a predicted long non-coding RNA with unknown function and is spatially restricted to the atria, RV and left ventricular subendocardium. Lrtm1 has homology to Slit3, and expression is excluded from the atria and subendocardium. d, UMAP projection of scRNA-seq data identified six distinct cell types: CMs, SMCs, CFs, MPs and ECs (EC1 and EC2). The CM population was reclustered into two populations (aCM1 and aCM2) by using control and YAP5SA data. e, Heat map of cell-type-specific marker genes (column) across cells in different cell types (rows). Expr., expression.
Fig. 2 ∣
Fig. 2 ∣. scRNA-seq and ST integration identifies two distinct CM populations.
a, Deconvolution of spatial gene expression spots showing the spatial localization of each cell type (fraction: 0–1) in control and YAP5SA hearts. b, Volcano plot of differentially regulated genes in aCM2 versus aCM1. c, GO analysis reveals increased expression of structural organization genes in aCM2. d, GO analysis reveals decreased aerobic metabolic processes in aCM2. e, Representative aCM2 marker gene expression. f, Complement pathway gene expression is restricted to aCM2-localized spots, including the main effector gene C3, complement pathway regulators (Cfh and Clu), complement component 1q (C1qa, C1qb and C1qc) and receptors (C3ar1 and C5ar1). g, Expression of complement pathway genes in different cell types. C3 is expressed only in CFs; Clu is expressed only in CMs; and C1q complex (C1qa, C1qb and C1qc) and receptors (C3ar1 and C5ar1) are expressed only in MPs. Expression levels of these genes are increased in YAP5SA compared to control hearts. h, aCM2, spots with high C3 expression and spots with high C3ar1 expression are significantly co-localized in YAP5SA hearts. Expr., expression.
Fig. 3 ∣
Fig. 3 ∣. aCM2 is induced by injury in the neonatal heart and co-localizes with C3-expressing CFs and C3ar1-expressing MPs.
a, scRNA-seq data of P1 Sham and MI and P8 Sham and MI from Cui et al. identify five CM populations. Transcriptome-wide correlation indicates that aCM2 is most like CM4. b, Unbiased label transfer predicts that 80% of aCM2 is CM4-like, with the remaining CM5-like. c, Median expression of CM1–CM5 signature genes shows aCM2 having the greatest similarity to CM4. d, Proportion of aCM2-like CMs in P1 Sham/MI and P8 Sham/MI. e, aCM1, aCM2, C3+ CF and C3ar1+ MP scoring based on ST gene expression at 3 d or 7 d after P1 Sham and MI (data adapted from Cui et al.). aCM2, C3+ CF and C3ar1+ MP scores are increased near the injury region after MI. f, YAP target gene scores are increased near the injury region. g,h, aCM2, but not aCM1, significantly co-localizes with C3+ CF and C3ar1+ MP in post-MI hearts. i,j, Compared to aCM1, aCM2 co-localization with high YAP target gene expression spots is high and sharply increased after MI. C-loc., co-localization; expr., expression.
Fig. 4 ∣
Fig. 4 ∣. Signaling among CMs, CFs and MPs in YAP5SA hearts.
a, aCM1 and aCM2 to MP ligand–receptor analysis reveals increased THBS, CSF and chemokine (CCL and CX3C) signaling in YAP5SA compared to control hearts. b, CF to MP ligand–receptor analysis shows increased complement and THBS signaling in YAP5SA compared to control hearts. c, Ligand and receptor gene expression for significantly affected pathways in YAP5SA hearts versus control hearts in indicated cell types. Complement signaling genes (C3 from CFs to C3ar1 from MPs) and CSF signaling genes (Csf1 from CMs to Csf1r from MPs) are highlighted. d, Spatial co-localization probabilities of ligand–receptor gene pairs (Csf1–Csf1r and C3–C3ar1) are increased in YAP5SA compared to controls. e, scRNA-seq strategy via CD45 enrichment. f, scRNA-seq of CD45-enriched cells reveals 10 cardiac myeloid populations, including six macrophage (MP1–6), two monocyte (Mono1–2) and two dendritic cell (DC1–2) clusters. g, MP2s are the most highly increased in total number in YAP5SA hearts. h, CCR2+, MHC-II+ and TLF+ MPs (as defined in Dick et al.) compared to C3ar1+ MPs. i, Most C3ar1+ MPs are tissue-resident TLF+ MPs. j, C3ar1 reporter mice (C3ar1-Tomato) injected with AAV-YAP5SA show an increased number of proliferating C3ar1+ MPs (yellow arrowheads, Pcna+, C3ar1+ and Csf1r+) compared to AAV-GFP controls. k, C3ar1+Csf1r+ MPs in AAV-YAP5SA (74.26%) compared to AAV-GFP (25.09%) injected controls. Pcna+C3ar1+ MPs in AAV-YAP5SA (58.41%) versus AAV-GFP (9.84%). n = 3, Welch’s two-sided t-test. l, C3ar1+ MPs envelop de-differentiated, YAP5SA-induced CMs (FLAG+ CMs with disorganized CTnT). m, C3+ (purple arrowheads) and C3ar1+ (yellow arrowheads) cells are co-localized near CMs with disassembled sarcomeres. n, Sarcomere disassembly score and number of neighboring C3ar1+ MPs positively correlate in YAP5SA hearts (n = 3, Ravg = 0.67). Average correlation coefficient was calculated using Fisher’s z-transform. Scale, 20 μm for all images. Error bars indicate means ± s.e.m. Error bands represent 95% confidence intervals.
Fig. 5 ∣
Fig. 5 ∣. C3 loss of function in AAV-YAP5SA mice leads to decreased cell cycle progression.
a, P8-stage WT or C3−/− mice were injected with AAV-GFP or AAV-YAP5SA and killed at P13. b,c, Flow cytometry with quantification. In WT hearts, CD45+, CD11B + MP population increases in AAV-YAP5SA (n = 5) compared to AAV-GFP (n = 5) controls. In C3−/− + AAV-YAP5SA (n = 8) hearts, the MP increase was less than WT + AAV-YAP5SA. The increase in C3ar1+ MPs observed in WT + AAV-YAP5SA hearts is absent in C3−/− + AAV-YAP5SA hearts. d,e, IF and quantification of sarcomere disassembly in indicated hearts (n = 3 for WT + AAV-GFP, n = 5 for WT + AAV-YAP5SA, n = 5 for C3−/− + AAV-GFP and n = 7 for C3−/− + AAV-YAP5SA). fh, IF and quantification of cell cycle markers (n = 3 for each group). f, Decreased number of CCNA2 (S/G2 phase) positive CMs in C3−/− + AAV-YAP5SA compared to WT + AAV-YAP5SA. g, Reduced numbers of CDK1 (G2) positive CMs in C3−/− + AAV-YAP5SA compared to WT + AAV-YAP5SA. h, Decreased number of PHH3 (M phase) positive CMs in C3−/− + AAV-YAP5SA compared to WT + AAV-YAP5SA. Scale bars in all panels, 50 μm. Statistical significance was calculated using one-way ANOVA. Error bars indicate means ± s.e.m. FSC, forward scatter.
Fig. 6 ∣
Fig. 6 ∣. Knockout of C3ar1 in AAV-YAP5SA-injected mice leads to decreased sarcomere disassembly and prolongation of cell cycle progression.
a, WT and C3ar1−/− P8 mice were injected with AAV-GFP or AAV-YAP5SA. Animals were killed at P13 for flow cytometry (b,c) or IF (ej). b, Macrophage population (CD45+ and CD11B+) is increased three times in AAV-YAP5SA (n = 4) compared to WT (n = 3) or C3ar1−/− (n = 5) + AAV-GFP. In C3ar1−/− + AAV-YAP5SA (n = 5), the MP fraction was less than WT + AAV-YAP5SA; however, the lymphocyte fraction (CD45+ and CD11B−) was significantly increased compared to the other populations. c, Quantification reveals an increase in MPs in AAV-YAP5SA compared to AAV-GFP-injected hearts. The MP population is significantly decreased in C3ar1−/− + AAV-YAP5SA compared to WT + AAV-YAP5SA. d, Lymphocytes are significantly increased in C3ar1−/− + AAV-YAP5SA hearts compared to all other groups. e, IF shows extensive sarcomere disorganization in WT + AAV-YAP5SA hearts. Sarcomere disassembly is substantially reduced in C3ar1−/− + AAV-YAP5SA hearts compared to WT + AAV-YAP5SA. f, Quantification of sarcomere disassembly shows a significant decrease in C3ar1−/− + AAV-YAP5SA compared to WT + AAV-YAP5SA CMs (n = 4 for all groups). g, Disassembled CMs significantly decreased in C3ar1−/− + AAV-YAP5SA compared to WT + AAV-YAP5SA (n = 4 for all groups). hj, Decreased CCNA2+ (h, n = 4 for all groups), CDK1+ (i, n = 3 for all groups) and PHH3+ (j, n = 4 for all groups) CMs in C3ar1−/− + AAV-YAP5SA compared to WT + AAV-YAP5SA. Scale bars, 50 μm (e,h,i) and 20 μm (j, right). Statistical significance was calculated using one-way ANOVA. Error bars indicate means ± s.e.m.
Fig. 7 ∣
Fig. 7 ∣. Knockout of C3ar1 impairs neonatal cardiac renewal after MI.
a, Sham or MI surgery was performed in C3ar1–Tomato/+ reporter mice at P2 to determine if C3ar1+ MPs expand after injury. b, Marked increase of C3ar1+ MPs in the P2 MI IZ (lack of cTnT staining) compared to MI RZ and sham. Scale bars, 50 μm c, Representative images of tdTomato and Pcna IF in BZ and IZ of a 3 DPI heart. Scale bars, 50 μm. Quantification reveals increased C3ar1+ MPs in the P2 MI IZ compared to other indicated groups. Proliferating C3ar1+ MPs (Pcna+) is increased in all MI zones compared to sham (n = 3 all groups). d, Sham or MI surgeries were performed on P4 WT and C3ar1−/− pups. Echocardiograms were collected at 10 DPI and 28 DPI. Trichrome staining was performed at 28 DPI. e, ECHO at 10 DPI and 28 DPI. EF of WT hearts is decreased at 10 DPI compared to sham controls and recover to sham levels at 28 DPI. C3ar1−/− MI hearts have reduced EF at 10 DPI and 28 DPI compared to sham controls (n = 6 each group, P < 0.001, three-way ANOVA). f, Trichrome staining of representative sections below the permanent ligation (and similar locations in sham hearts). Scarred regions (yellow arrowheads). Scale bar, 1,000 μm g, Scar area quantification. Increased total scar area in C3ar1−/− MI hearts compared to all other groups (n = 3 for sham and n = 4 for MI groups). Statistical significance was calculated using one-way ANOVA unless stated otherwise. Error bars indicate means ± s.e.m. NS, not significant.
Fig. 8 ∣
Fig. 8 ∣. Knockout of C3 alters metabolism-related transcription and reduces CM proliferation in the neonatal heart.
a, Experimental strategy. b, Echocardiograms show decreased EF in both WT + MI (n = 7) and C3−/− + MI (n = 6) compared to sham (n = 6 for WT and n = 3 for C3−/−) at 12 DPI, with recovery to levels similar to sham for WT but not for C3−/− hearts at 28 DPI (three-way ANOVA). c, Representative trichrome staining of three sections below the permanent ligation (and similar locations in sham hearts). Scarred regions (yellow arrowheads). Scale bar, 1,000 μm. d, Increased total scar area in C3−/− MI (n = 4) hearts compared to WT MI (n = 4) and both sham groups (n = 3). e, Integrated UMAP projection of WT and C3−/− MI 3 DPI snRNA-seq data (n = 2 each group) showing nine distinct cell types identified. f, Subclustering of CFs into cluster 1 (C3+) and cluster 2 (C3−). g, Differentially expressed genes between C3−/− MI versus WT MI CF cluster 1. h, GO analysis of upregulated genes in C3−/− MI CF cluster 1 shows categories related to oxidative phosphorylation, ECM organization and myeloid leukocyte migration. i, CMs subclustered into five populations: three ventricular (Vent. CM1, CM2 and CM3), a ventricular proliferative (Prol. CM) and an atrial (Atr. CM). j, In C3−/− MI hearts, Prol. CMs are substantially decreased compared to WT MI hearts. Statistical significance was determined by Pearson’s chi-squared test with continuity correction. k, Differentially expressed genes between all ventricular C3−/− MI CMs versus WT MI CMs. l, Comparison between C3−/− MI and WT MI CMs, excluding Atr. CM, showed upregulated genes related to metabolism and maturation, such as ‘Oxidative phosphorylation’, ‘Muscle cell differentiation’ and ‘Adherens junction organization’. Statistical significance was calculated using one-way ANOVA unless stated otherwise. Error bars indicate means ± s.e.m. Center lines in all box plots are shown as mean values, and whiskers extend to a maximum of 1.5× IQR beyond the boxes.

References

    1. Bergmann O et al. Dynamics of cell generation and turnover in the human heart. Cell 161, 1566–1575 (2015). - PubMed
    1. Ali H, Braga L & Giacca M Cardiac regeneration and remodelling of the cardiomyocyte cytoarchitecture. FEBS J. 287, 417–438 (2020). - PubMed
    1. Puente BN et al. The oxygen-rich postnatal environment induces cardiomyocyte cell-cycle arrest through DNA damage response. Cell 157, 565–579 (2014). - PMC - PubMed
    1. Tzahor E & Poss KD Cardiac regeneration strategies: staying young at heart. Science 356, 1035–1039 (2017). - PMC - PubMed
    1. Porrello ER et al. Transient regenerative potential of the neonatal mouse heart. Science 331, 1078–1080 (2011). - PMC - PubMed