. 2024 Feb 29;27(4):109355.
doi: 10.1016/j.isci.2024.109355. eCollection 2024 Apr 19.

Quantitative proteome dynamics across embryogenesis in a model chordate

Affiliations

Quantitative proteome dynamics across embryogenesis in a model chordate

Alexander N Frese et al. iScience. .

Abstract

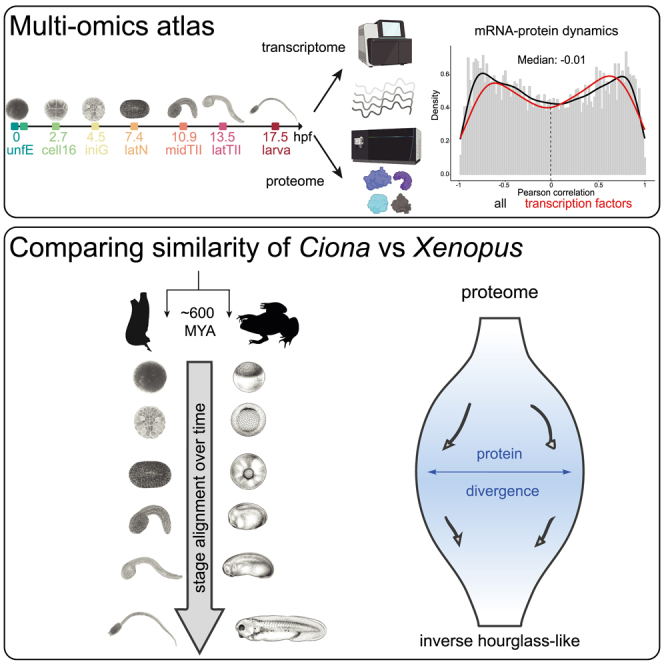
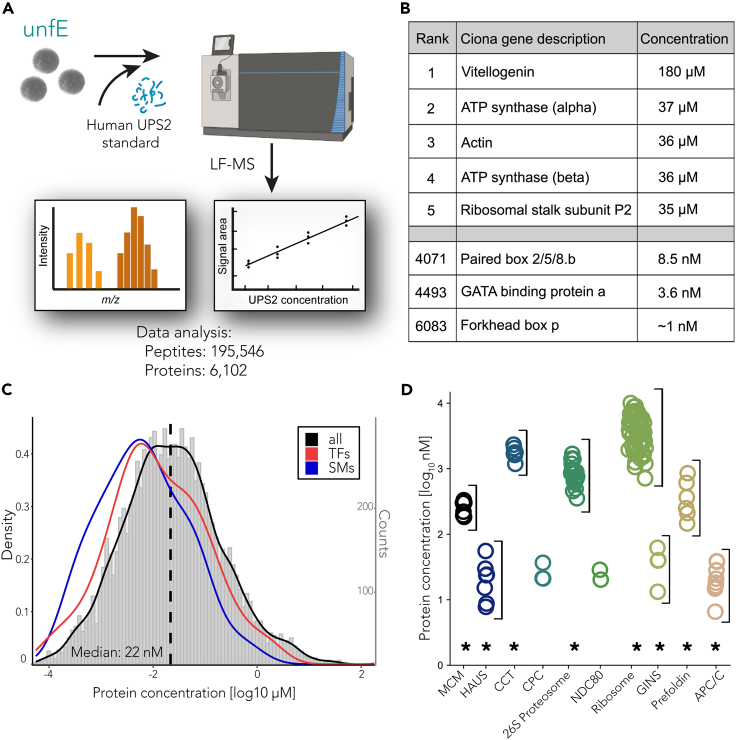
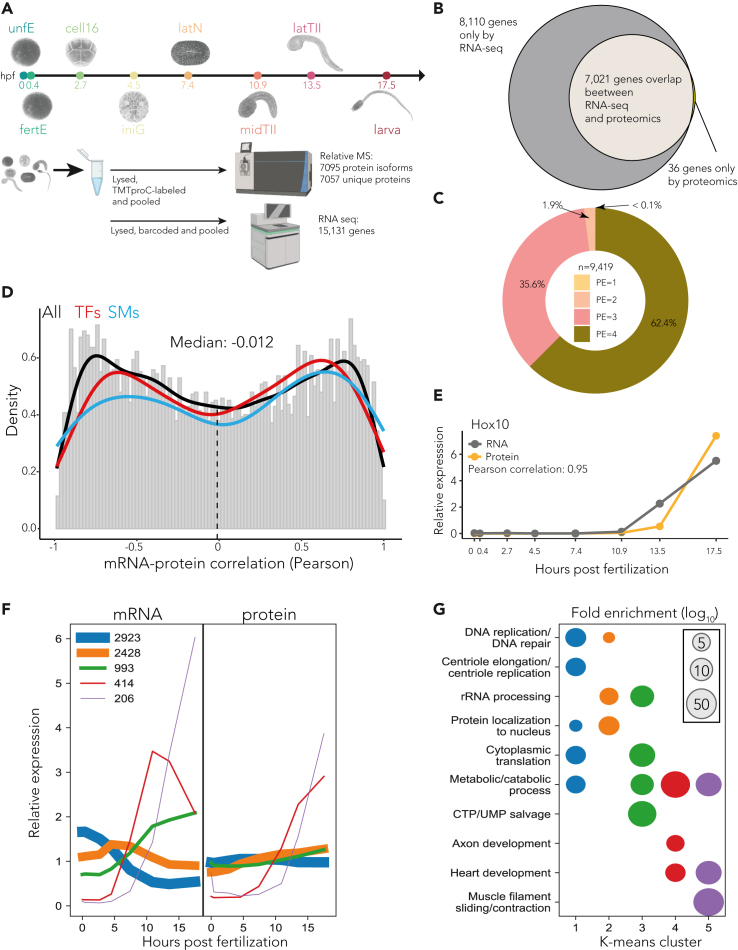
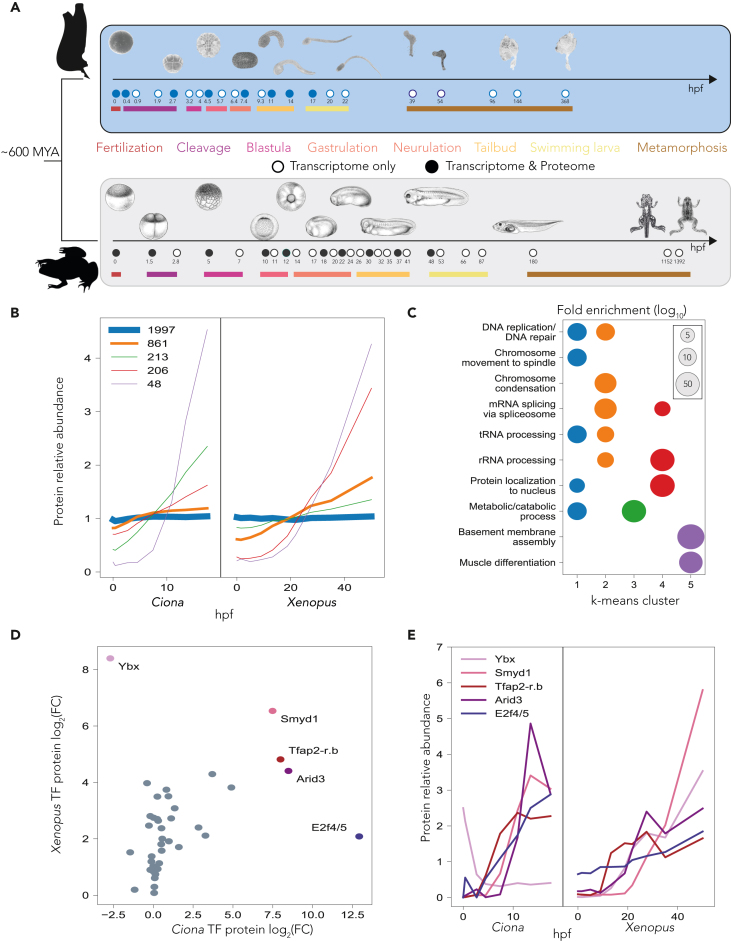
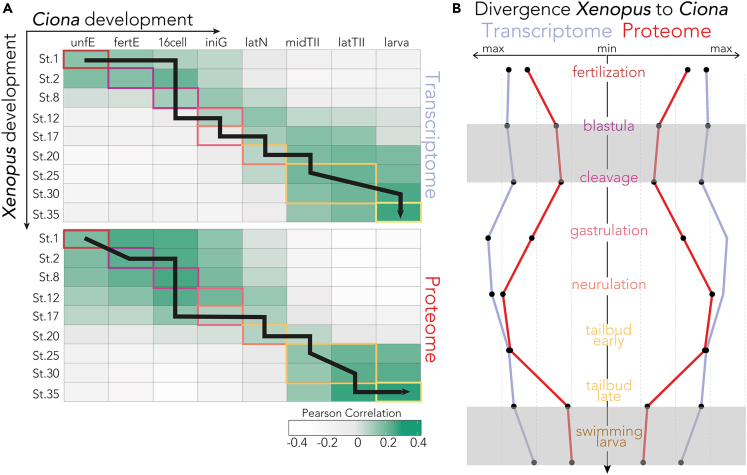
The evolution of gene expression programs underlying the development of vertebrates remains poorly characterized. Here, we present a comprehensive proteome atlas of the model chordate Ciona, covering eight developmental stages and ∼7,000 translated genes, accompanied by a multi-omics analysis of co-evolution with the vertebrate Xenopus. Quantitative proteome comparisons argue against the widely held hourglass model, based solely on transcriptomic profiles, whereby peak conservation is observed during mid-developmental stages. Our analysis reveals maximal divergence at these stages, particularly gastrulation and neurulation. Together, our work provides a valuable resource for evaluating conservation and divergence of multi-omics profiles underlying the diversification of vertebrates.

Keywords: Animals; Embryology; Evolutionary developmental biology; Proteomics; Transcriptomics.


Conflict of interest statement

The authors declare no competing interests.

Figures

None
Graphical abstract
Figure 1
Figure 1
Absolute proteomics of the Ciona egg (A) Schematic of label-free proteomics utilized to determine absolute protein concentrations. Unfertilized Ciona eggs were lysed, and human proteins of known concentrations (UPS2) were added to the lysate as a reference standard. Following normalization as outlined in the materials and methods, we detect ∼195,000 peptides and estimate protein concentrations for ∼6,000 proteins. (B) Table of selected proteins in the unfertilized egg including the top 5 most abundant and some transcription factors important to embryonic development. (C) Histogram of all quantified proteins in the Ciona egg (gray) with superimposed kernel density estimates (KDE) of transcription factors (TFs - red) and signaling molecules (SMs - blue). Both TFs and SMs follow a distribution similar to the global egg proteome (black) but with a lower median concentration. The complete data is provided in Table S1. (D) Stoichiometries of protein complexes. Concentrations of subunits from a shared protein complex display comparable values and show typically a statistically different distribution than the entire proteome (∗p < 0.01, two-way ANOVA with Tukey’s multiple-comparisons test).
Figure 2
Figure 2
Proteome and RNA analyses during Ciona embryogenesis (A) Overview of the transcriptome and proteome time-course experiments. Staged embryos were collected at eight developmental stages, beginning with unfertilized egg (unfE), fertilized egg (fertE), 16-cell stage (cell-16), initial gastrula (iniG), late neurula (latN), middle tailbud II (midTII), late tailbud II (latTII), and hatching tadpole (larva). Each stage is represented by a unique color code, and abbreviation; both are kept consistent throughout the figures. Time indicates hours postfertilization (hpf). (B) Number and overlap of identified protein-coding genes in the transcriptome and proteome datasets. (C) Donut plot with the percentage of protein evidence categories from UniProt that are identified at the proteome level (9,419 entries). Evidence level: (1) protein evidence; (2) transcript evidence; (3) homology; (4) predicted. (D) Histogram of Pearson correlations between RNA and corresponding protein dynamics throughout Ciona development (gray). The lines represent kernel density estimates (KDE) for all genes (black), transcription factors (red), and signaling molecules (blue). Notably, mRNA dynamics correlate poorly with protein dynamics. n = 7021 pairs. (E) Example of high Pearson correlation between RNA and protein dynamics for the transcription factor Hox10. (F) K-means clustering used to classify RNA (left) and protein (right) dynamics for each gene during Ciona development. The thickness of the lines scales with the number represented in each cluster, as indicated in the legend. (G) GO term analysis used to discern the functional relevance of each of the clusters (indicated by matching colors) identified in F.
Figure 3
Figure 3
Comparison of development between chordate and vertebrate (A) Experimental design of the inter-species comparative developmental transcriptome and proteome time courses. Full circles highlight stages of development sampled for RNA-seq and proteomics. Mya, million years ago. (B) K-means co-clustering of the dynamics of orthologs (3,325) between Ciona and Xenopus development. The thickness of the line scales with the number of proteins represented in each cluster. The number of proteins in each cluster are quantified in the legend. Xenopus proteome time series from Sonnett et al. (C) GO term analysis identifying the functional significance of each of the clusters from B. The color of the clusters in B is kept consistent. (D) The log2 fold change (FC) protein correlation between Ciona and Xenopus TFs. Here, FC is defined as the ratio of relative protein abundance in the larva stage compared to the egg. Most TFs show similar behavior with the notable exception of Ybx. (E) Relative protein dynamics of TFs Ybx, Smyd1, Tfap2-r.b, Arid3, and E2f4/5. Each exhibit large fold changes in both organisms. Colors are preserved in these five proteins from the plotting in D. These TFs are canonically important for organism development by regulating transcriptional activation during the cell cycle, early muscle development, ectoderm development, gene activation through chromatin remodeling, and Nodal signaling respectively. Ybx exhibits signs of being maternally deposited in Ciona, but not in Xenopus, suggesting functional evolutionary divergence of this ortholog from chordate to vertebrate. Xenopus illustrations © Natalya Zahn (2022).
Figure 4
Figure 4
The protein anti-hourglass model (A) Similarity heatmaps showing Pearson similarity between the two species for each investigated time point. Developmental stages are color-coded as defined in Figure 3A. The black line follows the highest correlation of the Xenopus time-point for each Ciona stage (n = 3,350, Xenopus transcriptome from Hu et al., and Session et al.,. Xenopus proteome from Sonnett et al.106). (B) Temporal divergence of gene (blue) and protein (red) expression from Xenopus embryogenesis to each Ciona stage. Maximal similarity is represented by the smallest distance from the center line, revealing a nested hourglass model in which the proteome exhibits more evident bottlenecks at early and later stages. Gray boxes outline these periods of minimal divergence. Regardless of stage, proteins show higher similarity between the two species' developmental mapping than RNA-seq, suggesting that protein dynamics are evolutionarily more conserved than mRNA dynamics (n = 3,350, Xenopus transcriptome from Hu et al., and Session et al.,. Xenopus proteome from Sonnett et al.106).

References

    1. Hausser J., Mayo A., Keren L., Alon U. Central dogma rates and the trade-off between precision and economy in gene expression. Nat. Commun. 2019;10:68. doi: 10.1038/s41467-018-07391-8. - DOI - PMC - PubMed
    1. Li G.-W., Burkhardt D., Gross C., Weissman J.S. Quantifying Absolute Protein Synthesis Rates Reveals Principles Underlying Allocation of Cellular Resources. Cell. 2014;157:624–635. doi: 10.1016/j.cell.2014.02.033. - DOI - PMC - PubMed
    1. Teixeira F.K., Lehmann R. Translational Control during Developmental Transitions. Cold Spring Harb. Perspect. Biol. 2019;11:a032987. doi: 10.1101/cshperspect.a032987. - DOI - PMC - PubMed
    1. Peshkin L., Wühr M., Pearl E., Haas W., Freeman R.M., Gerhart J.C., Klein A.M., Horb M., Gygi S.P., Kirschner M.W. On the Relationship of Protein and mRNA Dynamics in Vertebrate Embryonic Development. Dev. Cell. 2015;35:383–394. doi: 10.1016/j.devcel.2015.10.010. - DOI - PMC - PubMed
    1. Smits A.H., Lindeboom R.G.H., Perino M., van Heeringen S.J., Veenstra G.J.C., Vermeulen M. Global absolute quantification reveals tight regulation of protein expression in single Xenopus eggs. Nucleic Acids Res. 2014;42:9880–9891. doi: 10.1093/nar/gku661. - DOI - PMC - PubMed