. 2024 Feb 28;27(4):109343.
doi: 10.1016/j.isci.2024.109343. eCollection 2024 Apr 19.

Non-random spatial organization of telomeres varies during the cell cycle and requires LAP2 and BAF

Affiliations

Non-random spatial organization of telomeres varies during the cell cycle and requires LAP2 and BAF

Debora Keller et al. iScience. .

Abstract

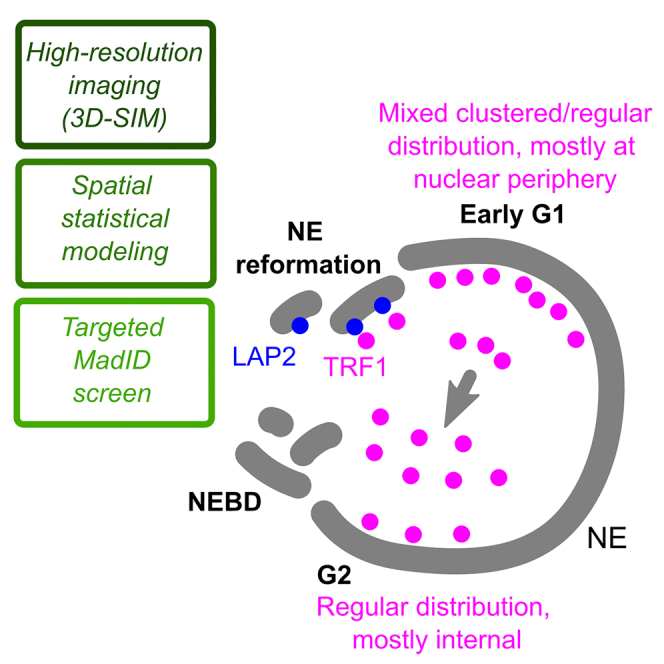
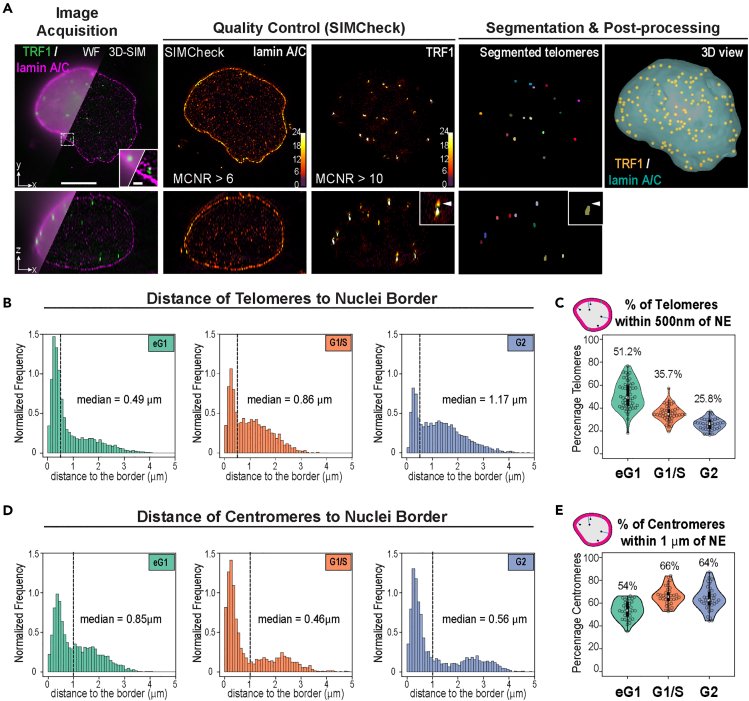
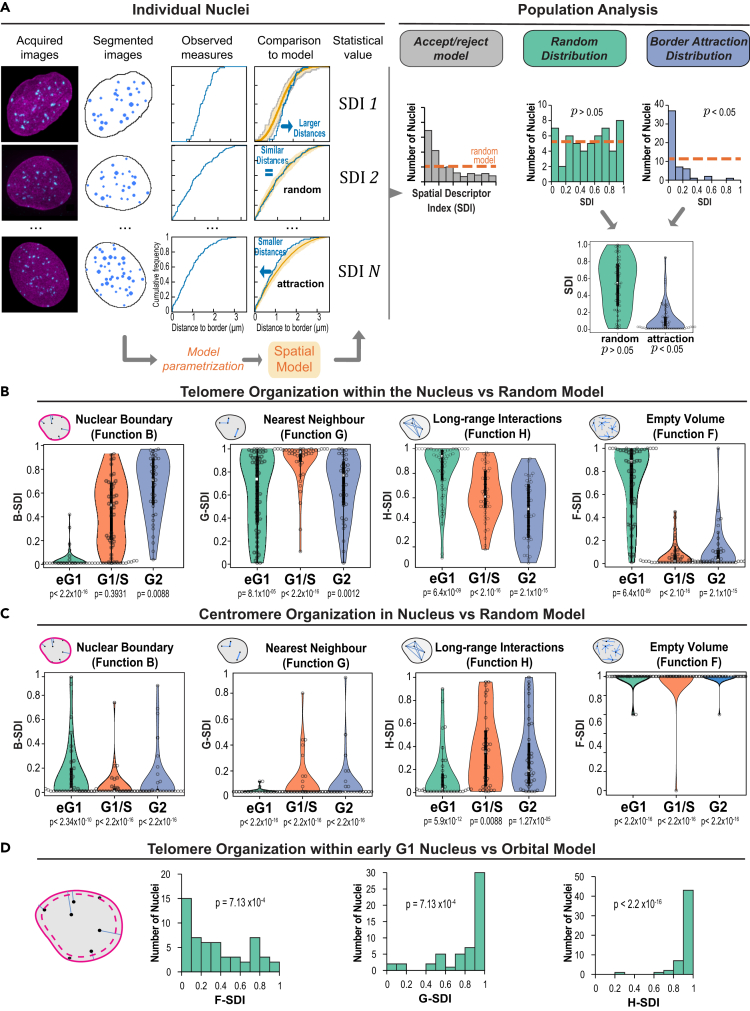
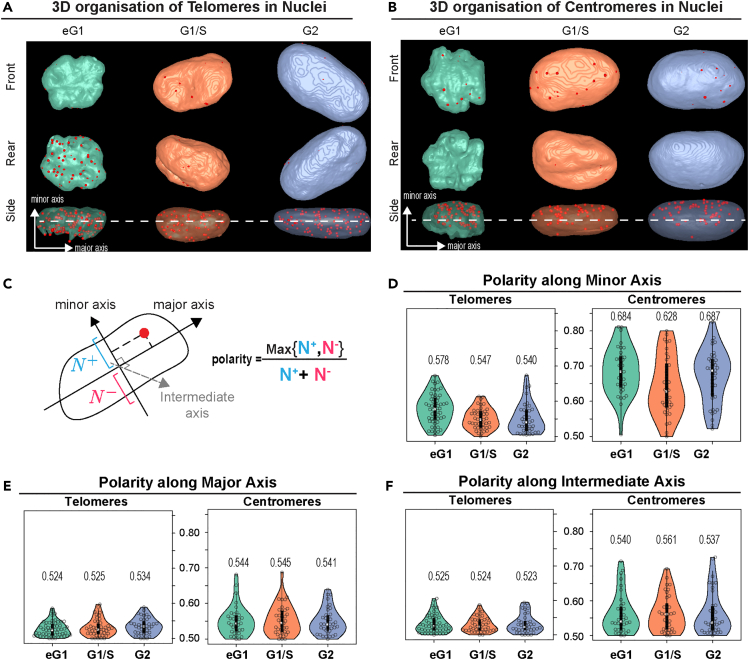
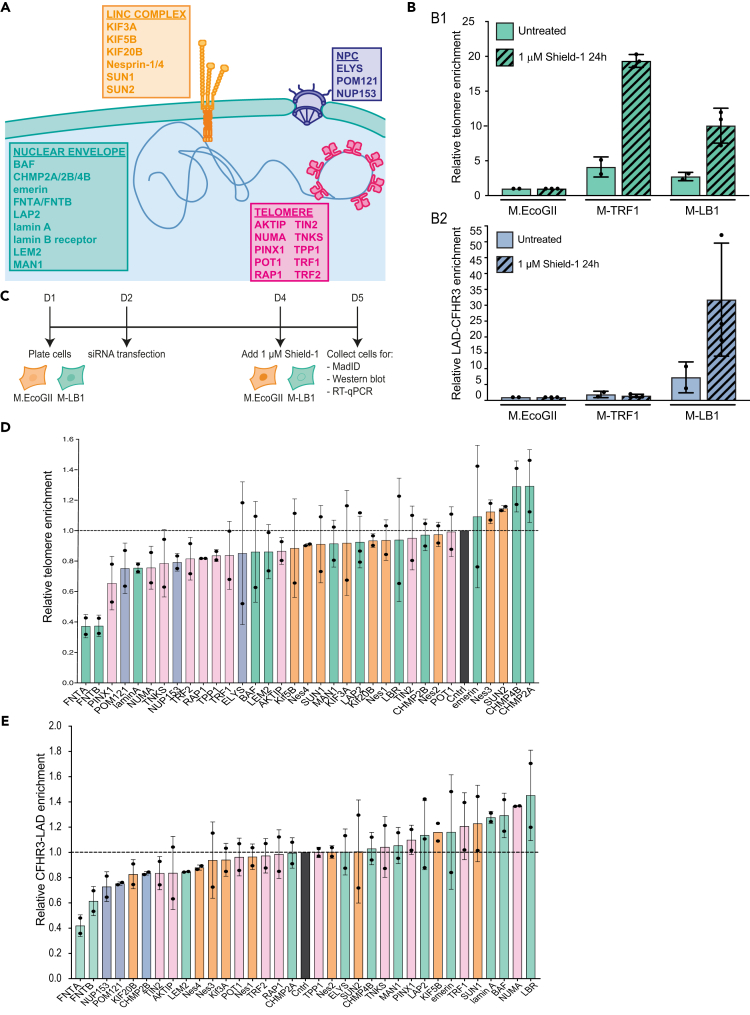
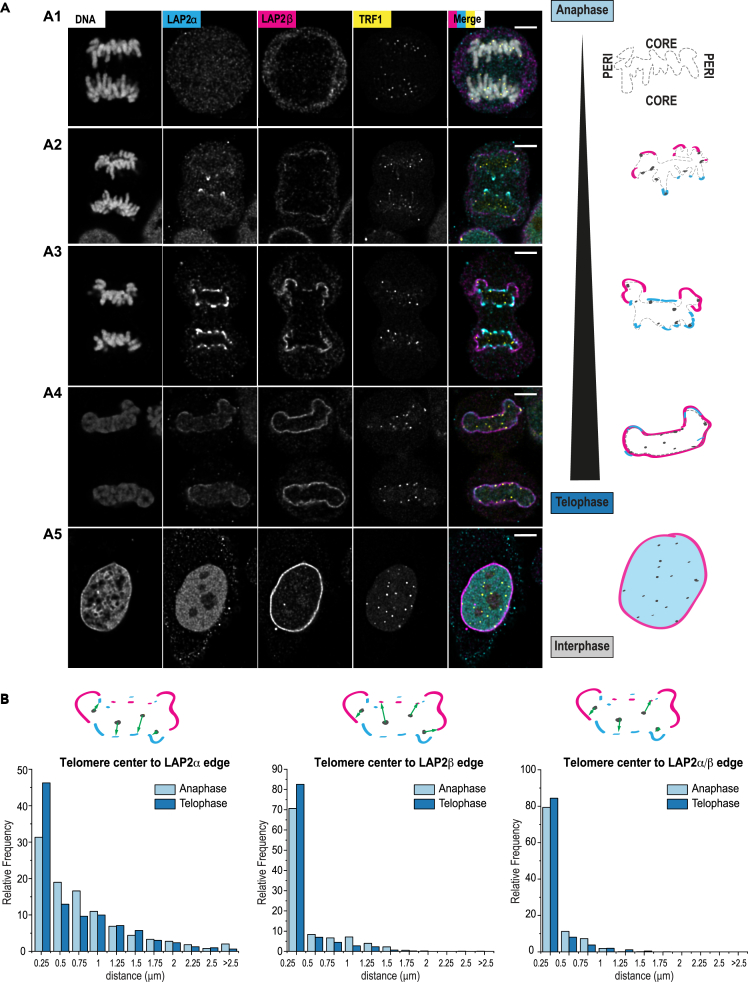
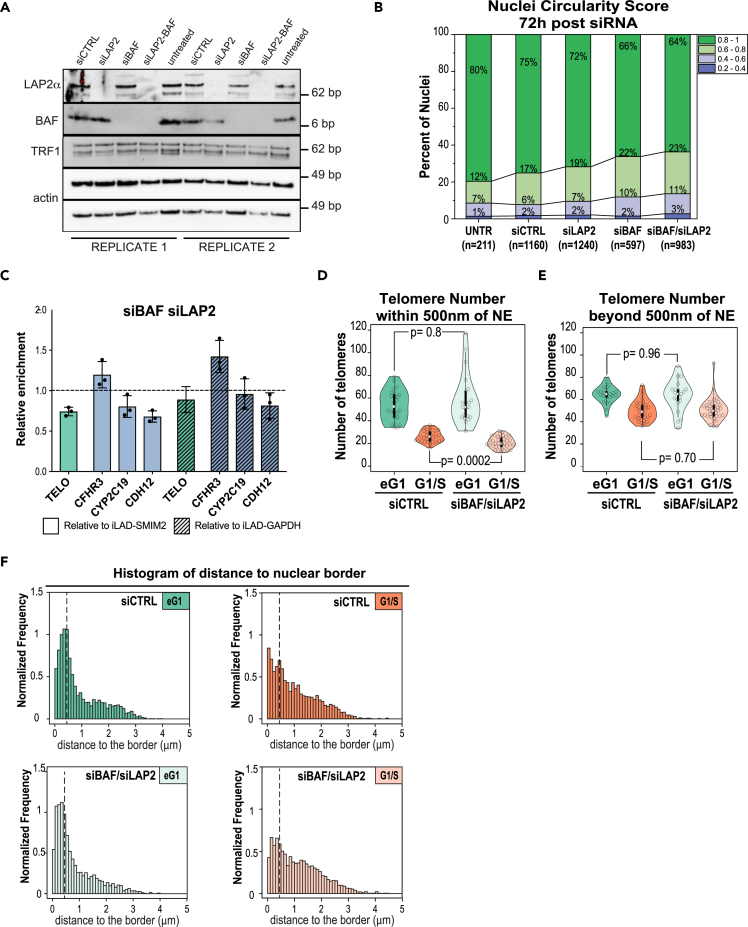
Spatial genome organization within the nucleus influences major biological processes and is impacted by the configuration of linear chromosomes. Here, we applied 3D spatial statistics and modeling on high-resolution telomere and centromere 3D-structured illumination microscopy images in cancer cells. We found a multi-scale organization of telomeres that dynamically evolved from a mixed clustered-and-regular distribution in early G1 to a purely regular distribution as cells progressed through the cell cycle. In parallel, our analysis revealed two pools of peripheral and internal telomeres, the proportions of which were inverted during the cell cycle. We then conducted a targeted screen using MadID to identify the molecular pathways driving or maintaining telomere anchoring to the nuclear envelope observed in early G1. Lamina-associated polypeptide (LAP) proteins were found transiently localized to telomeres in anaphase, a stage where LAP2α initiates the reformation of the nuclear envelope, and impacted telomere redistribution in the next interphase together with their partner barrier-to-autointegration factor (BAF).

Keywords: Chromosome organization; Membrane architecture; Molecular interaction.


Conflict of interest statement

The authors declare no competing interests.

Figures

None
Graphical abstract
Figure 1
Figure 1
Quantitative analysis of 3D-SIM images of HeLa cell nuclei shows dynamic positioning of telomeres during cell cycle (A) Overview of the analysis pipeline from image acquisition to segmentation and post-processing. Representative images of nuclei stained for TRF1 (green) and lamin A/C (magenta) highlighting the increased resolution in 3D-SIM compared to pseudo widefield (WF, top left) in the lateral xy and axial xz directions. The quality of 3D-SIM images was assessed using SIMCheck; cells with adequate modulation contrast (MCNR) values for lamin A/C and TRF1 were then segmented and processed. Telomeres segmented with a specifically developed pipeline described in the STAR Methods are shown in individual XY and XZ sections. Inset: artifactual echoes in the SIM reconstruction are removed by the segmentation pipeline. 3D view shows segmented telomeres (Yellow dots) within a segmented nucleus (Blue surface). Scale bars: 5 μm (main) and 1 μm (inset). (B) Distribution of distances between telomeres and nuclear border during cell cycle and their median value showing increased distance to the NE (early G1 phase, N = 54 nuclei; G1/S phase, N = 43 nuclei; G2 phase, N = 39 nuclei). Distance was measured from the center of each telomere to the closest point at the nuclear surface. Frequencies were normalized to obtain a unit area histogram. The dotted line is set at 0.5 μm and represents the estimated thickness of the nuclear lamina but also correspond to the cutoff between the two pools of telomeres. (C) Distribution of percentage of telomeres located at a distance below 500 nm from nuclear border in individual nuclei during cell cycle. (D) Same as B for centromeres (N = 35, 36, and 38 for early G1, G1/S, and G2 phases, respectively). The dotted line is set at 1 μm and corresponds to the cutoff between the two pools of centromeres. (E) Distribution of percentage of centromeres located at a distance below 1 μm from nuclear border in individual nuclei during cell cycle.
Figure 2
Figure 2
Statistical spatial analysis shows a dynamic switch in the spatial interactions between telomeres and nuclear envelope during the cell cycle (A) Statistical spatial analysis pipeline: illustration with the testing of spatial interaction with the nuclear border. Based on the cumulative distribution function (CDF) of the distance between telomeres and nuclear border, observed individual patterns were compared to predicted patterns under a random model of organization. For each pattern, the probability of observing smaller distances under the model than actually observed was computed (spatial descriptor index, SDI). Upon a positive spatial interaction (attraction) between telomeres and nuclear border, small values of the SDI are expected because smaller distances should be observed as compared to model predictions. In the absence of any spatial interaction, a uniform distribution is expected (Orange dotted line). The Kolmogorov-Smirnov goodness-of-fit test is used to assess the uniformity of the population distribution of the SDI. (B) Analysis of spatial interactions between telomeres and nuclear border or between telomeres using comparisons to the random model of telomere organization. Function B: distribution of SDI computed using the CDF of the distance between each telomere and nuclear border. Function G: distribution of SDIs computed based on the cumulative distribution function of the distance between each telomere and its closest neighbor. Function H: distribution of SDIs computed based on the distance between each telomere and any other telomere. Function F: distribution of SDIs computed based on the distance between arbitrary nuclear positions and their closest telomeres. (p: p value of Kolmogorov-Smironov test of uniformity). Early G1 phase, N = 54 nuclei; G1/S phase, N = 43 nuclei; G2 phase, N = 39 nuclei. (C) Same as B for centromeres. Early G1 phase, N = 35 nuclei; G1/S phase, N = 36 nuclei; G2 phase, N = 38 nuclei. (D) Analysis of spatial interactions between telomeres in early G1 using comparisons to the orbital model of telomere organization (N = 54 nuclei). The scheme illustrates the orbital model, which is similar to the completely random model of telomere organization except that the observed distance between each telomere and nuclear border is preserved.
Figure 3
Figure 3
Polarity analysis of telomere and centromere nuclear organization across the cell cycle (A) 3D views of segmented sample nuclei (Color surfaces) and their telomeres (Red spots) at different phases of the cell cycle. Nuclear surfaces are displayed opaque in front and rear views and are transparent in side views. The minor axis is orthogonal to the plane of view in front and rear views. The dotted line represents the middle plane of the cell that would be used on a 2D based analysis. (B) Same as A for centromeres. (C) Schematic of computation of the polarity index along the minor axis of the nucleus. Positions are projected along a given axis, and the proportions of projections located above and below the center of the nucleus are computed. The polarity index is the largest of these two proportions. It can be computed for the major, minor, or intermediate axes. (D) Cell-cycle distribution of the polarity index along the minor nuclear axis for telomeres and centromeres. Median values are indicated. The Kruskal-Wallis rank-sum test showed significant effect only for telomere polarity along the minor axis (p = 0.0006). Post hoc comparison tests (Wilcoxon test with Benjamini-Hochberg correction for multiple testing) showed significant difference between early G1 and the two other stages (eG1 vs. G1/S: p = 0.002; eG1 vs. S/G2: p = 0.002; G1/S vs. S/G2: p = 0.534). For telomeres N = 54, 43, and 39 for early G1, G1/S, and G2 phases, respectively. For centromeres N = 35, 36, and 38 for early G1, G1/S, and G2 phases, respectively. (E) Same as D for polarity index along the major axis. (F) Same as D for polarity index along the intermediate axis.
Figure 4
Figure 4
MadID-based targeted screen reveals factors involved in telomere interaction with the nuclear envelope (A) Scheme of proteins selected for the targeted MadID screen. Selected proteins belong to four categories: members of the linker of nucleoskeleton and cytoskeleton complex (LINC, orange), members of the nuclear pore complex (blue), members of the shelterin complex (magenta), and nuclear envelope-related proteins (green). (B) Relative telomere (top) and LAD-CFHR3 (bottom) enrichment in cells expressing M.EcoGII, M-TRF1, or M-LB1, in absence (n = 2) or presence (n = 3) of Shield-1 (1 μM, 24h). Mean ± SD is shown. (C) Experimental setup of MadID-based targeted screen. (D) Relative telomere enrichment upon depletion of the indicated proteins. The mean telomere enrichment is shown relative to iLAD-SMIM2 and to control condition (set at 1). The whiskers represent the standard deviation. Individual values are shown as black circles. n = 2 except for LAP2 (n = 3). For simplification, Nesprin-1/4 were labeled as Nes 1–4. (E) Relative LAD-CFHR3 enrichment upon depletion of the indicated proteins. The mean LAD-CFHR3 enrichment is shown relative to iLAD-SMIM2 and to control condition (set at 1). The whiskers represent the standard deviation. Individual values are shown as black circles. n = 2 except for LAP2 (n = 3).
Figure 5
Figure 5
LAP2α and LAP2β are recruited to telomeres in early anaphase (A) Representative images and corresponding schematics illustrating the stepwise recruitment of LAP2α (cyan) and LAP2β (magenta) at telomeres (TRF1 – yellow) and chromosomes (DNA – gray) from anaphase to interphase. After being first un-detectable at anaphase onset (panel A1), LAP2α enriches at chromosome ends at telomeres and LAP2β is weakly detected at peripheral DNA (panel A2) followed by stronger enrichment of LAP2α at the core and LAP2β extends at the periphery (panel A3) until in Telophase all the DNA is encapsulated by LAP2β and LAP2α decreases at the nuclear envelope (panel A4). In interphase, LAP2β remains enriched at the nuclear envelope and LAP2α appears primarily nucleoplasmic (panel A5). Scale bars: 5 μm (main). (B) Histograms of relative frequencies (%) of telomeres’ distances from the center of mass of the segmented signal to the edges of segmented signal from LAP2α, LAP2β, or a segmentation mask combining both stainings (LAP2α + LAP2β). Segmentations were computed from deconvolved confocal images of cells in anaphase (typically with morphologies as in A3) and in telophase (morphologies as in A4). Error bar indicates standard error of the mean; N = 8 cells in anaphase, N = 12 cells in telophase; number of segmented telomeres per cells vary and are not indicated.
Figure 6
Figure 6
Depletion of LAP2α/β and BAF by siRNA affects 3D genome organization (A) Western blot of whole-cell extracts showing the decreased protein levels of LAP2α or BAF in cells treated with siRNA against LAP2 (siLAP2) or BAF (siBAF) or both (siLAP2-BAF) compared to scrambled siRNA (siCTRL) or untreated cells. TRF1 is unaffected, actin serves as loading control. Two independent experiments are shown. (B) Changes in nuclear circularity 72 h post-treatment, with an increase in abnormal shapes (circularity between 0.2 and 0.6) in siRNA-treated cells compared to control. Number of analyzed cells is indicated below from at least 2 independent experiments. (C) Relative telomere, LAD-CFHR3, LAD-CYP2C19, and LAD-CDH12 enrichment calculated over iLAD-SMIM2 or iLAD-GAPDH and control condition (set at 1) in BAF- and LAP2-depleted cells. n = 3. Mean ± SD is shown. (D and E) Effect of double siBAF/siLAP2 on the total number of peripheral (D) and internal (E) telomeres in early G1 and G1/S phases, with a significant decrease of periphal telomeres in double-depleted siBAF/siLAP2 cells in G1/S phase. The p value of the Wilcoxon unpaired test is indicated. (F) Distribution of the distance between each telomere and nuclear border in control (Top) and siBAF/siLAP2 treated (Bottom) nuclei in early G1 and G1/S phases indicating a decreased frequency of telomeres associated to the nuclear envelope (below dotted bar indicating 500 nm cutoff).

Similar articles

Cited by

References

    1. Gruenbaum Y., Foisner R. Lamins: Nuclear Intermediate Filament Proteins with Fundamental Functions in Nuclear Mechanics and Genome Regulation. Annu. Rev. Biochem. 2015;84:131–164. doi: 10.1146/annurev-biochem-060614-034115. - DOI - PubMed
    1. Falk M., Feodorova Y., Naumova N., Imakaev M., Lajoie B.R., Leonhardt H., Joffe B., Dekker J., Fudenberg G., Solovei I., Mirny L.A. Heterochromatin drives compartmentalization of inverted and conventional nuclei. Nature. 2019;570:395–399. doi: 10.1038/s41586-019-1275-3. - DOI - PMC - PubMed
    1. Solovei I., Thanisch K., Feodorova Y. How to rule the nucleus: divide et impera. Curr. Opin. Cell Biol. 2016;40:47–59. doi: 10.1016/j.ceb.2016.02.014. - DOI - PubMed
    1. Muller H., Gil J., Drinnenberg I.A. The Impact of Centromeres on Spatial Genome Architecture. Trends Genet. 2019;35:565–578. doi: 10.1016/j.tig.2019.05.003. - DOI - PubMed
    1. Chikashige Y., Ding D.-Q., Funabiki H., Haraguchi T., Mashiko S., Yanagida M., Hiraoka Y. Telomere-Led Premeiotic Chromosome Movement in Fission Yeast. Science. 1994;264:270–273. doi: 10.1126/science.8146661. - DOI - PubMed