. 2024 Mar 7;6(2):fcae078.
doi: 10.1093/braincomms/fcae078. eCollection 2024.

Cerebellar degeneration in gluten ataxia is linked to microglial activation

Affiliations

Cerebellar degeneration in gluten ataxia is linked to microglial activation

Mara-Luciana Floare et al. Brain Commun. .

Abstract

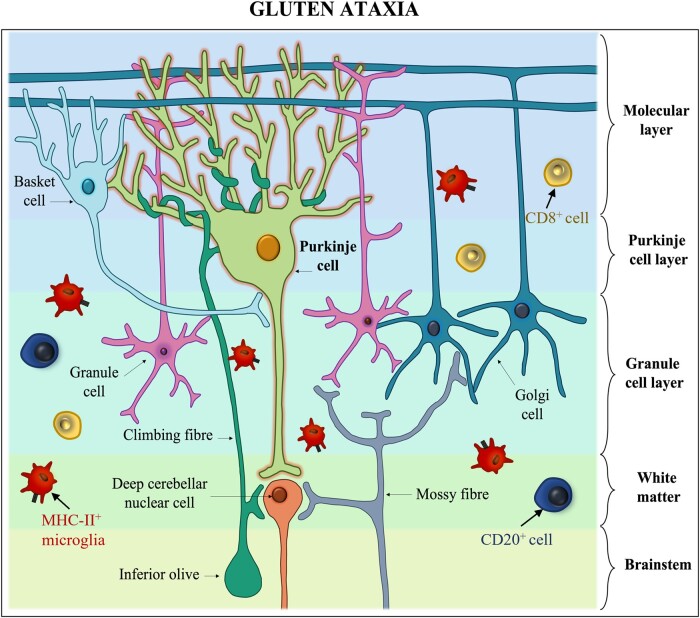
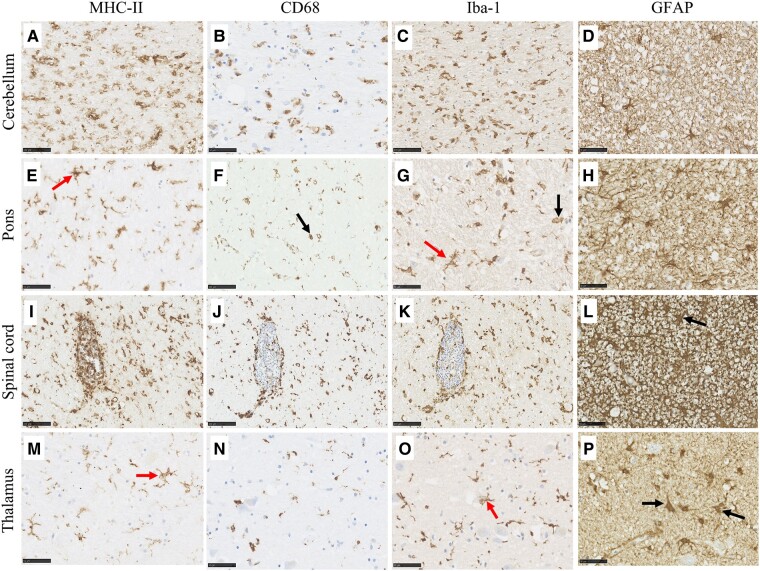
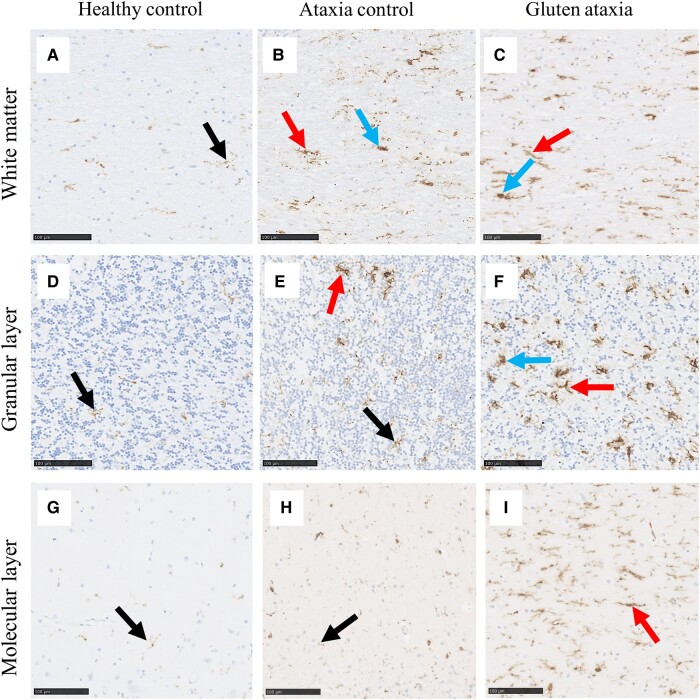
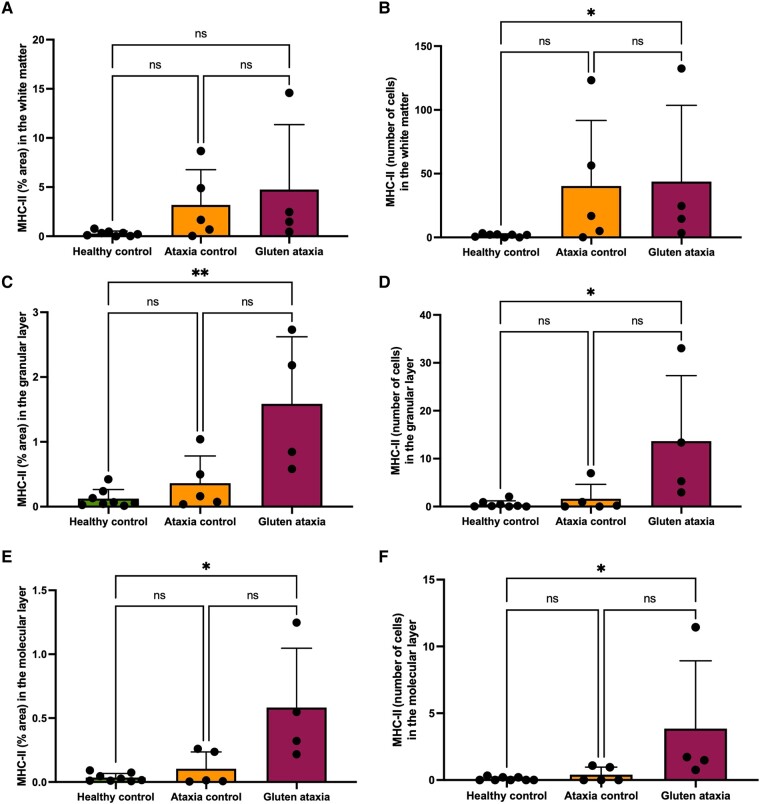
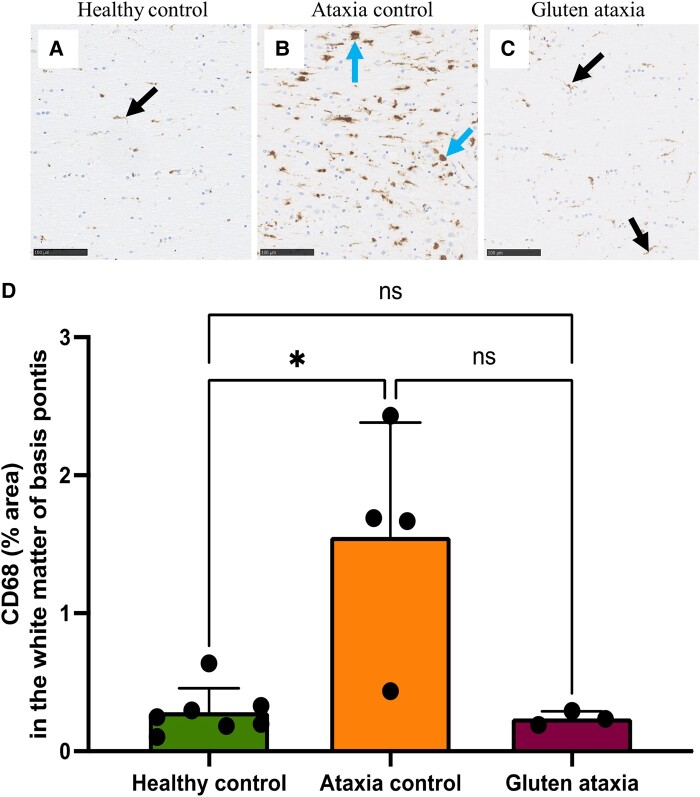
Gluten sensitivity has long been recognized exclusively for its gastrointestinal involvement; however, more recent research provides evidence for the existence of neurological manifestations that can appear in combination with or independent of the small bowel manifestations. Amongst all neurological manifestations of gluten sensitivity, gluten ataxia is the most commonly occurring one, accounting for up to 40% of cases of idiopathic sporadic ataxia. However, despite its prevalence, its neuropathological basis is still poorly defined. Here, we provide a neuropathological characterization of gluten ataxia and compare the presence of neuroinflammatory markers glial fibrillary acidic protein, ionized calcium-binding adaptor molecule 1, major histocompatibility complex II and cluster of differentiation 68 in the central nervous system of four gluten ataxia cases to five ataxia controls and seven neurologically healthy controls. Our results demonstrate that severe cerebellar atrophy, cluster of differentiation 20+ and cluster of differentiation 8+ lymphocytic infiltration in the cerebellar grey and white matter and a significant upregulation of microglial immune activation in the cerebellar granular layer, molecular layer and cerebellar white matter are features of gluten ataxia, providing evidence for the involvement of both cellular and humoral immune-mediated processes in gluten ataxia pathogenesis.

Keywords: MHC-II; gluten ataxia; gluten sensitivity; neuroimmune responses; neuroinflammation.


Conflict of interest statement

D.A. is a scientific advisor to Zedira and receives royalties for patents licensed to Zedira. The other authors report no competing interests.

Figures

Graphical Abstract
Graphical Abstract
Figure 1
Figure 1
MR spectroscopy of the vermis of the cerebellum from Patient 4. (A) Spectroscopy A was obtained at presentation of ataxia and showed reduced N-acetyl-aspartate to creatine area ratio at 0.84 (normal range is >1). There was no evidence of cerebellar atrophy. (B) Spectroscopy B was obtained several years later whilst the patient was on a strict GFD. The N-acetyl-aspartate to creatine ratio shows an increase to 0.94, an observation that is commonly seen in patients who embark on strict GFD.
Figure 2
Figure 2
Histological examination of cerebellum in GA. The cerebellum showed atrophy with subtotal loss of PCs (black arrow in A) and Bergmann gliosis (blue arrow in A). This was accompanied by attenuation of the GL (red arrow in A) and the presence of eosinophilic structures (B) and lymphocytic cuffs around blood vessels (C) in Case 1. The white matter of Case 1 displayed perivascular cuffing (D) and hyperplasia of endothelial cells (E). Immunohistochemistry to neurofilament protein displayed empty baskets where PCs were lost but surrounding axonal terminals remained (F). Scale bar represents 50 (B, F), 100 (A, C, E) and 250 µm (D).
Figure 3
Figure 3
Variation in the immunoreactive profile of B-cell and T-cell markers in GA. The cerebellar white matter displayed perivascular cuffing with numerous CD20+ cells (A) and moderate CD8+ cells (B) and a dense infiltrate of CD8+ cells in the parenchyma (red arrow in C, D). The superior cerebellar peduncles of Case 1 showed moderate infiltrate of CD8+ cells (E) whilst Case 2 displayed occasional cells positive to CD8 perivascularly in the basis pontis (F). Occasional cells positive to CD8 (G, H) were observed in the dorsal column, together with a strong perivascular lymphocytic infiltrate of CD20 (I), CD8 (J) and CD3 (K) cells. CD4+ cells were only rarely seen in the spinal cord of Case 1 (L). Scale bar represents 50 (B, D, F, H, I, K), 100 (E, G, J) and 250 μm (A, C).
Figure 4
Figure 4
Histological examination of the extra-cerebellar CNS in GA. Mild cell loss was observed in the substantia nigra of Case 2 (A, B).The gracile and cuneate nuclei in the medulla of Case 3 displayed Rosenthal fibres (C) and neuronal loss (D). Dense perivascular lymphocytic infiltration (E, F) and sclerotic vessels (G) were observed in the dorsal column of the spinal cord, whilst mild patchy loss of myelin was observed in peripheral nerve roots (H). Perivascular space widening was a common feature of thalamic vessels across all cases (I). The dentate layer appeared reduplicated in the hippocampus of Case 2 (J) and sclerotic vessels were observed in the hilus of Case 4 (black arrow in K and L) together with perivascular space widening (red arrow in K and L). Scale bar represents 50 (C, F, H), 100 (B, D, E, G, I, L), 250 (A, K) and 500 μm (J).
Figure 5
Figure 5
Variation in the immunoreactive profile of glial markers in the cerebellum, pons, spinal cord and thalamus of GA patients. Ameboid microglia positive to MHC-II (A), CD68, (B) and Iba-1 (C) were present in the cerebellar white matter of GA cases, together with astrogliosis (D). Pons immunoreactivity (second row) was most marked in the superior cerebellar peduncles where an upregulation in immunoreactive ameboid (black arrows in F and G) and hypertrophic (red arrows in E and G) microglia and glial fibrillary acidic protein + astrocytes (H) were observed. The spinal cord dorsal column (third row) displayed extensive microgliosis, particularly evident around dorsal column blood vessels (I–J) and dense astrogliosis (L). Astrogliosis was also present throughout the thalamus (P), together with hypertrophic microglia positive to MHC-II (M) and Iba-1 (O). Low levels of CD68 immunoreactivity were observed in the thalamus (N). Scale bar represents 50 (B, D, E, G, H, L, M–P) and 100 μm (A, C, F, I–K).
Figure 6
Figure 6
Comparison in the immunoreactive profile of MHC-II in the cerebellum between groups. In the neurologically healthy control group, MHC-II+ microglia were observed in a ramified phenotype in both the cerebellar white matter (A), as well as the GL (D) and the ML (G) of the cerebellar cortex. Hypertrophic (red arrow in B and C) and ameboid (blue arrow in B and C) MHC-II+ microglia were frequently observed in the white matter of AC (B, E) and GA (C, F) cases. In the GL (E) and ML (H) of the AC group, MHC-II+ microglia were mostly seen in a ramified phenotype (black arrow in E and H), with sparse hypertrophic microglia (red arrow in E) distributed across the cerebellar cortex. In contrast, hypertrophic MHC-II+ microglia were most abundant in both the GL (red arrow in F) and ML (I) of GA cases. Additionally, sparse ameboid MHC-II+ microglia were observed in the GL of GA cases (blue arrow in F). Scale bar represents 100 µm (A–I).
Figure 7
Figure 7
Immunoreactive profile of MHC-II in the cerebellar cortex and white matter. A significant increase in the percentage area immunoreactivity to MHC-II was observed in the GL (P = 0.0095 for Kruskal–Wallis test) (C) and ML (P = 0.0325 for Kruskal–Wallis test) (E) but not the white matter (P = 0.0637 for Kruskal–Wallis test) (A) of GA cases relative to neurologically healthy controls. Additionally, a significant increase in the number of cells positive to MHC-II was detected in the white matter (P = 0.0288 for Kruskal–Wallis test) (B), GL (P = 0.0218 for Kruskal–Wallis test) (D) and ML (P = 0.0118 for Kruskal–Wallis test) (F) of GA cases. ns, non-significant.
Figure 8
Figure 8
Immunoreactive profile of CD68 in the pontine white matter. Compared with the AC group, where a high load of CD68+ ameboid microglia were observed in the white matter of basis pontis (B), the microglia positive to CD68 in the HC (A) and GA (C) groups mainly displayed a ramified phenotype. A significant increase in CD68 immunoreactivity was measured in the basis pontis white matter of the ataxia control group compared with neurologically healthy controls (P = 0.0443 for Kruskal–Wallis test) but not to GA cases (P = 0.0698 for Kruskal–Wallis test). Scale bar represents 100 µm (A–C). ns, non-significant.

Similar articles

Cited by

References

    1. Sapone A, Bai JC, Ciacci C, et al. Spectrum of gluten-related disorders: Consensus on new nomenclature and classification. BMC Med. 2012;10(1):1–12. - PMC - PubMed
    1. Hadjivassiliou M, Grünewald RA, Davies-Jones GAB. Gluten sensitivity as a neurological illness. J Neurol Neurosurg Psychiatry. 2002;72(5):560–563. - PMC - PubMed
    1. Hadjivassiliou M, Chattopadhyay AK, Grünewald RA, et al. Myopathy associated with gluten sensitivity. Muscle Nerve. 2007;35(4):443–450. - PubMed
    1. Hadjivassiliou M, Sanders DS, Grünewald RA, Woodroofe N, Boscolo S, Aeschlimann D. Gluten sensitivity: From gut to brain. Lancet Neurol. 2010;9(3):318–330. - PubMed
    1. Kieslich M, Errázuriz G, Posselt HG, Moeller-Hartmann W, Zanella F, Boehles H. Brain white-matter lesions in celiac disease: A prospective study of 75 diet-treated patients. Pediatrics. 2001;108(2):e21. - PubMed

LinkOut - more resources