. 2023 Oct 25;9(2):163-180.
doi: 10.1016/j.jacbts.2023.08.008. eCollection 2024 Feb.

Loss of Cardiac Splicing Regulator RBM20 Is Associated With Early-Onset Atrial Fibrillation

Affiliations

Loss of Cardiac Splicing Regulator RBM20 Is Associated With Early-Onset Atrial Fibrillation

Oliver B Vad et al. JACC Basic Transl Sci. .

Abstract

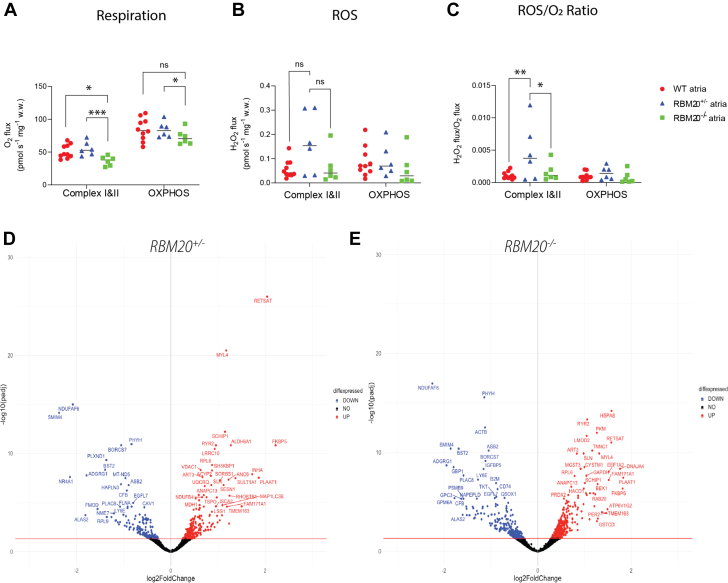
We showed an association between atrial fibrillation and rare loss-of-function (LOF) variants in the cardiac splicing regulator RBM20 in 2 independent cohorts. In a rat model with loss of RBM20, we demonstrated altered splicing of sarcomere genes (NEXN, TTN, TPM1, MYOM1, and LDB3), and differential expression in key cardiac genes. We identified altered sarcomere and mitochondrial structure on electron microscopy imaging and found compromised mitochondrial function. Finally, we demonstrated that 3 novel LOF variants in RBM20, identified in patients with atrial fibrillation, lead to significantly reduced splicing activity. Our results implicate alternative splicing as a novel proarrhythmic mechanism in the atria.

Keywords: RBM20; alternative splicing; atrial cardiomyopathy; atrial fibrillation; genetics.


Conflict of interest statement

This work was supported by the Novo Nordisk Foundation, John and Birthe Meyer Foundation, Research Foundation of the Heart Centre Rigshospitalet, Villadsen Family Foundation, Arvid Nilsson Foundation, Danish Council for Independent Research, Research Foundation at Rigshospitalet, Skibsreder Per Henriksens R., og hustrus fond, and Department of Clinical Medicine (University of Copenhagen). Dr Ahlberg has received a grant from the Novo Nordisk Foundation, BRIDGE–Translational Excellence Programme. Dr Gotthardt was supported by the Deutsche Forschungsgemeinschaft and the Leducq Foundation. Dr Svendsen has received a fee for participating in the Advisory Board (Medtronic); and speaker fees from Medtronic not related to this work. Dr Gotthardt has a consultancy agreement with River BioMedics; and has received speaker honoraria from Bayer not related to this work. Dr Olesen has received speaker fees from Biosense Webster not related to this work. All other authors have reported that they have no relationships relevant to the contents of this paper to disclose.

Figures

None
Graphical abstract
Figure 1
Figure 1
Associations Between Loss of RBM20 and Cardiac Structure and Function Volcano plot of results from genetic association test between LOF variants in RBM20 and cardiac magnetic resonance imaging data. The figure shows an association with increased left atrial minimum volume. Associations with P < 0.10 are labeled with beta coefficients (β) and P values. LAMAX = left atrial maximum volume; LAMIN = left atrial minimum volume; LATEF = left atrial total emptying fraction; LOF = loss of function; LVEDV = left ventricular end-diastolic volume; LVESV = left ventricular end-systolic volume.
Figure 2
Figure 2
Electron Microscopy Imaging and Differential Gene Expression in RBM20+/– Rat Atria (A, B) TEM images of left atria of a 3-month-old WT rat. Sarcomeres are well organized, with clearly defined Z-disks and I-bands. (C, D) TEM images from left atria of a 3-month-old RBM20+/– rat. In contrast to WT, Z-disks appear thin and fuzzy, and I-bands and M-bands are blurry and poorly defined. Mitochondria are abundant and show compromised structure. (E) A volcano plot of differentially expressed genes in RBM20+/– rat atria compared with WT rat atria. Genes shown in red are significantly up-regulated, and genes shown in blue are significantly down-regulated. (F) The 10 most up- and down-regulated gene sets by biological process in RBM20+/– rat atria compared with WT rat atria. The x-axis denotes normalized enrichment score, and the y-axis lists gene ontology pathways. Data points are colored by adjusted P value. TEM = transmission electron microscope; WT = wild type.
Figure 3
Figure 3
Electron Microscopy Imaging and Differential Gene Expression in RBM20–/– Rat Atria (A, B) TEM images of left atria of 3-month-old WT rats. Sarcomeres are well organized, with clearly defined Z-disks and I-bands. (C, D) TEM images from left atria of 3-month-old RBM20–/– rats. The images show disorganized sarcomeres and compromised mitochondrial structure. (E) A volcano plot of differentially expressed genes in RBM20–/– rat atria compared with WT rat atria. Genes shown in red are significantly up-regulated, and genes shown in blue are significantly down-regulated. (F) The 10 most up- and down-regulated gene sets by biological process in RBM20–/– rat atria compared with WT rat atria. The x-axis denotes normalized enrichment score, and the y-axis lists gene ontology pathways. Data points are colored by adjusted P value. Abbreviations as in Figure 2.
Figure 4
Figure 4
Mitochondrial Dysfunction in RBM20+/– and RBM20–/– Rat Atria (A) Significantly decreased mitochondrial respiration in RBM20–/– rat atria compared with RBM20+/– and WT rat atria. (B) A tendency toward higher ROS formation in RBM20+/– rat atria compared with WT rat atria (not significant). (C) Increased formation of mitochondrial ROS/O2 in RBM20+/– rat atria compared with RBM20–/– and WT rat atria. (D, E) Volcano plots of differentially expressed genes related to cellular respiration in RBM20+/– and RBM20–/– rat atria, respectively. Significantly up-regulated genes are depicted in red, and down-regulated genes are depicted in blue. Group differences were analyzed using a linear mixed model with the Tukey post hoc test, and values are reported as mean ± SEM. ∗∗∗P < 0.001, ∗∗P < 0.01, ∗P < 0.05. NS (not significant) indicates P > 0.05. diffexpressed = differentially expressed; OXPHOS = maximal oxidative phosphorylation; ROS = reactive oxygen species; SWT = wild type.
Figure 5
Figure 5
Rare RBM20 Variants Identified in an Early-Onset AF Cohort Affect Splicing Activity (A to D) RBM20 variants mediate splicing repression on titin-derived splicing reporter in cell culture. (A) Schematic representation of (human) RBM20 and the single nucleotide base exchange mutants (point mutants). The 2 zinc finger (ZnF) domains are depicted in blue, the RNA recognition motif (RRM) is in green, and the serine-rich domain-like domain is in orange. Unstructured regions are indicated as small gray boxes. RBM20 amino acid residues are indicated underneath the horizontal line in the scheme, and the vertical lines show changes in amino acid residue and their approximate position in the protein sequence. (B) Table of rare variants in RBM20 identified in our early-onset AF cohort. (C) Real-time reverse transcription polymerase chain reaction (SYBR Green, Thermo Fisher Scientific) analysis of HEK293 cells transfected with the TTN241-3 splicing reporter and the mutant RBM20 expression constructs; n = 3; ∗∗∗P < 0.001. (D) WesTM (ProteinSimple) analysis of RBM20 mutants, transfected into HEK293 cells, using anti-RBM20 antibody and anti-β-tubulin as the loading control. Group comparisons were analyzed by 1-way analysis of variance. AF = atrial fibrillation; HEK293 = human embryonic kidney 293 cells; NA = not available; refSNV (formerly SNP) = reference single-nucleotide variation.
Figure 6
Figure 6
Potential Mechanisms of Arrhythmia (A, B) Volcano plots of differentially expressed genes related to sarcomere function in RBM20+/– and RBM20–/– rat atria, respectively. (C, D) Volcano plots of differentially expressed genes related to intracellular calcium handling in RBM20+/– and RBM20–/– rat atria, respectively. Significantly up-regulated genes are depicted in red, and down-regulated genes are depicted in blue. (E) Hypothesized pathophysiologic mechanisms of arrhythmia in loss of RBM20. Electron microscopy, mitochondrial function analyses, and complementary DNA sequencing revealed sarcomere dysfunction and increased oxidative stress in a loss-of-RBM20 model. Ryanodine receptor 2 channels (RYR2) in the sarcoplasmic reticulum membrane play an essential role in intracellular Ca2+ dynamics. Oxidation of these channels leads to a Ca2+ leak and altered intracellular calcium dynamics. This increases the depolarizing current of the sodium calcium exchanger (NCX), facilitating AF through early afterdepolarizations. AF = atrial fibrillation; diffexpressed = differentially expressed.

References

    1. Kornej J., Börschel C.S., Benjamin E.J., Schnabel R.B. Epidemiology of atrial fibrillation in the 21st century. Circ Res. 2020;127:4–20. - PMC - PubMed
    1. Ahlsson A., Manolis A.S., Casadei B., et al. 2016 ESC guidelines for the management of atrial fibrillation developed in collaboration with EACTS. Eur Heart J. 2016;37:2893–2962. - PubMed
    1. Stewart S., Murphy N.F., Murphy N., Walker A., McGuire A., McMurray J.J.V. Cost of an emerging epidemic: an economic analysis of atrial fibrillation in the UK. Heart. 2004;90:286–292. - PMC - PubMed
    1. Dobrev D., Nattel S. New antiarrhythmic drugs for treatment of atrial fibrillation. Lancet. 2010;375:1212–1223. - PubMed
    1. Roselli C., Chaffin M.D., Weng L.-C., et al. Multi-ethnic genome-wide association study for atrial fibrillation. Nat Genet. 2018;50:1225–1233. - PMC - PubMed

LinkOut - more resources