. 2023 Dec 6;9(2):223-240.
doi: 10.1016/j.jacbts.2023.09.014. eCollection 2024 Feb.

Caloric Restriction Rejuvenates Skeletal Muscle Growth in Heart Failure With Preserved Ejection Fraction

Affiliations

Caloric Restriction Rejuvenates Skeletal Muscle Growth in Heart Failure With Preserved Ejection Fraction

Ever Espino-Gonzalez et al. JACC Basic Transl Sci. .

Abstract

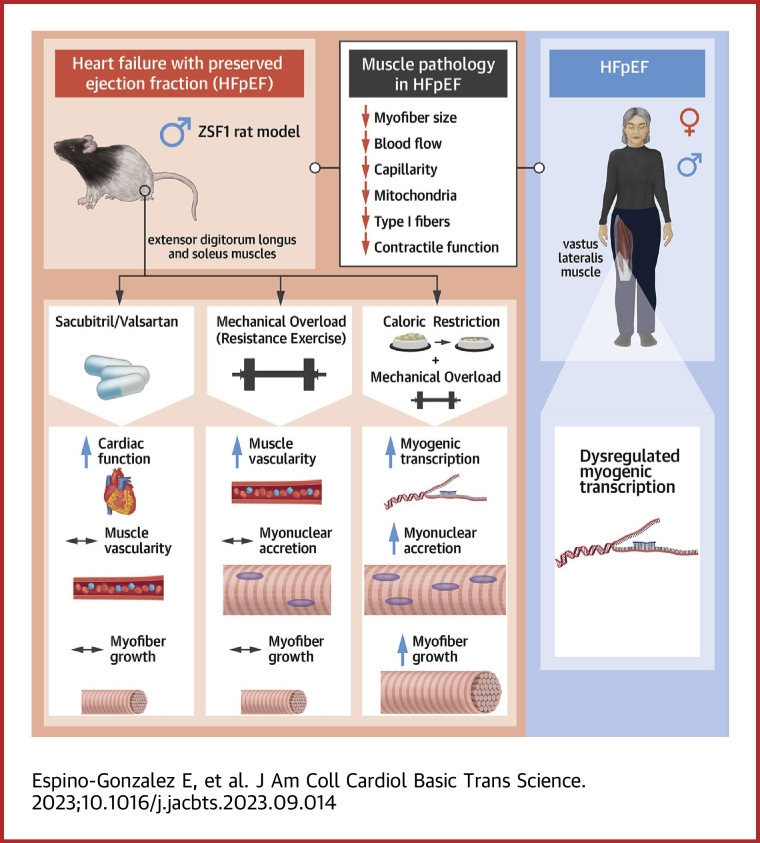
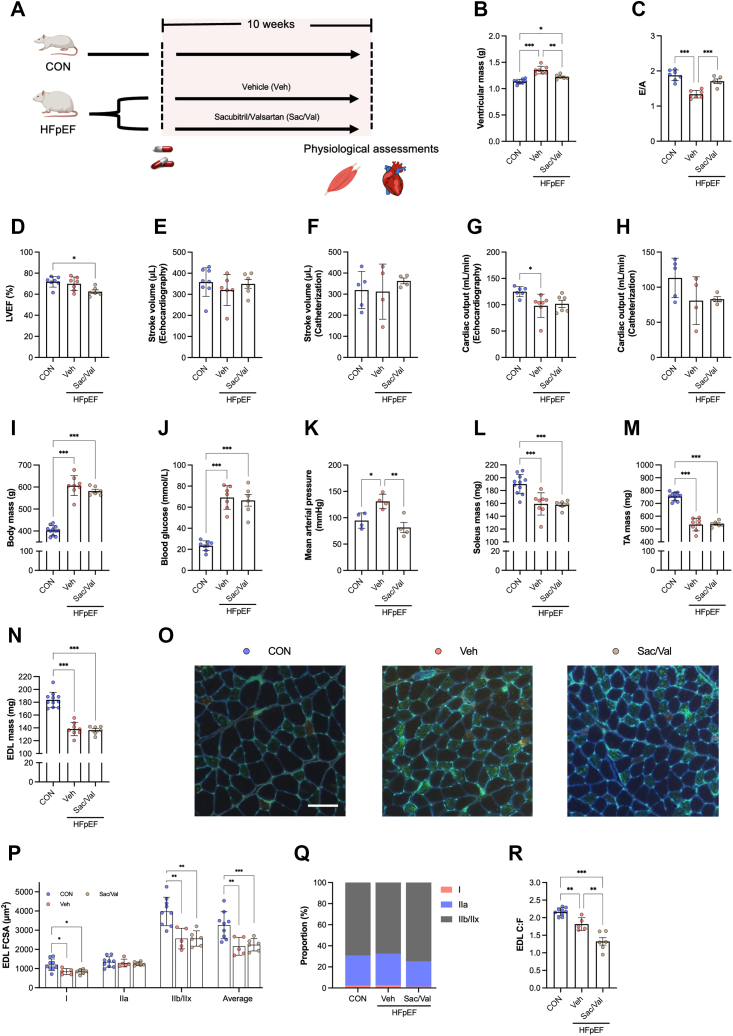
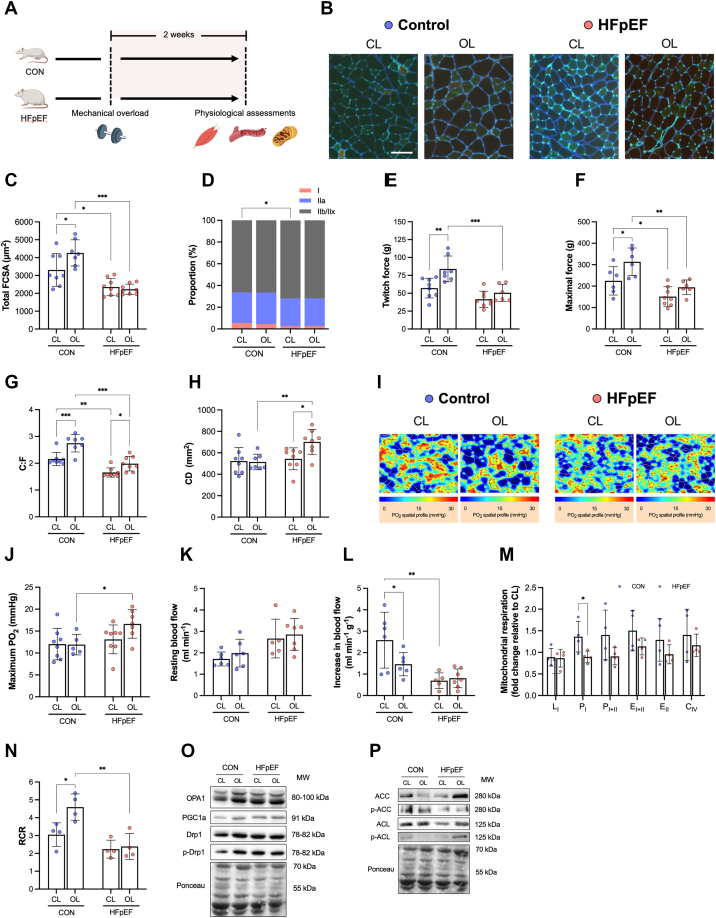
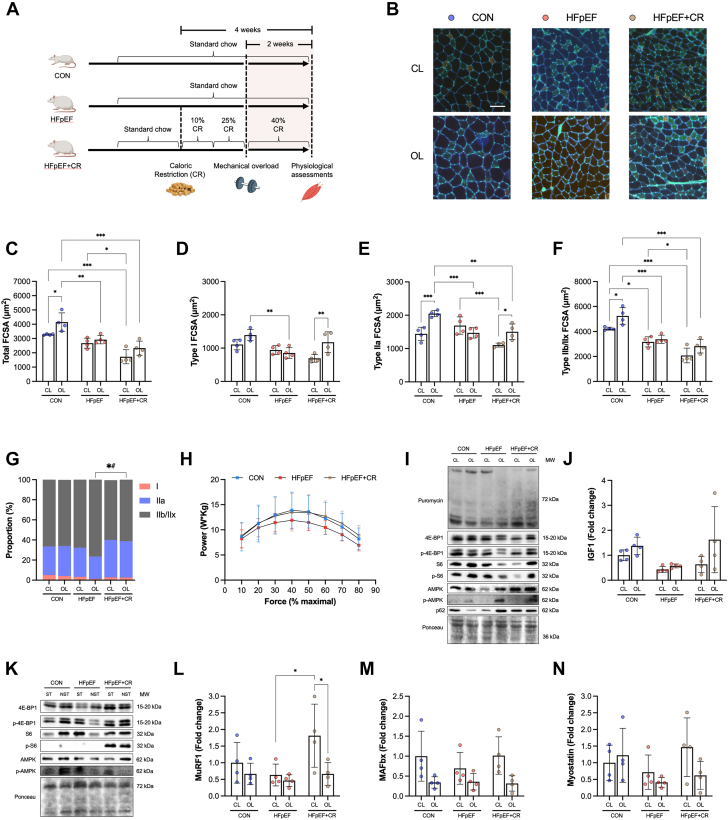
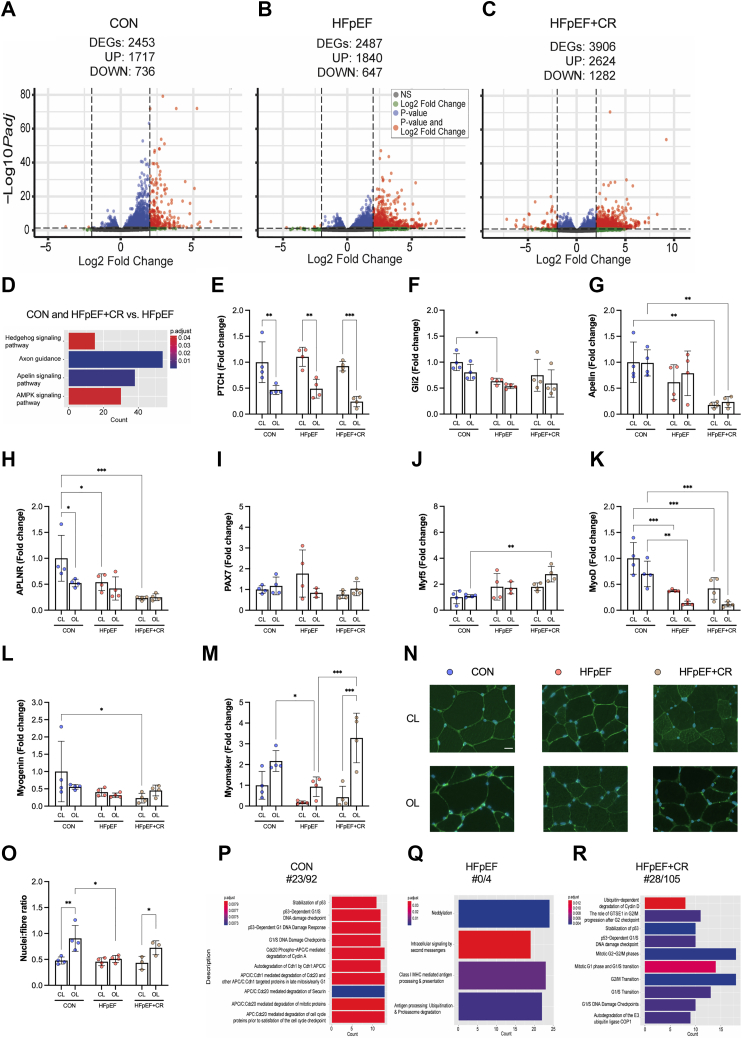
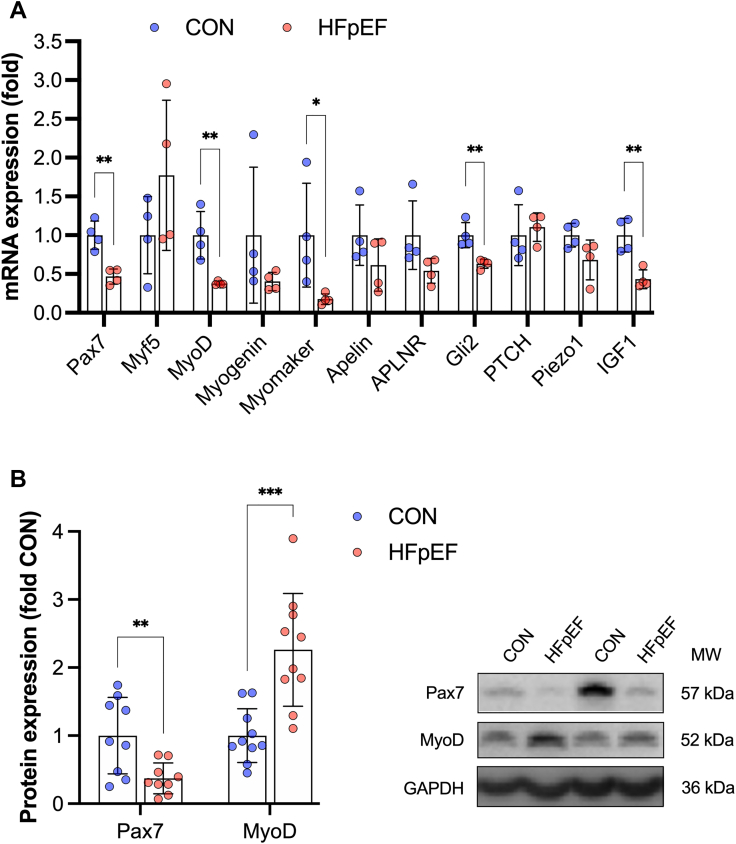
Heart failure with preserved ejection fraction (HFpEF) is a major clinical problem, with limited treatments. HFpEF is characterized by a distinct, but poorly understood, skeletal muscle pathology, which could offer an alternative therapeutic target. In a rat model, we identified impaired myonuclear accretion as a mechanism for low myofiber growth in HFpEF following resistance exercise. Acute caloric restriction rescued skeletal muscle pathology in HFpEF, whereas cardiac therapies had no effect. Mechanisms regulating myonuclear accretion were dysregulated in patients with HFpEF. Overall, these findings may have widespread implications in HFpEF, indicating combined dietary with exercise interventions as a beneficial approach to overcome skeletal muscle pathology.

Keywords: HFpEF; diet; exercise training; mitochondria; skeletal muscle.


Conflict of interest statement

Dr Espino-Gonzalez is a recipient of a doctoral fellowship from the Mexican National Council of Science and Technology (CONACYT). Dr Altara’s work was supported by a grant from the K.G. Jebsen Center for Heart Failure Research. Dr Cheng is supported by BHF Mautner Career Development Fellowship. Dr Justo da Silva was supported by the South-Eastern Norway Regional Health Authority (HSØ-RHF, Project No. 25674). Dr Booz has received support from the Pharmacology Clinical Research Core of the University of Mississippi Medical Center School of Medicine. Dr Bowen has received funding from the Medical Research Council (UK) (MR/S025472/1) and Heart Research UK (TRP16/19). All other authors have reported that they have no relationships relevant to the contents of this paper to disclose.

Figures

None
Graphical abstract
Figure 1
Figure 1
Sac/Val Improves Cardiac Function in HFpEF, But Does Not Attenuate Skeletal Muscle Pathology (A) Schematic of pharmacological treatment in heart failure with preserved ejection fraction (HFpEF) vs control (CON) rats. (B) Ventricular mass after removing atria (CON n = 8, HFpEF+ vehicle [Veh] n = 7, HFpEF+ sacubitril/valsartan [Sac/Val 68 mg/kg body mass/d via gavage] n = 6). (C) Early (E-wave) and late (A-wave) ventricular filling velocities (CON n = 7, HFpEF+Veh n = 7, HFpEF+Sac/Val n = 5), (D) left ventricular ejection fraction (LVEF) (CON n = 7, HFpEF+Veh n = 7, HFpEF+Sac/Val n = 6) (E) Stroke volume (CON n = 8, HFpEF+Veh n = 6, HFpEF+Sac/Val n = 6) and (G) cardiac output (CON n = 6, HFpEF+Veh n = 7, HFpEF+Sac/Val n = 6) assed by noninvasive echocardiography or (F-H) invasive catheterization (CON n = 5, HFpEF+Veh n = 4, HFpEF+Sac/Val n = 4). Metabolic features including (I) body mass (CON n = 11, HFpEF+Veh n = 8, HFpEF+Sac/Val n = 6), (J) blood glucose (CON n = 8, HFpEF+Veh n = 7, HFpEF+Sac/Val n = 6), and (K) mean arterial blood pressure (each group n = 4). (L) Soleus, (M) tibialis anterior (TA), and (N) extensor digitorum longus (EDL) muscles (CON n = 11, HFpEF+Veh n = 8, HFpEF+Sac/Val n = 6) were blotted on paper tissue, and wet mass was recorded. (O) Representative images of extensor digitorum longus (EDL) cryosections stained for Type I (red), Type IIa (green), and Type IIb/IIx (unstained/black) fibers and capillaries (bright green). Histological features of the EDL muscle including (P) total (ie, average) and fiber-type-specific cross-sectional area (FCSA), (Q) numerical proportion, and (R) global capillary-to-fiber ratio (C:F) (CON n = 9, HFpEF+Veh n = 5, HFpEF+Sac/Val n = 6). Between-group differences were assessed by 1-way analysis of variance followed by Bonferroni post hoc test. Data are presented as mean ± SD, and the level of significance was accepted as ∗P < 0.05; ∗∗P < 0.01; and ∗∗∗P < 0.001 for all analyses.
Figure 2
Figure 2
Skeletal Muscle Growth Following Mechanical Overload Is Absent in HFpEF (A) Unilateral synergistic surgical ablation of the tibialis anterior (TA) was performed to induce myofiber hypertrophy in the extensor digitorum longus (EDL) in HFpEF and control (CON) rats. (B) Representative images of nonoverload, contralateral (CL) and overload (OL) EDL muscles stained for Type I (red), Type IIa (green), and Type IIb/IIx (unstained/black) fibers and capillaries (bright green). (C) Total EDL FCSA and (D) fiber type distribution of CL (CON n = 8, HFpEF n = 8) and OL (CON n = 7, HFpEF n = 8). Absolute (E) twitch and (F) maximal forces (CL muscles: CON n = 8 and HFpEF n = 8; OL muscles: CON n = 7 and HFpEF n = 6). (G) Capillary-to-fiber ratio (C:F), (H) capillary density (CD) (CL muscles: CON n = 8 and HFpEF n = 8; OL muscles: CON n = 7 and HFpEF n = 8), and (I and J) muscle oxygen tension at maximal rate of oxygen consumption (CL muscles: CON n = 8 and HFpEF n = 8; OL muscles: CON n = 5 and HFpEF n = 7). In situ femoral artery blood flow at (K) rest and (L) during muscle stimulation (CL muscles: CON n = 6 and HFpEF n = 5; OL muscles: CON n = 6 and HFpEF n = 7). (M) In situ mitochondrial respiratory states of permeabilized EDL fibers presented as fold change relative to baseline CL muscle (each group n = 4). (N) Respiratory control ratio (RCR) (each group n = 4). Protein contents of (O) OPA1, PGC-1α, Drp1, (P) ACC, and ACL (each group n = 4). Differences were assessed by 2-way analysis of variance followed by Bonferroni post hoc test. Data are presented as mean ± SD, and the level of significance was accepted as ∗P < 0.05; ∗∗P < 0.01; and ∗∗∗P < 0.001 for all analyses. CIV = complex IV activity; EI+II = uncoupled respiration in the presence of complex I+II substrates; EII = uncoupled respiration in the presence of complex II substrates; LI = leak respiration with complex I substrates; PI = oxidative phosphorylation with complex I substrates; PI+II = oxidative phosphorylation with complex I+II substrates; other abbreviations as in Figure 1.
Figure 3
Figure 3
Acute Dietary Restriction Restores Myofiber Growth Following Mechanical Overload in HFpEF (A) Experimental design schematic showing start and endpoints of caloric restriction (CR) and mechanical overload of the EDL. (B) Representative images of contralateral (CL) and overloaded (OL) EDL muscles stained for Type I (red), Type IIa (green), and Type IIb/IIx (unstained/black) fibers and capillaries (bright green). (C) Total FCSA, (D) Type I FCSA, (E) Type II FCSA, (F) Type IIb/IIx FCSA, and (G) fiber type distribution of CL (CON n = 4, HFpEF n = 4, HFpEF+CR n = 4) and OL (CON n = 4, HFpEF n = 4, HFpEF+CR n = 4) EDL muscles. (H) Soleus contractile power measured across various percentages of maximal force (CON n = 4, HFpEF n = 4, HFpEF+CR n = 4). (I) EDL protein expression of puromycin, 4E-BP1, p-4E-BP1, S6, p-S6, AMPK, p-AMPK, and p62 in OL and CL muscles (CON n = 4, HFpEF n = 4, HFpEF+CR n = 4) and (J) gene expression for IGF1 (CON n = 4, HFpEF n = 4, HFpEF+CR n = 4). (K) Protein contents of 4E-BP1, p-4E-BP1, S6, p-S6, AMPK, and p-AMPK in stimulated (ST) and nonstimulated (NST) soleus. Gene expression of (L) MuRF1, (M) MAFbx, and (N) myostatin in CL and OL EDL muscles (CON n = 4, HFpEF n = 4, HFpEF+CR n = 4). Differences were assessed by 2-way analysis of variance followed by Bonferroni post hoc test. Data are presented as mean ± SD, and the level of significance was accepted as ∗P < 0.05; ∗∗P < 0.01; and ∗∗∗P < 0.001 for all analyses. Abbreviations as in Figure 1.
Figure 4
Figure 4
Caloric Restriction Increases Myonuclear Accretion in HFpEF Following Mechanical Overload Alongside Changes in the Myogenic Transcriptome Differentially expressed genes (DEGs) based on adjusted P value <0.05 in EDL muscles (contralateral [CL] vs overloaded [OL]) from (A) control (CON) (n = 4), (B) HFpEF (n = 4), and (C) HFpEF+CR (n = 4) rats. (D) Common KEGG pathway signature between control rats (n = 4) and HFpEF+CR (n = 4) vs HFpEF (n = 4). Gene expression of (E) PTCH, (F) Gli2, (G) apelin, (H) APLNR, (I) PAX7, (J) Myf5, (K) MyoD, (L) myogenin, and (M) myomaker in CL and OL muscles (CON n = 4, HFpEF n = 4, HFpEF+CR n = 4). (N) Representative images of CL and OL EDL muscles stained for nuclei (blue). (O) Number of myonuclei per fiber were determined (CON n = 4, HFpEF n = 4, HFpEF+CR n = 3). REACTOME pathway analysis showed clear differences in down-regulated pathways (especially the proportion of terms related to cell cycle regulation relative to the total number) between (P) CON (n = 4) vs (Q) HFpEF (n = 4), but not CON vs (R) HFpEF+CR (n = 4). The adjusted P value was corrected using the Benjamini and Hochberg method. Differences were assessed by 2-way analysis of variance followed by Bonferroni post hoc test. Data are presented as mean ± SD, and the level of significance was accepted as ∗P < 0.05; ∗∗P < 0.01; and ∗∗∗P < 0.001 for all analyses. Abbreviations as in Figure 1.
Figure 5
Figure 5
Basal Myogenic Expression Is Dysregulated in Rats and Patients With HFpEF Skeletal muscle gene expression of PAX7, Myf5, MyoD, myogenin, myomaker, apelin, APLNR, Gli2, PTCH, piezo1, and IGF1 measures in (A) rat EDL (CON n = 4, HFpEF n = 4) and (B) vastus lateralis biopsies from healthy age-matched control subjects (CON n = 10) and patients with diagnosed HFpEF (n = 10) measuring protein expression of Pax7 and MyoD normalized to loading control (GAPDH) with representative blots presented. Differences between groups were analyzed by unpaired 2-tailed Student t-tests. Data are presented as mean ± SD, and the level of significance was accepted as ∗P < 0.05, ∗∗ P< 0.01, ∗∗∗P < 0.001 for all analyses. Abbreviations as in Figures 1 and 2.

References

    1. Dunlay S.M., Roger V.L., Redfield M.M. Epidemiology of heart failure with preserved ejection fraction. Nat Rev Cardiol. 2017;14:591–602. - PubMed
    1. Gevaert A.B., Kataria R., Zannad F., et al. Heart failure with preserved ejection fraction: recent concepts in diagnosis, mechanisms and management. Heart. 2022;108:1342–1350. - PubMed
    1. Pandey A., Shah S.J., Butler J., et al. Exercise intolerance in older adults with heart failure with preserved ejection fraction: JACC state-of-the-art review. J Am Coll Cardiol. 2021;78:1166–1187. - PMC - PubMed
    1. Sharma K., Kass D.A. Heart failure with preserved ejection fraction: mechanisms, clinical features, and therapies. Circ Res. 2014;115:79–96. - PMC - PubMed
    1. Kitzman D.W., Brubaker P., Morgan T., et al. Effect of caloric restriction or aerobic exercise training on peak oxygen consumption and quality of life in obese older patients with heart failure with preserved ejection fraction: a randomized clinical trial. JAMA. 2016;315:36–46. - PMC - PubMed

LinkOut - more resources