. 2024 Mar 6;10(1):veae018.
doi: 10.1093/ve/veae018. eCollection 2024.

VIPERA: Viral Intra-Patient Evolution Reporting and Analysis

Affiliations

VIPERA: Viral Intra-Patient Evolution Reporting and Analysis

Miguel Álvarez-Herrera et al. Virus Evol. .

Abstract

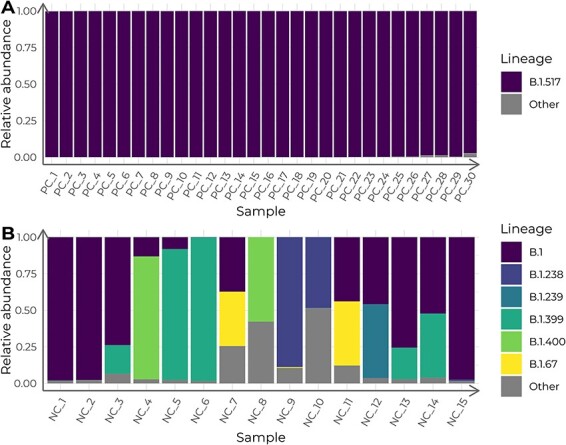
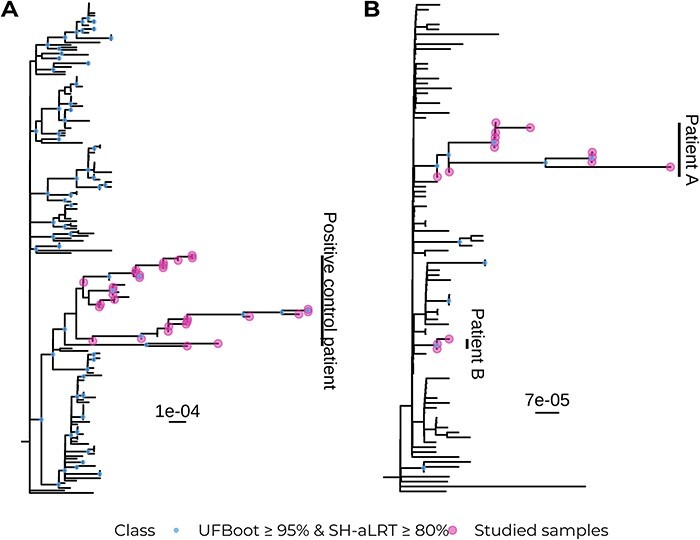
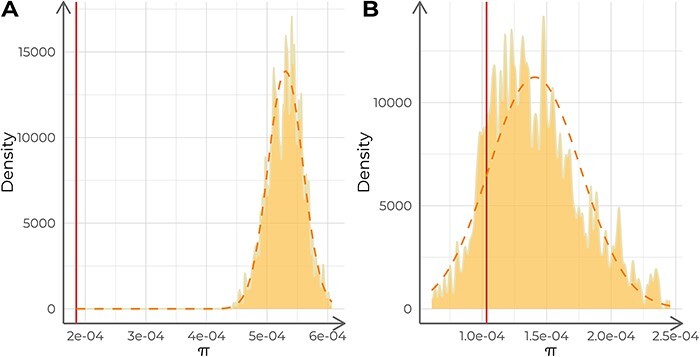
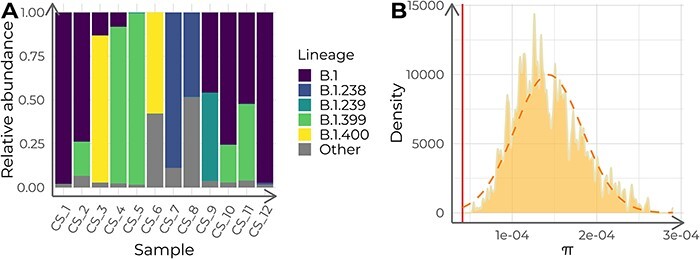
Viral mutations within patients nurture the adaptive potential of severe acute respiratory syndrome coronavirus 2 (SARS-CoV-2) during chronic infections, which are a potential source of variants of concern. However, there is no integrated framework for the evolutionary analysis of intra-patient SARS-CoV-2 serial samples. Herein, we describe Viral Intra-Patient Evolution Reporting and Analysis (VIPERA), a new software that integrates the evaluation of the intra-patient ancestry of SARS-CoV-2 sequences with the analysis of evolutionary trajectories of serial sequences from the same viral infection. We have validated it using positive and negative control datasets and have successfully applied it to a new case, which revealed population dynamics and evidence of adaptive evolution. VIPERA is available under a free software license at https://github.com/PathoGenOmics-Lab/VIPERA.

Keywords: SARS-CoV-2; bioinformatics; intra-patient diversity; serially sampled infection; snakemake workflow; within-host evolution.


Conflict of interest statement

The authors declare that they have no competing interests.

Figures

Figure 1.
Figure 1.
Lineage admixture of the control datasets, calculated with Freyja. Columns depict the estimated relative lineage abundance in each sample in (A) the positive control (PC) dataset and in (B) the negative control (NC) dataset. Samples in the x-axis are ordered chronologically, from more ancient to newer.
Figure 2.
Figure 2.
Maximum-likelihood phylogenies of the control datasets and their context samples with 1000 support replicates. (A) Positive control dataset. (B) Negative control dataset.
Figure 3.
Figure 3.
Analysis of the nucleotide diversity (π) of each control dataset. The dashed lines describe a normal distribution with the same mean and standard deviation as the distribution of π-values. The solid vertical lines indicate the π-value for the target samples. (A) Analysis of the positive control against 1,000 replicates (n = 15 each) of its context dataset. (B) Analysis of the negative control against 1,000 replicates (n = 30 each) of its context dataset.
Figure 4.
Figure 4.
Lineage admixture and nucleotide diversity (π) analysis of the twelve case study samples. (A) Estimated relative lineage abundance in each of the twelve target samples from the case study, calculated with Freyja. Samples in the x-axis are ordered chronologically, from more ancient to newer. (B) Nucleotide diversity (π) distribution for 1,000 samples (n = 12) of context sequences for the case study. The orange dashed curve depicts a normal distribution with the same mean and standard deviation as the π-value distribution. The red vertical line indicates the π of the case study dataset.
Figure 5.
Figure 5.
Phylogenetic analysis of the case study dataset. (A) Maximum-likelihood phylogeny with 1,000 supporting replicates for both target samples and samples composing the case study context dataset. (B) Zoom of the clade containing all target samples in (A).
Figure 6.
Figure 6.
Summary of the intra-host accumulation of nucleotide variants (NV), using the dataset ancestor as reference. (A) Nucleotide variants per site along the SARS-CoV-2 genome. Relative abundance of NVs is calculated with a sliding window of width 1,000 nucleotides and a step of fifty. Labels indicate the coding regions of the non-structural proteins (NSP) within ORF1ab. (B) Genome variation along the genome for each sample. The y-axis displays samples in chronological order, with the earliest collection date at the bottom and the latest at the top.
Figure 7.
Figure 7.
Analysis of the frequency of polymorphisms with time in the case study. (A) Pearson’s correlation coefficients and adjusted P-values for all 110 detected nucleotide variants. Dashed line indicates adjusted P = 0.05. Labeled dots represent nucleotide variants correlated with time (adjusted P < 0.05). B) Time series of relative allele frequencies. The shown positions include nucleotide variants with a significant correlation with time and sites with more than two possible states. Each subplot depicts the progression of the allele frequencies in time for a given genome position. The vertical stripes in orange indicate the span of the remdesivir clinical trial. The vertical stripes in purple indicate the days of administration of hyperimmune plasma.
Figure 8.
Figure 8.
Heatmap of the association between polymorphism trajectories in the case study. (A) Hierarchically clustered heatmap of the pairwise Pearson’s correlation coefficients between the time series of allele frequencies in the case study. The cluster containing the previously found mutations is squared in black. (B) Subset of the correlation heatmap, restricted to the cluster marked in (A).
Figure 9.
Figure 9.
Non-synonymous (dN), synonymous (dS) substitution rates, and ω (dN/dS) for this study samples (A) and the positive control dataset (B). Each point corresponds to a different sample calculated with respect to the ancestor and sorted in chronological order. Vertical lines in the x-axis indicate the administered treatments and their duration: Remdesivir (RDV), hyperimmune plasma (HP), and palliative radiation (PR).

References

    1. Ameen F. et al. (2021) ‘Rilpivirine Inhibits SARS-CoV-2 Protein Targets: A Potential Multi-target Drug’, Journal of Infection and Public Health, Special Issue on COVID-19 – Vaccine, Variants and New Waves 14: 1454–60. - PMC - PubMed
    1. Andersen Laboratory . (2023) Freyja: Depth-weighted De-Mixing. <https://github.com/andersen-lab/Freyja> accessed 16 Jun 2023.
    1. ARTICnetwork . (2023) ARTIC-ncov2019: ARTIC Nanopore Protocol for nCoV2019 Novel Coronavirus. <https://github.com/artic-network/artic-ncov2019> accessed 7 Jun 2023.
    1. Benjamini Y., and Hochberg Y. (1995) ‘Controlling the False Discovery Rate: A Practical and Powerful Approach to Multiple Testing’, Journal of the Royal Statistical Society: Series B (Methodological), 57: 289–300.
    1. Brandolini M. et al. (2022) ‘Mutational Induction in SARS-CoV-2 Major Lineages by Experimental Exposure to Neutralising Sera’, Scientific Reports, 12: 12479. - PMC - PubMed