. 2024 Mar 6:14:1352202.
doi: 10.3389/fcimb.2024.1352202. eCollection 2024.

Signatures of disease outcome severity in the intestinal fungal and bacterial microbiome of COVID-19 patients

Affiliations

Signatures of disease outcome severity in the intestinal fungal and bacterial microbiome of COVID-19 patients

Fernando Rizzello et al. Front Cell Infect Microbiol. .

Abstract

Background: COVID-19, whose causative pathogen is the Severe Acute Respiratory Syndrome Coronavirus-2 (SARS-CoV-2), was declared a pandemic in March 2020. The gastrointestinal tract is one of the targets of this virus, and mounting evidence suggests that gastrointestinal symptoms may contribute to disease severity. The gut-lung axis is involved in the immune response to SARS-CoV-2; therefore, we investigated whether COVID-19 patients' bacterial and fungal gut microbiome composition was linked to disease clinical outcome.

Methods: In May 2020, we collected stool samples and patient records from 24 hospitalized patients with laboratory-confirmed SARS-CoV-2 infection. Fungal and bacterial gut microbiome was characterized by amplicon sequencing on the MiSeq, Illumina's integrated next generation sequencing instrument. A cohort of 201 age- and sex-matched healthy volunteers from the project PRJNA661289 was used as a control group for the bacterial gut microbiota analysis.

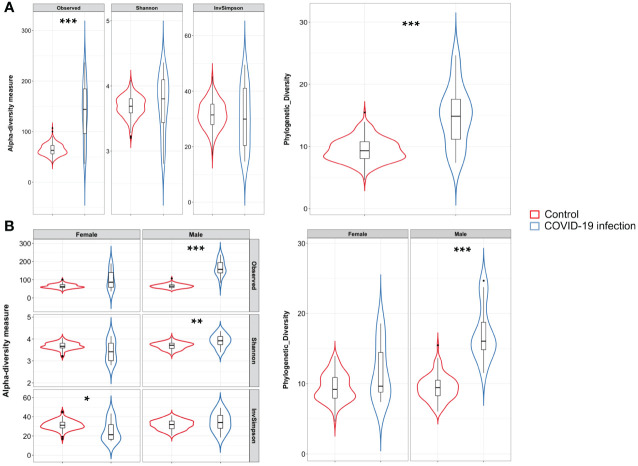
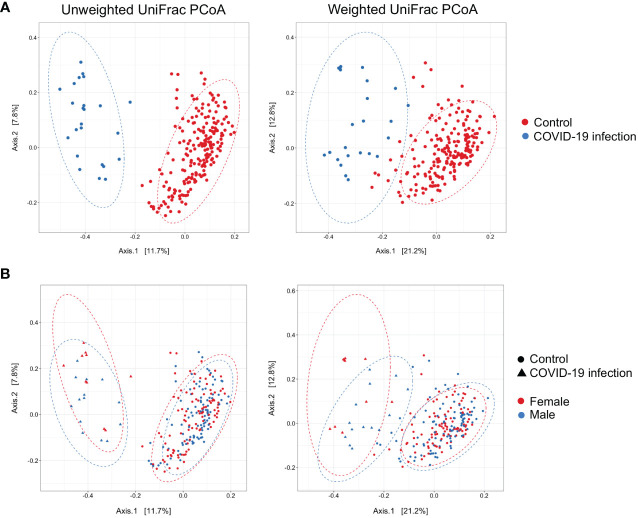
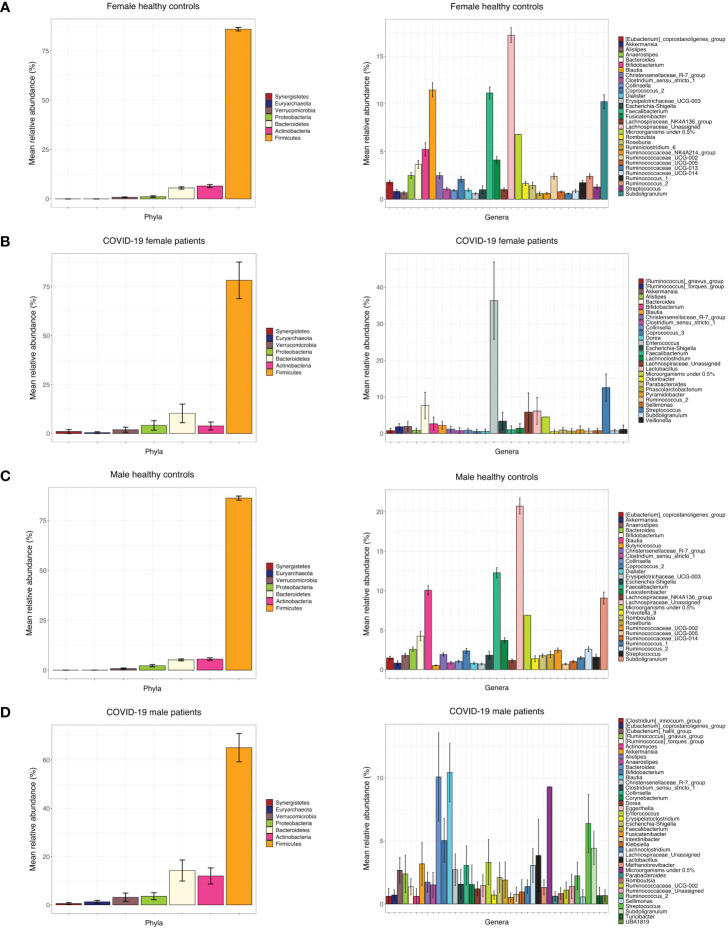
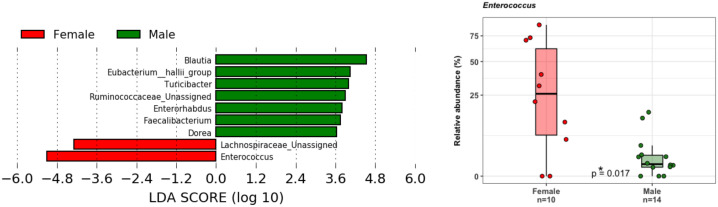
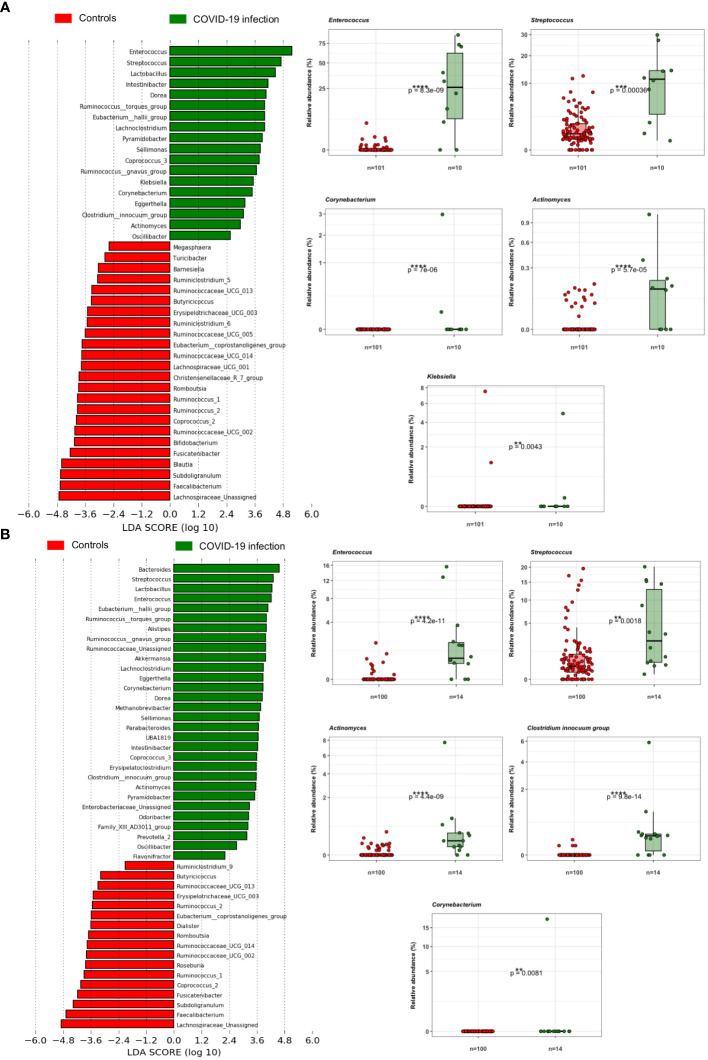
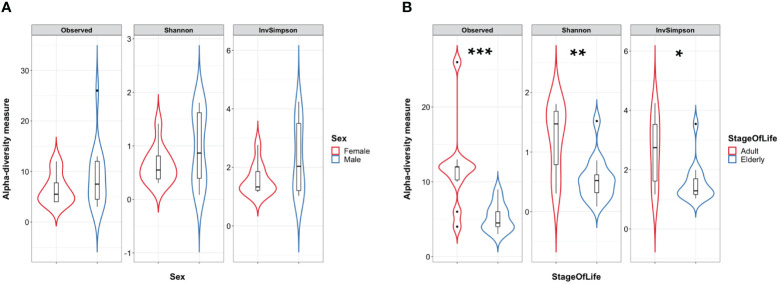
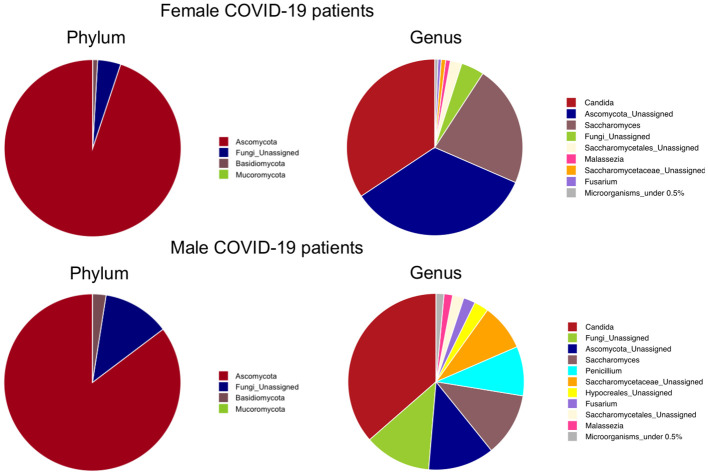
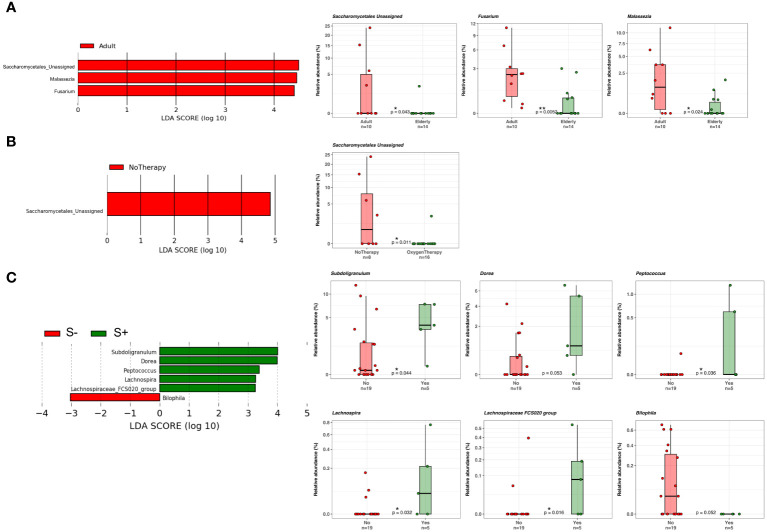
Results: We observed that female COVID-19 patients had a lower gut bacterial microbiota richness than male patients, which was consistent with a different latency in hospital admittance time between the two groups. Both sexes in the COVID-19 patient study group displayed multiple positive associations with opportunistic bacterial pathogens such as Enterococcus, Streptococcus, and Actinomyces. Of note, the Candida genus dominated the gut mycobiota of COVID-19 patients, and adult patients showed a higher intestinal fungal diversity than elderly patients. We found that Saccharomycetales unassigned fungal genera were positively associated with bacterial short-chain fatty acid (SCFA) producers and negatively associated with the proinflammatory genus Bilophila in COVID-19 patients, and we observed that none of the patients who harbored it were admitted to the high-intensity unit.

Conclusions: COVID-19 was associated with opportunistic bacterial pathogens, and Candida was the dominant fungal taxon in the intestine. Together, we found an association between commensal SCFA-producers and a fungal genus that was present in the intestines of patients who did not experience the most severe outcome of the disease. We believe that this taxon could have played a role in the disease outcome, and that further studies should be conducted to understand the role of fungi in gastrointestinal and health protection.

Keywords: COVID-19; SARS-CoV-2; SCFA (short chain fatty acid); human microbiota; microbiome; mycobiota; pathogenesis.


Conflict of interest statement

Authors EV, BS, AP, AV, AM, and AC were employed by the company Wellmicro srl. The remaining authors declare that the research was conducted in the absence of any commercial or financial relationships that could be construed as a potential conflict of interest.

Figures

Figure 1
Figure 1
(A) Violin plots with box-and-whisker plot showing the comparison of alpha diversity measures between COVID-19 patients (n = 24, in blue) and controls (n = 24, in red). Observed Species p-value = 1.2 × 10⁻⁸; Phylogenetic Diversity Whole Tree p-value = 4.8 × 10⁻⁸, Wilcoxon–Mann–Whitney with Holm–Bonferroni (WMW with HB). Median, first, third quartile and outliers are shown. (B) Violin plots with box-and-whisker plot showing the comparison of alpha diversity measures between male COVID-19 patients (n = 14, in blue) and male controls (n = 100, in red), and female COVID-19 patients (n = 10, in blue) and female controls (n = 201, in red). Observed Species p-value = 2.3 × 10⁻⁹; Shannon–Wiener index p-value = 0.003; Phylogenetic Diversity Whole Tree p-value = 3.4 × 10⁻⁹; Inverse Simpson’s p-value = 0.039, WMW with HB. Median, first, third quartile and outliers are shown. Observed, Observed species index; Shannon, Shannon–Weiner index; InvSimpson, Inverse Simpson’s index. * = FDR-corrected p-value < 0.05; ** = FDR-corrected p-value < 0.01; *** = FDR-corrected p-value < 0.001.
Figure 2
Figure 2
(A) Principal Coordinate Analysis (PCoA) on unweighted and weighted UniFrac distance metric calculated on COVID-19 patients (n = 24, blue dots) and healthy controls (n = 201, red dots). Each sample is represented by a dot. Axis 1 explained 11.7% and 21.2% of the variation observed, while Axis 2 explained 7.8% and 12.8% of the variation, in the left and right graph, respectively; PERMANOVA on weighted and unweighted UniFrac Pr(> F) = 0.001, beta-dispersion = 0.001. (B) Addition of the sex distinction layer to the same graphical display; PERMANOVA on weighted UniFrac Pr(> F) = 0.012, beta-dispersion = n.s.
Figure 3
Figure 3
(A) Bar chart of mean RA% of bacterial phyla and genera in female control subjects. (B) Bar chart of mean RA% of bacterial phyla and genera in female COVID-19 patients. (C) Bar chart of mean RA% of bacterial genera and phyla in male control subjects. (D) Bar chart of mean RA% of bacterial genera and phyla in male COVID-19 subjects.
Figure 4
Figure 4
LDA LEfSe barplot displaying the different associations of bacterial genera between female (red) and male patients (green) (LDA score >2.0). Box-and-whisker plots with data points show the relative abundances of Enterococcus genus in the two groups. Median, first, third quartile are shown. Mann–Whitney U Test result of the group comparison is shown.
Figure 5
Figure 5
(A) LDA LEfSe barplot showing the different associations of gut bacteria between female patients and female controls (LDA score >2.0). Box-and-whisker plots with data points show the relative abundances of each potential opportunistic pathogen positively associated with the female patients. Mann–Whitney U Test results of the group comparisons are shown. (B) LDA LEfSe barplot showing the different associations of bacteria between male patients and male controls (LDA score >2.0). Box-and-whisker plots with data points show the relative abundances of each potential opportunistic pathogen positively associated with the male patients. Median, first, and third quartiles are shown in the box-and-whisker plots. Mann–Whitney U Test results of the group comparisons are shown.
Figure 6
Figure 6
(A) Violin plots with box-and-whisker plot showing the comparison of fungal alpha diversity measures between COVID-19 female patients (n = 10, in red) and male patients (n = 14, in blue). (B) Violin plots with box-and-whisker plot showing the comparison of fungal alpha diversity measures between COVID-19 adult patients (n = 10, in red) and elderly patients (n = 14, in blue). Observed p-value = 0.001; Shannon p-value = 0.006; InvSimpson p-value = 0.013. Median, first, third quartile and outliers are shown. Observed, Observed species index; Shannon, Shannon–Wiener index; InvSimpson, Inverse Simpson’s index. * = FDR-corrected p-value < 0.05; ** = FDR-corrected p-value < 0.01; *** = FDR-corrected p-value < 0.001.
Figure 7
Figure 7
Phylum-level and genus-level mean relative abundance percentage pies of female and male COVID-19 patients’ fungal taxa.
Figure 8
Figure 8
(A) LDA LEfSe barplot showing the different associations of fungi between adults (n = 10) and elderly patients (n = 14) (LDA score >2.0). (B) LDA LEfSe barplot showing the different associations of fungi between patients who did (n = 8) or did not (n = 16) undergo oxygen therapy (LDA score >2.0). (C) LDA LEfSe barplot showing the different associations of fungi between S+ (Saccharomycetales unassigned positive, n = 5) or S− patients (n = 19) (LDA score >2.0). On the right, from the top to the bottom of the figure, boxplots with data points show the relative abundances of each taxon displayed on the LDA LEfSe graphs on the left. Median, first, and third quartiles are shown in the box-and-whisker plots. Mann–Whitney U Test results of the group comparisons are shown.

References

    1. Atzrodt C. L., Maknojia I., McCarthy R. D. P., Oldfield T. M., Po J., Ta K. T. L., et al. . (2020). A Guide to COVID-19: a global pandemic caused by the novel coronavirus SARS-CoV-2. FEBS J. 287, 3633. doi: 10.1111/febs.15375 - DOI - PMC - PubMed
    1. Bolyen E., Rideout J. R., Dillon M. R., Bokulich N. A., Abnet C. C., Al-Ghalith G. A., et al. . (2019). Reproducible, interactive, scalable and extensible microbiome data science using QIIME 2. Nat. Biotechnol. 37, 852–857. doi: 10.1038/s41587-019-0209-9 - DOI - PMC - PubMed
    1. Callahan B. J., McMurdie P. J., Rosen M. J., Han A. W., Johnson A. J. A., Holmes S. P. (2016. a). DADA2: High-resolution sample inference from Illumina amplicon data. Nat. Methods 13, 581–583. doi: 10.1038/nmeth.3869 - DOI - PMC - PubMed
    1. Callahan B. J., Sankaran K., Fukuyama J. A., McMurdie P. J., Holmes S. P. (2016. b). Bioconductor workflow for microbiome data analysis: from raw reads to community analyses. F1000Res 5, 1492. doi: 10.12688/f1000research.8986.1 - DOI - PMC - PubMed
    1. Chia J.-H., Feng Y., Su L.-H., Wu T.-L., Chen C.-L., Liang Y.-H., et al. . (2017). Clostridium innocuum is a significant vancomycin-resistant pathogen for extraintestinal clostridial infection. Clin. Microbiol. Infection 23, 560–566. doi: 10.1016/j.cmi.2017.02.025 - DOI - PubMed