

The temporal expression pattern of classical MHC class I in sleep-restricted mice: Generalizations and broader implications
- PMID: 38511151
- PMCID: PMC10951454
- DOI: 10.1016/j.bbih.2024.100751
The temporal expression pattern of classical MHC class I in sleep-restricted mice: Generalizations and broader implications
Abstract
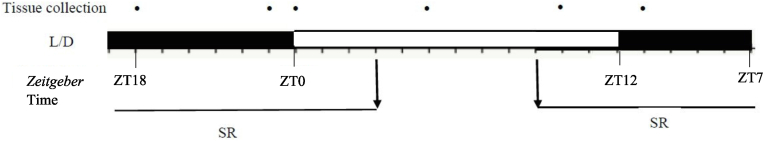
The intricate relationship between sleep and leukocyte trafficking has garnered intense attention, particularly their homing dynamics to secondary lymphoid organs under normal and restricted sleep (SR). Considering the scarcity of information regarding circadian rhythms in major histocompatibility class I (MHC-I) expression in SR, we designed a study that assessed the temporal expression of MHC-I in murine lymph nodes and spleen and the subsequent effects of sleep recovery. Male C57BL/6, housed in 12:12 light/dark cycle, were grouped into control (C) and SR. SR was carried for one week before lymphoid tissues were sampled at selected time points and assessed for leukocyte number and MHC-I expression. SR resulted in 21% decrease in granulocyte and 24% increase in agranulocyte numbers. In C, MHC-I expression pattern in lymph nodes was bimodal and relatively higher than splenocytes during the animal's active phase (110.2 ± 1.8 vs 81.9 ± 3.8, respectively; p = 0.002). Splenocytes; however, showed a bimodal pattern upon SR, with higher protein levels during the rest than the activity period (154.6 + 36.2 vs 99.5 + 15.9, respectively; p = 0.002), suggesting preparedness for a potential infection. Furthermore, SR caused a significant drop in MHC-I expression at the onset of rest with 57% and 30% reduction in lymph nodes and splenocytes, respectively. However, the overall protein expression collectively taken from both lymphoid tissues remained stable, emphasizing its indispensable role in immunological homeostasis. This stability coincided with the restoration of protein levels to baseline after a short sleep recovery period, resembling a reset for MHC-I antigen presentation following a week of SR. Understanding the interplay between MHC-I expression and contextual factors could enhance treatment protocols, refining the efficacy and time precision of glucocorticoid-based therapies in immune modulation.
Keywords: C57BL/6 mice; Circadian rhythms; Leukocytes; Major histocompatibility complex class I; Sleep restriction.
© 2024 Published by Elsevier Inc.
Conflict of interest statement
Declarations of interest: none.
Figures


Similar articles
-
Sleep restriction alters the temporal expression of major histocompatibility complex class II molecules in murine lymphoid tissues.Behav Brain Res. 2019 Apr 19;362:152-159. doi: 10.1016/j.bbr.2019.01.019. Epub 2019 Jan 11. Behav Brain Res. 2019. PMID: 30641160
-
Generation of DC from mouse spleen cell cultures in response to GM-CSF: immunophenotypic and functional analyses.Immunology. 1995 Jan;84(1):127-34. Immunology. 1995. PMID: 7890296 Free PMC article.
-
In vivo treatment with interferon-gamma during early pregnancy in mice induces strong expression of major histocompatibility complex class I and II molecules in uterus and decidua but not in extra-embryonic tissues.Biol Reprod. 1992 Jun;46(6):1176-86. doi: 10.1095/biolreprod46.6.1176. Biol Reprod. 1992. PMID: 1391316
-
Antigen presentation pathways to class I and class II MHC-restricted T lymphocytes.Immunol Rev. 1987 Aug;98:95-114. doi: 10.1111/j.1600-065x.1987.tb00521.x. Immunol Rev. 1987. PMID: 2443444 Review.
-
Role of autophagy in MHC class I-restricted antigen presentation.Mol Immunol. 2019 Sep;113:2-5. doi: 10.1016/j.molimm.2017.10.021. Epub 2017 Nov 8. Mol Immunol. 2019. PMID: 29126597 Free PMC article. Review.
References
-
- Akerstedt T. Work hours, sleepiness and the underlying mechanisms. J. Sleep Res. 1995;4(S2):15–22. - PubMed
-
- Antonini S.R., Jorge S.M., Moreira A.C. The emergence of salivary cortisol circadian rhythm and its relationship to sleep activity in preterm infants. Clin. Endocrinol. 2000;52(4):423–426. - PubMed
LinkOut - more resources
Full Text Sources
Research Materials
