. 2024 Sep 1;109(9):2930-2943.
doi: 10.3324/haematol.2023.283771.

Steroid-free combination of 5-azacytidine and venetoclax for the treatment of multiple myeloma

Affiliations

Steroid-free combination of 5-azacytidine and venetoclax for the treatment of multiple myeloma

Lyndsey Flanagan et al. Haematologica. .

Abstract

Multiple myeloma (MM) is an incurable plasma cell malignancy that, despite an unprecedented increase in overall survival, lacks truly risk-adapted or targeted treatments. A proportion of patients with MM depend on BCL-2 for survival, and, recently, the BCL-2 antagonist venetoclax has shown clinical efficacy and safety in t(11;14) and BCL-2 overexpressing MM. However, only a small proportion of MM patients rely on BCL-2 (approx. 20%), and there is a need to broaden the patient population outside of t(11;14) that can be treated with venetoclax. Therefore, we took an unbiased screening approach and screened epigenetic modifiers to enhance venetoclax sensitivity in 2 non-BCL-2 dependent MM cell lines. The demethylase inhibitor 5-azacytidine was one of the lead hits from the screen, and the enhanced cell killing of the combination was confirmed in additional MM cell lines. Using dynamic BH3 profiling and immunoprecipitations, we identified the potential mechanism of synergy is due to increased NOXA expression, through the integrated stress response. Knockdown of PMAIP1 or PKR partially rescues cell death of the venetoclax and 5-azacytidine combination treatment. The addition of a steroid to the combination treatment did not enhance the cell death, and, interestingly, we found enhanced death of the immune cells with steroid addition, suggesting that a steroid-sparing regimen may be more beneficial in MM. Lastly, we show for the first time in primary MM patient samples that 5-azacytidine enhances the response to venetoclax ex vivo across diverse anti-apoptotic dependencies (BCL-2 or MCL-1) and diverse cytogenetic backgrounds. Overall, our data identify 5-azacytidine and venetoclax as an effective treatment combination, which could be a tolerable steroid-sparing regimen, particularly for elderly MM patients.


Figures

Figure 1.
Figure 1.
Screening epigenetic modifiers in combination with venetoclax in multiple myeloma cell lines. Area under the curve (AUC) of the dose response to BH3 mimetics ABT-199, ABT-263, WEHI-539, and AMG-176 is plotted following 24-hour (hr) treatment as measured by Annexin V / propidium iodide (PI) staining. BH3 profiles of (A) JJN3 and (B) KMS18. Mitochondrial membrane potential was measured using JC-1 following exposure to BH3 peptides and BH3 mimetics over 180 minutes (min). Median ± Standard Error of Mean of 3 independent experiments is shown. (C) JJN3 and (D) KMS18 cells were treated for 24 hr with epigenetic (Epi) modifiers ± venetoclax (Ven). Cells were treated with 2 doses of epigenetic modifier alone, 100 nM and 500 nM, or in combination with 1 μM Ven JJN3 cells or 500 nM Ven in KMS18 cells for 24 hr. Cell viability was assessed following treatment using Cell Titer Glo® and data were graphed using GraphPad prism. The 12 epigenetic modifier hits from (F) JJN3 and (G) KMS18 were assessed for cell death by Annexin V / PI staining. Cells were treated with 30 nM, 100 nM, 300 nM, 1 μM and 3 μM of each epigenetic modifier alone, and 1 μM Ven in JJN3 cells and 500 nM Ven in KMS18 cells for 24 hr. The dose-response curves were graphed in Graphpad. Ratio of AUC values, as shown in (E), were calculated and graphed for each drug in combination with Ven.
Figure 2.
Figure 2.
Assessing the effect of bone marrow stroma cells on the combination of 5-azacytidine and venetoclax in multiple myeloma cell lines. (A) Cell viability was assessed in JJN3 cells using Annexin V / propidium iodide (PI) staining following 24-hour (hr) treatment with dose response of venetoclax (Ven) ± 5-azacytidine (5-Aza) 3 μM. (B) Live cell confocal imaging of JJN3 cells following treatment with DMSO, 3 μM 5-Aza ± 1 μM Ven for 24 hr. Mitochondria were stained with PKMO and DNA stained with Picogreen; 5 images were taken per treatment condition, with images representative of 3 independent experiments. (C) The combination treatment was assessed in a panel of multiple myeloma (MM) cell lines by measuring Annexin V / PI positivity by flow cytometry following 24 hr of treatment. Sensitivity was expressed as IC50 μM for Ven alone or Ven + 5-Aza as determined by GraphPad. (D) Workflow of the co-culture experiments. HS-5 cells or MM bone marrow stromal cells (BMSC) from an MM patient sample were seeded for 24 hr. MM cells were co-cultured for 24 hr. and then treated with drugs for 24 hr before assessment by flow cytometry. (E) JJN3 cells were seeded alone (orange) or co-cultured with HS-5 cells for 24 hr (maroon). Cells were then treated with either 5-Aza (1 μM or 3 μM) alone or combined with 1 μM Ven (shown by the plus symbol) for 24 hrs. % cell death of tumor cells was assessed by Annexin V / PI staining on the flow cytometer. (F) The same experiment was carried out for the MM1S cells, seeded alone (purple) or co-cultured with HS-5 (maroon) for 24 hr before treatment. Cells were then treated with either 5-Aza (1 μM or 3 μM) alone or combined with 1 μM Ven (shown by the plus symbol) for 24 hr. (G) The same experiment as described for (E) was carried out with JJN3 cells co-cultured with MM-BMSC cells. Median ± Standard Error of Mean from 3 independent experiments is shown. Two-way ANOVA with Bonferroni multiple comparison test was used to calculate P values. ns: not significant; *P≤0.05, **P≤0.01, ***P≤0.001.
Figure 3.
Figure 3.
5-azacytidine increases NOXA expression through the integrated stress response antagonizing MCL-1. (A) The effect of 5-azacytidine (5-Aza) 3 μM treatment on JJN3 cells after 24 hours (hr) was assessed by dynamic BH3 profiling (see Methods section). (B) JJN3 cells were treated with 5-Aza 3 [xM for 24 hr. The association of NOXA and BIM with MCL-1 was determined by immunoprecipitation and western blot analysis. (C) JJN3 cells were treated with 3 μM 5-Aza; venetoclax (Ven) 1 [xM; (3 μM 5-Aza + Ven1 μM); (3 μM 5-Aza + Ven1 μM + 500 nM ISRIB) for 24 hr and the expression of BCL-2, MCL-1, NOXA, DNMT1 and β-actin were determined by western blot analysis. (D) Cells were treated as in (C) for 6 hr and expression of p-eIF2α, total eIF2α, ATF4, and p-actin was measured by western blot. (E) Cell viability was assessed in JJN3 cells by Annexin V / propidium iodide (PI) staining following treatment with 3 μM 5-Aza; (3 μM 5-Aza + Ven1 μM); (3 μM 5-Aza + Ven1 μM + 500 nM ISRIB) for 24 hr. Mean of 3 independent experiments ± Standard Deviation is shown. **P≤0.01, ***P≤0.001, ****P≤0.0001
Figure 4.
Figure 4.
5-azacytidine increases dsRNA and knockdown of PKR protects against the combination treatment. (A) JJN3 cells were treated with 3 [xM 5-azacytidine (5-Aza), 1 [xM venetoclax (Ven) and (3 μM 5-Aza + 1 [xM Ven), for 24 hours (hr) before confocal imaging with DAPI stain for nucleus, MitoTrackerTM (deep red FM) for mitochondria and dsRNA for double-stranded RNA. Images are representative of 3 independent experiments. (B) Pixel count for dsRNA is graphed for the 3 independent experiments for the treatments described in (A). (C) Cell viability was assessed using Annexin V / propidium iodide (PI) staining by flow cytometry following control or siRNA to PKR with the following treatments 1 μM Ven; 3 μM 5-Aza; (3 μM 5-Aza + 1 μM Ven). Western blot shows the expression of PKR, with actin as a loading control. (D) Cell viability was assessed using Annexin V / PI staining by flow cytometry following control or siRNA to NOXA with the treatments listed in (D). Western blot shows the expression of NOXA, with actin as a loading control. (E) Induction of dsRNA activating PKR, knockdown of PKR, NOXA with siRNA or pre-treatment with ISRIB all inhibited the cell death induced by 5-Aza + Ven. *P≤0.05 **P≤0.01.
Figure 5.
Figure 5.
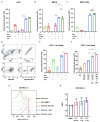
Dexamethasone does not enhance venetoclax + 5-azacytidine cell death and induces T-cell death. (A) JJN3 cells were treated with 1 μM venetoclax (Ven); 3 μM 5-azacytidine (5-Aza); 1 μM dexamethasone (Dex); (1 μM Ven + 1 μM Dex); (1 μM Ven + 3 μM 5-Aza); (1 [xM Ven + 3 [xM 5-Aza + 1 [xM Dex) for 24 hours (hr). Cell viability was measured using Annexin V/ propidium iodide (PI) staining. Mean of 3 independent repeats + Standard Deviation is shown. (B) MMIS cells were treated with 1 [xM Ven; 3 μM 5-Aza; 1 uM Dex; (1 μM Ven + 1 μM Dex); (1 μM Ven + 3 μM 5-Aza); (1 μM Ven + 3 μM 5-Aza + 1 μM Dex) for 24 hours (hr). Cell viability was assessed as in (A). (C) KMS12BM were treated with 0.5 μM Ven; 3 μM 5-Aza; 1 μM Dex; (0.5 μM Ven + 3 μM 5-Aza); (0.5 μM Ven + 3 μM 5-Aza + 1 [xM Dex) for 24 hr. Cell viability was assessed and graphed as in (A). (D) Gating strategy used for identifying CD3 T cells. (E) Cell viability was assessed in CD3+ T cells isolated from peripheral blood mononuclear cells using Annexin V / PI staining following 16-hr treatment with 3 μM 5-Aza; 300 nM Ven; 1 μM Dex; (300 nM Ven + 3 μM 5-Aza); (1 μM Dex + 300 nM Ven). Mean of 3 independent experiments is shown. (F) Cell viability was assessed in CD3+ T cells following treatment with Ven at 100 nM and 300 nM with and without 1 [xM Dex. Graphed are the mean of 2 independent experiments ± SD. (G, H) Intracellular BCL-2 staining was measured in T cells following 16 hr treatment with 300 nM, 1 [xM and 3 [xM Dex. One-way ANOVA was performed to determine P values. ns: not significant; *P≤0.05, **P≤0.01, ***P≤0.001, ****P≤0.0001.
Figure 6.
Figure 6.
Venetoclax and 5-azacytidine in combination enhance cell death in primary multiple myeloma samples ex vivo. Cell viability was assessed using Annexin V / propidium iodide (PI) staining following 16-hour (hr) treatment. (A) Workflow of isolating CD138+ cells from patient (Pt) bone marrow samples and treating them ex vivo. (B) Summary of the response across the 8 non-t(11;14) patients to 3 μM 5-azacytidine (5-Aza), 300 nM venetoclax (Ven), or combination. (C) Summary of the response across 3 t(11;14) patients to 5-Aza, Ven or in combination. (D) Response of non-t(11;14) versus t(11;14) patients to 300 nM Ven following 16-hr treatment. Summary of response to 5-Aza and Ven in 11 patients across (E) anti-apoptotic dependencies, (F) diagnosis, and (G) cytogenetics; ns: not significant; **P≤0.01, ***P≤0.001.

References

    1. Cancer Factsheet Multiple Myeloma (ICD-10 C90) NCRI. https://www.ncri.ie/factsheets Accessed June 28, 2023.
    1. Rajkumar SV. Multiple myeloma: 2020 update on diagnosis, risk-stratification and management. Am J Hematol. 2020;95(5):548-567. - PubMed
    1. Landgren O, Weiss BM. Patterns of monoclonal gammopathy of undetermined significance and multiple myeloma in various ethnic / racial groups: support for genetic factors in pathogenesis. Leukemia. 2009;23(10):1691-1697. - PubMed
    1. Moreau P, Attal M, Facon T. Frontline therapy of multiple myeloma. Blood. 2015;125(20):3076-3084. - PubMed
    1. Maji S, Panda S, Samal SK, et al. . Bcl-2 antiapoptotic family proteins and chemoresistance in cancer. Adv Cancer Res. 2018;137:37-75. - PubMed

MeSH terms

LinkOut - more resources