. 2024 Apr;33(4):e4950.
doi: 10.1002/pro.4950.

Efficient and economic protein labeling for NMR in mammalian expression systems: Application to a preT-cell and T-cell receptor protein

Affiliations

Efficient and economic protein labeling for NMR in mammalian expression systems: Application to a preT-cell and T-cell receptor protein

Robert J Mallis et al. Protein Sci. 2024 Apr.

Abstract

Protein nuclear magnetic resonance (NMR) spectroscopy relies on the ability to isotopically label polypeptides, which is achieved through heterologous expression in various host organisms. Most commonly, Escherichia coli is employed by leveraging isotopically substituted ammonium and glucose to uniformly label proteins with 15N and 13C, respectively. Moreover, E. coli can grow and express proteins in uniformly deuterium-substituted water (D2O), a strategy useful for experiments targeting high molecular weight proteins. Unfortunately, many proteins, particularly those requiring specific posttranslational modifications like disulfide bonding or glycosylation for proper folding and/or function, cannot be readily expressed in their functional forms using E. coli-based expression systems. One such class of proteins includes T-cell receptors and their related preT-cell receptors. In this study, we present an expression system for isotopic labeling of proteins using a nonadherent human embryonic kidney cell line, Expi293F, and a specially designed media. We demonstrate the application of this platform to the β subunit common to both receptors. In addition, we show that this expression system and media can be used to specifically label amino acids Phe, Ile, Val, and Leu in this system, utilizing an amino acid-specific labeling protocol that allows targeted incorporation at high efficiency without significant isotopic scrambling. We demonstrate that this system can also be used to express proteins with fluorinated amino acids. We were routinely able to obtain an NMR sample with a concentration of 200 μM from 30 mL of culture media, utilizing less than 20 mg of the labeled amino acids.

Keywords: 19F‐labeling; Expi293F; T‐cell receptor (TCR); glycosylation; local deuteration; mammalian expression; methyl TROSY; nuclear magnetic resonance spectroscopy (NMR); preT‐cell receptor (preTCR).


Conflict of interest statement

Arjen van den Berg, Jonathan Zmuda, and Melissa Cross are employed by Thermo Fisher. Vladimir Gelev is the founder of FB Reagents Ltd., a company specializing in stable isotope‐labeled biochemicals. Other authors declare no conflict of interest.

Figures

FIGURE 1
FIGURE 1
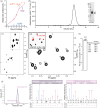
Production of N30β subunit in Expi293F cells. (a) Construction of expression vector for N30βc1. Detail of the multiple cloning site (MCS) modified for use with Golden Gate Cloning (Engler et al., 2008). The C‐terminally 6xHis tagged N30βc1 construct is inserted in the frame with the vector‐supplied signal sequence and includes a stop codon to produce the construct depicted in the inset box. (b) Sodium dodecyl sulfate–polyacrylamide gel electrophoresis (SDS‐PAGE) separation of supernatant time series and immobilized metal affinity chromatography (IMAC) purification. Expression culture supernatant samples (10 μL) (left lanes; day after transfection are indicated) or IMAC chromatography samples (right lanes; FT, column flow through; W1, W2, column washes; E1, E2, column elutions) were clarified by centrifugation and separated via nonreducing SDS‐PAGE. (Left lanes) Molecular weight markers (MW) are indicated. Horizontal lines at the right edge indicate positions of putative N30β glycoforms. (c) Size exclusion chromatography (SEC) separation of concentrated IMAC‐purified protein. The peak of interest is indicated by an arrow. (d) Endo H digestion of SEC‐purified N30β. Each glycoform is indicated with a horizontal line and numbered by presumptive occupancy.
FIGURE 2
FIGURE 2
Isotopic labeling with 13C6‐Ile. A. Viable cell density when cultured in ILVFY medium (blue) as compared to ILVFY supplemented with ILVFY amino acids (red) or commercial preparation of Expi medium (violet). Cells were seeded at 0.4 million cells/mL in 30 mL of medium in a 125 mL shaking culture flask. (b) Size exclusion chromatography (SEC) separation of concentrated immobilized metal affinity chromatography‐purified protein. (inset) Sodium dodecyl sulfate–polyacrylamide gel electrophoresis separation of SEC‐purified protein (N30β). Molecular weight markers (MW) are indicated. Each glycoform is indicated with a horizontal line and numbered by presumptive occupancy, as determined in Figure 1d. (c) 1H–13C 2D‐TROSY‐HMQC spectrum of 400 μM protein sample. Spectrum acquired at 600 MHz with a sweepwidth of 16 × 44 ppm with 1024 × 256 increments and 256 scans. The region of the spectrum delineated by the dotted line indicates the region containing Ile methyl sidechain resonances. (d) Detail of spectral region delineated by dotted box in c. Resolved peaks are numbered for reference. The average chemical shifts for δ‐ and γ‐methyl resonances are indicated by D and G, respectively. (inset) Overlay of 13C6‐Ile‐labeled protein spectral region (black) with that of 13C‐Ile‐δ‐methyl‐labeled protein (270 μM) produced in Escherichia coli (red, Acquired at 700 MHz with a sweepwidth of 16 × 22 ppm with 1024 × 128 increments and 32 scans). (e) Quantitation of U‐13C6‐Ile incorporation. Bar graph depicting median Incorporation of U‐13C6‐Ile into N30β determined by LC‐MS analysis. Points indicate incorporation at specific isoleucine sites also showcased in the accompanying table. (f) Representative extracted MS1 precursor ion chromatogram (left panel) and annotated MS/MS spectra for N30β peptides with representative heavy (DEAViDNSQLPSDR, middle panel) and light (DEAVIDNSQLPSDR, right panel) peptides.
FIGURE 3
FIGURE 3
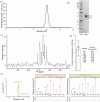
Labeling with 4‐19F‐Phe. (a) Size exclusion chromatography (SEC) separation of concentrated immobilized metal affinity chromatography‐purified protein. (b) Sodium dodecyl sulfate–polyacrylamide gel electrophoresis separation of SEC‐purified protein (N30β). Molecular weight markers (MW) are indicated. Each glycoform is indicated with a horizontal line and numbered by presumptive occupancy. (c) 1D 19F‐NMR spectrum of 120 μM protein sample. Spectrum acquired at 600 MHz with a sweepwidth of 201 ppm and 8192 scans. Resolved peaks are numbered. (d) Quantitation of 4‐F‐Phe incorporation. Bar graph depicting median Incorporation of 4‐F‐Phe into N30β determined by LC‐MS analysis. Points indicate incorporation at specific phenylalanine sites also showcased in the accompanying table. (e) Representative extracted MS1 precursor ion chromatogram (left panel) and annotated MS/MS spectra of 19F‐Phe‐containing (DQGPQLLVYfR, middle panel) and native 4‐1H‐Phe‐containing (DQGPQLLVYFR, right panel) peptides.
FIGURE 4
FIGURE 4
Small‐scale expression for tuning media conditions. (a–c) Cells were incubated in commercial Expi 293 medium (Expi) or ILVFY medium supplemented with ILVFY at 1× standard DMEM levels (1X), 2× DMEM levels (2X) or 4× DMEM levels (4X). Cells were transfected on Day 0 and counted and harvested on Day 4. n = 3 wells per medium formulation (a). Cell density averages ± SD are shown on Day 4 for each medium formulation. (b, c) Ten microliters clarified supernatant was separated by sodium dodecyl sulfate–polyacrylamide gel electrophoresis (SDS‐PAGE) (b) and the three bands corresponding to N30βc1 were quantitated using ImageJ (c) with averages ± SD shown. (d–f) Cells were incubated in commercial Expi 293 medium (Expi) or ILVFY medium supplemented with unlabeled ILVFY at 1X levels with treatment groups substituting 13CH3‐Val (Val), S‐methLD‐Leu (Leu) or U‐13C‐Ile (Ile). S‐methLD‐Leu levels were twice DMEM levels to account for the presence of D‐Leu in the formulation. Cells were transfected on Day 0 and counted and harvested on Day 4. n = 3 wells per medium formulation (d). Cell density averages ± SD are shown on Day 4 for each medium formulation. (e, f) Ten microliters clarified supernatant was separated by SDS‐PAGE (e) and the three bands corresponding to N30βc1 were quantitated using ImageJ (f) with averages ± SD shown. For all plots, the significance of difference from Expi controls is indicated by paired, one‐tailed t‐test: no symbol, p > 0.1; *p < 0.1; **p < 0.05; ***p < 0.01.
FIGURE 5
FIGURE 5
Expression with locally labeled amino acids. (a) Schematic indicating labeling scheme of custom‐synthesized S‐methLD‐Leu. B. 1H‐13C 2D‐TROSY‐HMQC spectrum of 220 μM protein sample acquired at 700 MHz with a sweepwidth of 16 × 22 ppm with 512 × 128 increments and 64 scans. The region of spectrum delineated by a dotted line indicates the region containing Leu methyl sidechain resonances. (c) Detail of spectral region delineated by dotted box in (b). Resolved peaks are numbered for reference. (d) Schematic indicating labeling 13CH3‐Val. (e) 1H‐13C 2D‐TROSY‐HMQC spectrum of 250 μM protein sample acquired as in (b). The region of the spectrum delineated by a dotted line indicates the region containing Val methyl sidechain resonances. (f) Detail of spectral region delineated by dotted box in (b). Resolved peaks are numbered for reference.
FIGURE 6
FIGURE 6
Synthesis of S‐methLD‐Leu. Pro‐S‐13C‐methyl‐labeled and “locally deuterated” D/L‐leucine (S‐methLD‐Leu) was synthesized as described previously via isobutanol 1 (Dubey et al., 2021), with modifications as indicated.

Similar articles

References

    1. Adams JJ, Narayanan S, Liu B, Birnbaum ME, Kruse AC, Bowerman NA, et al. T cell receptor signaling is limited by docking geometry to peptide‐major histocompatibility complex. Immunity. 2011;35:681–693. - PMC - PubMed
    1. Ahuja S, Hornak V, Yan ECY, Syrett N, Goncalves JA, Hirshfeld A, et al. Helix movement is coupled to displacement of the second extracellular loop in rhodopsin activation. Nat Struct Mol Biol. 2009;16:168–175. - PMC - PubMed
    1. Aricescu AR, Owens RJ. Expression of recombinant glycoproteins in mammalian cells: towards an integrative approach to structural biology. Curr Opin Struct Biol. 2013;23:345–356. - PMC - PubMed
    1. Banci L, Barbieri L, Bertini I, Luchinat E, Secci E, Zhao Y, et al. Atomic‐resolution monitoring of protein maturation in live human cells by NMR. Nat Chem Biol. 2013;9:297–299. - PMC - PubMed
    1. Behera SP, Dubey A, Chen W‐N, De Paula VS, Zhang M, Sgourakis NG, et al. Nearest‐neighbor NMR spectroscopy: categorizing spectral peaks by their adjacent nuclei. Nat Commun. 2020;11:5547. - PMC - PubMed

LinkOut - more resources