. 2024 May 2;12(5):e0416023.
doi: 10.1128/spectrum.04160-23. Epub 2024 Mar 21.

Diverse winter communities and biogeochemical cycling potential in the under-ice microbial plankton of a subarctic river-to-sea continuum

Affiliations

Diverse winter communities and biogeochemical cycling potential in the under-ice microbial plankton of a subarctic river-to-sea continuum

Marie-Amélie Blais et al. Microbiol Spectr. .

Abstract

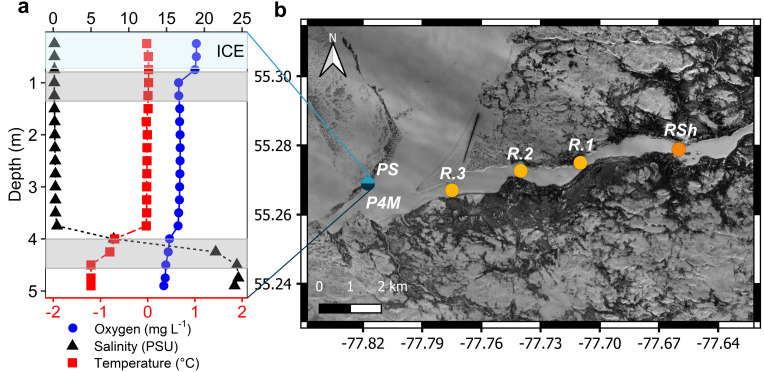
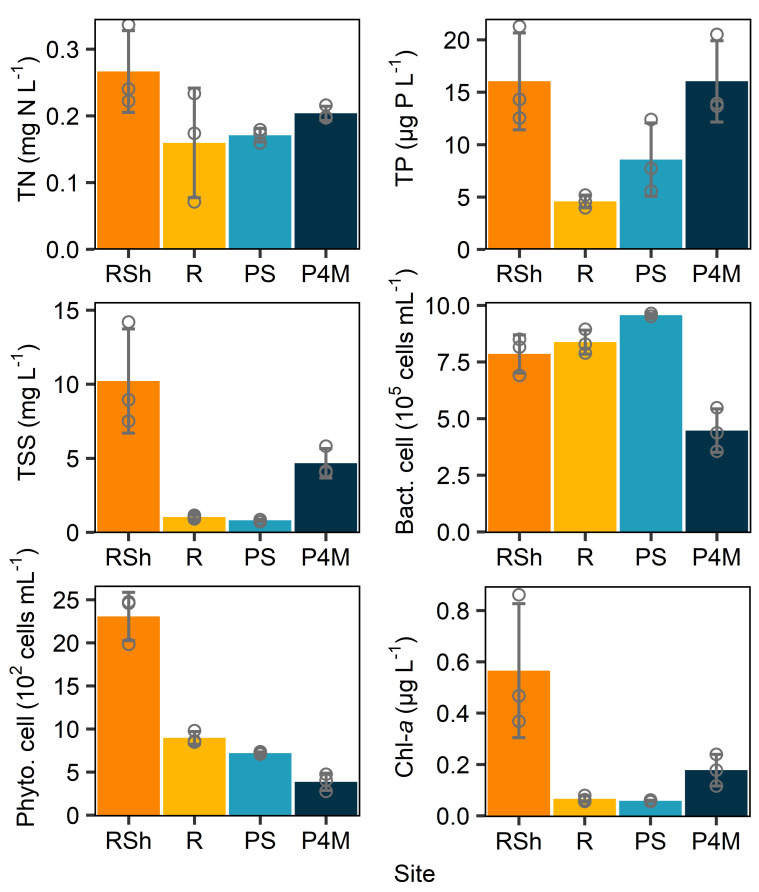
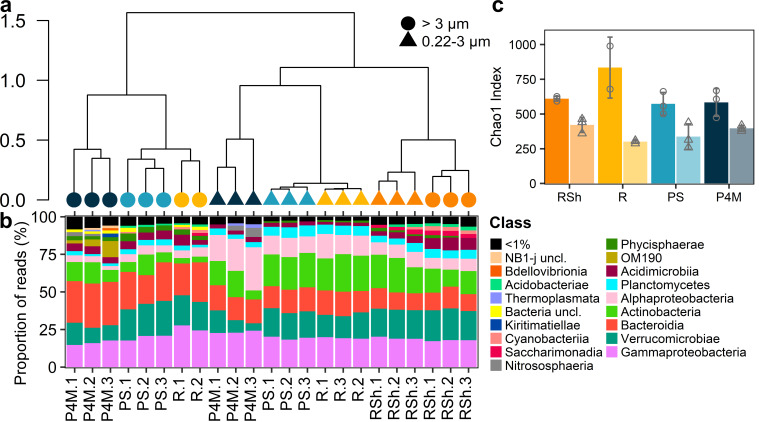
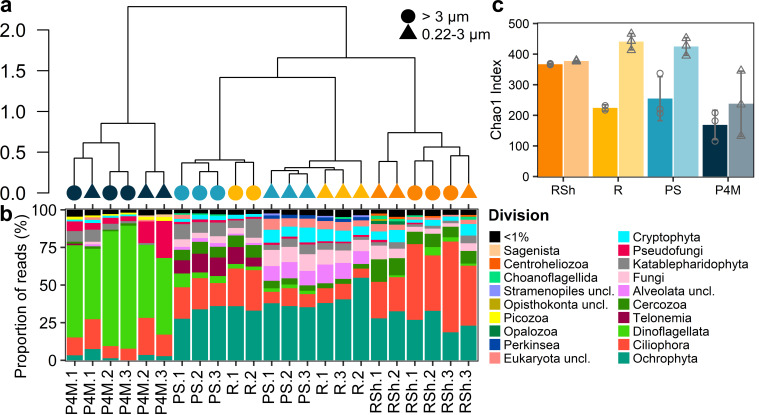
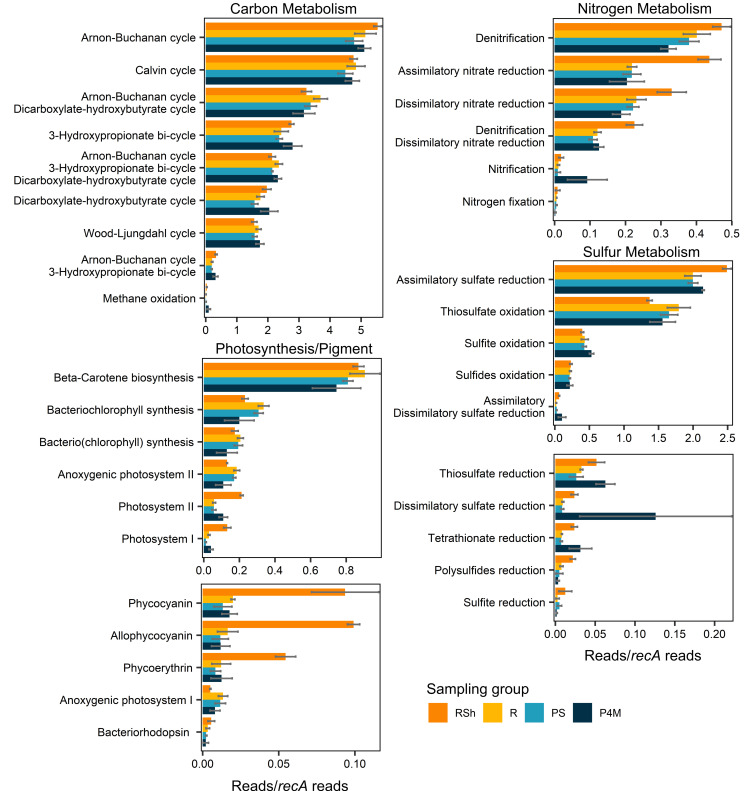
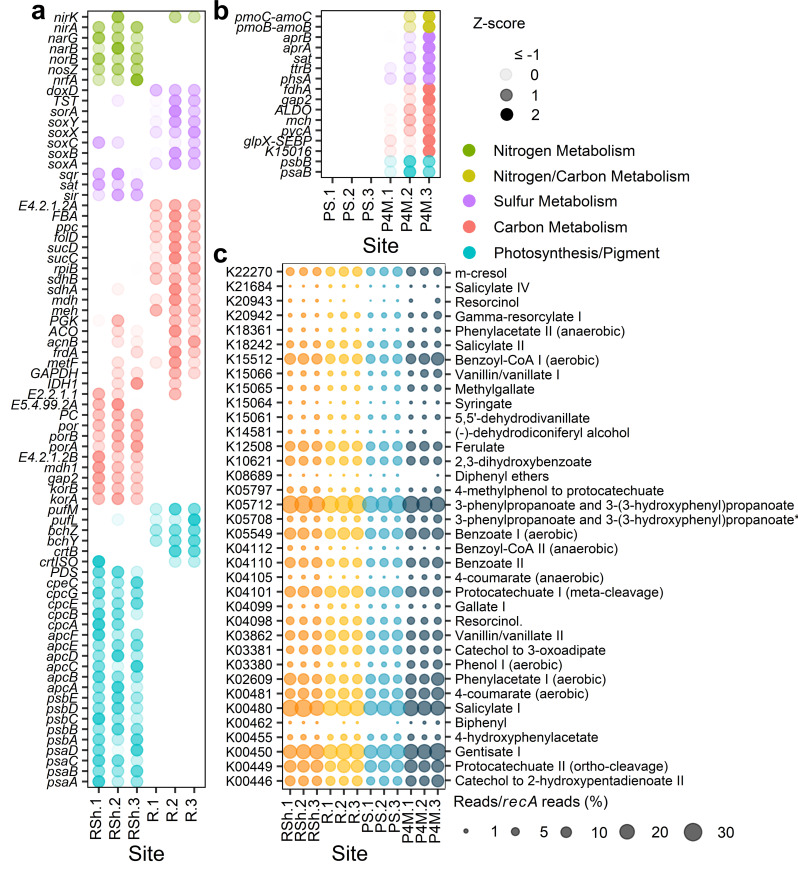
Winter conditions greatly alter the limnological properties of lotic ecosystems and the availability of nutrients, carbon, and energy resources for microbial processes. However, the composition and metabolic capabilities of winter microbial communities are still largely uncharacterized. Here, we sampled the winter under-ice microbiome of the Great Whale River (Nunavik, Canada) and its discharge plume into Hudson Bay. We used a combination of 16S and 18S rRNA gene amplicon analysis and metagenomic sequencing to evaluate the size-fractionated composition and functional potential of the microbial plankton. These under-ice communities were diverse in taxonomic composition and metabolically versatile in terms of energy and carbon acquisition, including the capacity to carry out phototrophic processes and degrade aromatic organic matter. Limnological properties, community composition, and metabolic potential differed between shallow and deeper sites in the river, and between fresh and brackish water in the vertical profile of the plume. Community composition also varied by size fraction, with a greater richness of prokaryotes in the larger size fraction (>3 µm) and of microbial eukaryotes in the smaller size fraction (0.22-3 µm). The freshwater communities included cosmopolitan bacterial genera that were previously detected in the summer, indicating their persistence over time in a wide range of physico-chemical conditions. These observations imply that the microbial communities of subarctic rivers and their associated discharge plumes retain a broad taxonomic and functional diversity throughout the year and that microbial processing of complex terrestrial materials persists beneath the ice during the long winter season.

Importance: Microbiomes vary over multiple timescales, with short- and long-term changes in the physico-chemical environment. However, there is a scarcity of data and understanding about the structure and functioning of aquatic ecosystems during winter relative to summer. This is especially the case for seasonally ice-covered rivers, limiting our understanding of these ecosystems that are common throughout the boreal, subpolar, and polar regions. Here, we examined the winter under-ice microbiome of a Canadian subarctic river and its entry to the sea to characterize the taxonomic and functional features of the microbial community. We found substantial diversity in both composition and functional capabilities, including the capacity to degrade complex terrestrial compounds, despite the constraints imposed by a prolonged seasonal ice-cover and near-freezing water temperatures. This study indicates the ecological complexity and importance of winter microbiomes in ice-covered rivers and the coastal marine environment that they discharge into.

Keywords: coastal water; metagenome; microbial eukaryotes; microbiome; prokaryotes; river; size fraction; subarctic; under-ice; winter limnology.


Conflict of interest statement

The authors declare no conflict of interest.

Figures

Fig 1
Fig 1
(a) Vertical profile of temperature (bottom x-axis), oxygen, and salinity (top x-axis for both) in the plume. The upper blue-shaded band corresponds to the ice cover and two gray bands to the depth strata that were sampled for microbial analysis. (b) Map of the sampling sites along the Great Whale River and its plume in Hudson Bay (Copernicus Sentinel-2 data 2019, processed by ESA).
Fig 2
Fig 2
Means of selected limnological variables for each group of sites. RSh corresponds to shallow river sites (depth <1 m); R, deeper river sites (depth >1 m); PS, plume surface; P4M, plume at 4 m depth (brackish water). Circles correspond to individual values, and error bars are SD. n = 3.
Fig 3
Fig 3
Prokaryotic communities in the Great Whale River and Plume. (a) Ward hierarchical clustering of the prokaryote community at the ASV level. Shapes correspond to the size fraction and colors to the sampling group (as identified in panel c). Sample identification corresponds to panel b. (b) Stacked bar graph of the read proportions of prokaryote ASVs at class level. Samples are ordered according to the hierarchical clustering in panel a. (c) Bar graphs showing the mean Chao1 index of prokaryotes for each sampling group and separated by size fraction (darker colors and circles correspond to large size fraction; lighter colors and triangles correspond to small size fraction). Shapes correspond to individual values, and error bars are SD. n = 3 except for R large size fraction (n = 2). Site labels are as in Table 1 and Fig. 2 legends. Sample R.3 (>3 µm) is missing as the PCR amplification was unsuccessful.
Fig 4
Fig 4
Eukaryotic communities in the Great Whale River and Plume. (a) Ward hierarchical clustering of the microbial eukaryote community at the ASV level. Shapes correspond to the size fraction and colors to the sampling group (as identified in panel c). Sample identification corresponds to panel b. (b) Stacked bar graph of the read proportions of microbial eukaryote ASVs at division level. Samples are ordered according to the hierarchical clustering in panel a. (c) Bar graphs showing the mean Chao1 index of microbial eukaryotes for each sampling group and separated by size fraction (darker colors and circles correspond to large size fraction; lighter colors and triangles correspond to small size fraction). Shapes correspond to individual values, and error bars are SD. n = 3 except for R large size fraction (n = 2). Site labels are as in Table 1 and Fig. 2 legends. Sample R.3 (>3 µm) is missing as the PCR amplification was unsuccessful.
Fig 5
Fig 5
Means ± SD of the sum of normalized gene abundances (reads/recA reads) associated with pathways/reactions for carbon, nitrogen, and sulfur metabolism and for photosynthesis for each sampling group. The list of genes used is provided in Table S1. Bars with multiple pathways/reaction names consist of KOs shared between these pathways/reactions, except pmo-amoABC genes, which were added to the sum of reads for nitrification and methane oxidation. Significantly differentially abundant genes (adjusted P-values ≤0.01) between shallow and deeper river sites and between plume surface and brackish water are presented in Fig. 6a and b.
Fig 6
Fig 6
(a and b) Z-score (SD from the row mean, calculated from normalized gene abundance reads/recA reads) of significantly differentially abundant genes (adjusted P-values ≤0.01) between shallow and deeper river sites (RSh vs R; panel a) and between plume surface and brackish water (PS vs P4M; panel b). The genes shown are restricted to those implicated in the reactions outlined in Fig. 5 for nitrogen, carbon, and sulfur metabolism and photosynthesis/pigment. (c) Bubble plot of the abundance (reads/recA reads; %) of marker genes implicated in the degradation of aromatic compounds. Marker genes are identified by their KEGG number and name of the degradation pathway. 3-Phenylpropanoate and 3-(3-hydroxyphenyl)propanoate* is short for 3-phenylpropanoate and 3-(3-hydroxyphenyl)propanoate to 2-hydroxypentadienoate. Color represents different sampling groups [RSh, shallow river sites; R, deeper river sites; PS, plume surface; P4M, plume at 4 m depth (brackish water)].

References

    1. Ettema R. 2008. Ice effects on sediments transport in rivers, p 613–648. In Garcia MH (ed), Sedimentation engineering: processes, measurements, modeling, and practice. American Society of Civil Engineers, Virginia.
    1. Price PB, Sowers T. 2004. Temperature dependence of metabolic rates for microbial growth, maintenance, and survival. Proc Natl Acad Sci U S A 101:4631–4636. doi:10.1073/pnas.0400522101 - DOI - PMC - PubMed
    1. Bertilsson S, Burgin A, Carey CC, Fey SB, Grossart H-P, Grubisic LM, Jones ID, Kirillin G, Lennon JT, Shade A, Smyth RL. 2013. The under-ice microbiome of seasonally frozen lakes. Limnol Oceanogr 58:1998–2012. doi:10.4319/lo.2013.58.6.1998 - DOI
    1. Crump BC, Peterson BJ, Raymond PA, Amon RMW, Rinehart A, McClelland JW, Holmes RM. 2009. Circumpolar synchrony in big river bacterioplankton. Proc Natl Acad Sci U S A 106:21208–21212. doi:10.1073/pnas.0906149106 - DOI - PMC - PubMed
    1. Potvin M, Rautio M, Lovejoy C. 2021. Freshwater microbial eukaryotic core communities, open-water and under-ice specialists in southern Victoria Island lakes (Ekaluktutiak, NU, Canada). Front Microbiol 12:786094. doi:10.3389/fmicb.2021.786094 - DOI - PMC - PubMed

Publication types