. 2024 Jun 3;30(11):2571-2581.
doi: 10.1158/1078-0432.CCR-23-2760.

Memory/Active T-Cell Activation Is Associated with Immunotherapeutic Response in Fumarate Hydratase-Deficient Renal Cell Carcinoma

Affiliations

Memory/Active T-Cell Activation Is Associated with Immunotherapeutic Response in Fumarate Hydratase-Deficient Renal Cell Carcinoma

Junru Chen et al. Clin Cancer Res. .

Abstract

Purpose: Fumarate hydratase-deficient renal cell carcinoma (FH-deficient RCC) is a rare and lethal subtype of kidney cancer. However, the optimal treatments and molecular correlates of benefits for FH-deficient RCC are currently lacking.

Experimental design: A total of 91 patients with FH-deficient RCC from 15 medical centers between 2009 and 2022 were enrolled in this study. Genomic and bulk RNA-sequencing (RNA-seq) were performed on 88 and 45 untreated FH-deficient RCCs, respectively. Single-cell RNA-seq was performed to identify biomarkers for treatment response. Main outcomes included disease-free survival (DFS) for localized patients, objective response rate (ORR), progression-free survival (PFS), and overall survival (OS) for patients with metastasis.

Results: In the localized setting, we found that a cell-cycle progression signature enabled to predict disease progression. In the metastatic setting, first-line immune checkpoint inhibitor plus tyrosine kinase inhibitor (ICI+TKI) combination therapy showed satisfactory safety and was associated with a higher ORR (43.2% vs. 5.6%), apparently superior PFS (median PFS, 17.3 vs. 9.6 months, P = 0.016) and OS (median OS, not reached vs. 25.7 months, P = 0.005) over TKI monotherapy. Bulk and single-cell RNA-seq data revealed an enrichment of memory and effect T cells in responders to ICI plus TKI combination therapy. Furthermore, we identified a signature of memory and effect T cells that was associated with the effectiveness of ICI plus TKI combination therapy.

Conclusions: ICI plus TKI combination therapy may represent a promising treatment option for metastatic FH-deficient RCC. A memory/active T-cell-derived signature is associated with the efficacy of ICI+TKI but necessitates further validation.


Figures

Figure 1. Characteristics and somatic alterations in FH-deficient RCC. A, Oncoplot showing clinicopathologic features, germline and somatic FH alterations, and co-occurring somatic mutations (prevalence > 5%) in patients with FH-deficient RCC (n = 88); B, Lollipop plot showing positions of FH somatic and germline alterations.
Figure 1.
Characteristics and somatic alterations in FH-deficient RCC. A, Oncoplot showing clinicopathologic features, germline and somatic FH alterations, and co-occurring somatic mutations (prevalence > 5%) in patients with FH-deficient RCC (n = 88); B, Lollipop plot showing positions of FH somatic and germline alterations.
Figure 2. Identification of predictors for early progression in patients with localized FH-deficient RCC. A, Univariate and multivariate Cox regression analyses of disease-free survival (DFS). B, Differentially expressed genes between patients with early and late disease progression. C, Enrichment of hallmark cell-cycle signaling pathways in early progression group revealed by gene set enrichment analysis. D, Kaplan–Meier analysis of DFS in patients with localized FH-deficient RCC stratified by quartiles of cell-cycle progression scores.
Figure 2.
Identification of predictors for early progression in patients with localized FH-deficient RCC. A, Univariate and multivariate Cox regression analyses of disease-free survival (DFS). B, Differentially expressed genes between patients with early and late disease progression. C, Enrichment of hallmark cell-cycle signaling pathways in early progression group revealed by gene set enrichment analysis. D, Kaplan–Meier analysis of DFS in patients with localized FH-deficient RCC stratified by quartiles of cell-cycle progression scores.
Figure 3. Treatment outcomes of patients with metastatic FH-deficient RCC. A, Kaplan–Meier analysis of progression-free survival in patients treated with first-line immune checkpoint inhibitor plus tyrosine kinase inhibitor combination therapy (ICI+TKI) versus TKI monotherapy. B, Kaplan–Meier analysis of overall survival (OS) in patients treated with first-line ICI+TKI versus TKI monotherapy. C, Kaplan–Meier analysis of OS in patients treated with non–first-line ICI+TKI versus patients who never received ICI+TKI during the treatment history.
Figure 3.
Treatment outcomes of patients with metastatic FH-deficient RCC. A, Kaplan–Meier analysis of progression-free survival in patients treated with first-line immune checkpoint inhibitor plus tyrosine kinase inhibitor combination therapy (ICI+TKI) versus TKI monotherapy. B, Kaplan–Meier analysis of overall survival (OS) in patients treated with first-line ICI+TKI versus TKI monotherapy. C, Kaplan–Meier analysis of OS in patients treated with non–first-line ICI+TKI versus patients who never received ICI+TKI during the treatment history.
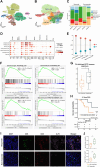
Figure 4. Single-cell RNA-sequencing (RNA-seq) profiling of FH-deficient RCC and newly defined signature. A, Single-cell RNA-seq (scRNA-seq) cell atlas generated from five samples obtained from four FH-deficient RCC cases. B, UMAP plot of all T cells collected from five sample. C, Bar plots showing tissue distribution of the T cells. D, Dot plot of marker gene expression for the seven T clusters. E, Tissue prevalence of four T-cell clusters estimated by Ro/e score. F, GSEA analysis showing enrichment of activated CD4, activated CD8, central memory CD4, and effector memory CD8 signatures in responders in the bulk RNA-seq cohort. G, Responders had higher expression of FH-deficient RCC immune signature than non-responders in the bulk RNA-seq cohort; a P value was determined by the two-sided Wilcoxon rank-sum test. H, Kaplan–Meier analysis of progression-free survival in patients treated with first-line immune checkpoint inhibitor plus tyrosine kinase inhibitor combination therapy (ICI+TKI) separated by high and low FH-deficient RCC immune signature score in the bulk RNA-seq cohort. I, More IL7R+CD8/CD4+ cells in responders of ICI+TKI revealed by multiple immunofluorescences staining. J, The percentage of IL7R+CD8+ T cells, out of CD8+ T cells, in samples from non-responders and responders (top) and the percentage of IL7R+CD4+ T cells, out of CD4+ T cells, in samples from non-responders and responders (down); the P value was determined by the two-sided Wilcoxon rank-sum test. *, P < 0.05.
Figure 4.
Single-cell RNA-sequencing (RNA-seq) profiling of FH-deficient RCC and newly defined signature. A, Single-cell RNA-seq (scRNA-seq) cell atlas generated from five samples obtained from four FH-deficient RCC cases. B, UMAP plot of all T cells collected from five sample. C, Bar plots showing tissue distribution of the T cells. D, Dot plot of marker gene expression for the seven T clusters. E, Tissue prevalence of four T-cell clusters estimated by Ro/e score. F, GSEA analysis showing enrichment of activated CD4, activated CD8, central memory CD4, and effector memory CD8 signatures in responders in the bulk RNA-seq cohort. G, Responders had higher expression of FH-deficient RCC immune signature than non-responders in the bulk RNA-seq cohort; a P value was determined by the two-sided Wilcoxon rank-sum test. H, Kaplan–Meier analysis of progression-free survival in patients treated with first-line immune checkpoint inhibitor plus tyrosine kinase inhibitor combination therapy (ICI+TKI) separated by high and low FH-deficient RCC immune signature score in the bulk RNA-seq cohort. I, More IL7R+CD8/CD4+ cells in responders of ICI+TKI revealed by multiple immunofluorescences staining. J, The percentage of IL7R+CD8+ T cells, out of CD8+ T cells, in samples from non-responders and responders (top) and the percentage of IL7R+CD4+ T cells, out of CD4+ T cells, in samples from non-responders and responders (down); the P value was determined by the two-sided Wilcoxon rank-sum test. *, P < 0.05.

References

    1. Moch H, Amin MB, Berney DM, Compérat EM, Gill AJ, Hartmann A, et al. . The 2022 World Health Organization classification of tumours of the urinary system and male genital organs-part A: renal, penile, and testicular tumours. Eur Urol 2022;82:458–68. - PubMed
    1. Muller M, Guillaud-Bataille M, Salleron J, Genestie C, Deveaux S, Slama A, et al. . Pattern multiplicity and fumarate hydratase (FH)/S-(2-succino)-cysteine (2SC) staining but not eosinophilic nucleoli with perinucleolar halos differentiate hereditary leiomyomatosis and renal cell carcinoma-associated renal cell carcinomas from kidney tumors without FH gene alteration. Mod Pathol 2018;31:974–83. - PubMed
    1. Carril-Ajuria L, Colomba E, Cerbone L, Romero-Ferreiro C, Crouzet L, Laguerre B, et al. . Response to systemic therapy in fumarate hydratase–deficient renal cell carcinoma. Eur J Cancer 2021;151:106–14. - PubMed
    1. Sun G, Zhang X, Liang J, Pan X, Zhu S, Liu Z, et al. . Integrated molecular characterization of fumarate hydratase–deficient renal cell carcinoma. Clin Cancer Res 2021;27:1734–43. - PubMed
    1. Xu Y, Kong W, Cao M, Wang J, Wang Z, Zheng L, et al. . Genomic profiling and response to immune checkpoint inhibition plus tyrosine kinase inhibition in FH-deficient renal cell carcinoma. Eur Urol 2023;83:163–72. - PubMed

MeSH terms

Substances