Exploration of low-frequency allelic variants of SARS-CoV-2 genomes reveals coinfections in Mexico occurred during periods of VOCs turnover
- PMID: 38512312
- PMCID: PMC11004493
- DOI: 10.1099/mgen.0.001220
Exploration of low-frequency allelic variants of SARS-CoV-2 genomes reveals coinfections in Mexico occurred during periods of VOCs turnover
Abstract
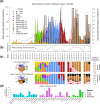
A total of 14 973 alleles in 29 661 sequenced samples collected between March 2021 and January 2023 by the Mexican Consortium for Genomic Surveillance (CoViGen-Mex) and collaborators were used to construct a thorough map of mutations of the Mexican SARS-CoV-2 genomic landscape containing Intra-Patient Minor Allelic Variants (IPMAVs), which are low-frequency alleles not ordinarily present in a genomic consensus sequence. This additional information proved critical in identifying putative coinfecting variants included alongside the most common variants, B.1.1.222, B.1.1.519, and variants of concern (VOCs) Alpha, Gamma, Delta, and Omicron. A total of 379 coinfection events were recorded in the dataset (a rate of 1.28 %), resulting in the first such catalogue in Mexico. The most common putative coinfections occurred during the spread of Delta or after the introduction of Omicron BA.2 and its descendants. Coinfections occurred constantly during periods of variant turnover when more than one variant shared the same niche and high infection rate was observed, which was dependent on the local variants and time. Coinfections might occur at a higher frequency than customarily reported, but they are often ignored as only the consensus sequence is reported for lineage identification.
Keywords: Mexico; SARS-CoV-2; coinfections; genomic surveillance; viral quasispecies.
Conflict of interest statement
The authors declare no conflicts of interest. Founders had no participation in the design of the study, the collection, analyses, data interpretation, writing of the manuscript, nor in the decision to publish the results.
Figures


Similar articles
-
Prevalence of symptoms, comorbidities, and reinfections in individuals infected with Wild-Type SARS-CoV-2, Delta, or Omicron variants: a comparative study in western Mexico.Front Public Health. 2023 Apr 27;11:1149795. doi: 10.3389/fpubh.2023.1149795. eCollection 2023. Front Public Health. 2023. PMID: 37181688 Free PMC article.
-
Genomic Surveillance of SARS-CoV-2 in México: Three Years since Wuhan, China's First Reported Case.Viruses. 2023 Nov 8;15(11):2223. doi: 10.3390/v15112223. Viruses. 2023. PMID: 38005903 Free PMC article.
-
Two Years of Evolutionary Dynamics of SARS-CoV-2 in Mexico, With Emphasis on the Variants of Concern.Front Microbiol. 2022 Jul 5;13:886585. doi: 10.3389/fmicb.2022.886585. eCollection 2022. Front Microbiol. 2022. PMID: 35865920 Free PMC article.
-
The Rise and Fall of SARS-CoV-2 Variants and Ongoing Diversification of Omicron.Viruses. 2022 Sep 10;14(9):2009. doi: 10.3390/v14092009. Viruses. 2022. PMID: 36146815 Free PMC article. Review.
-
The outbreak of SARS-CoV-2 Omicron lineages, immune escape, and vaccine effectivity.J Med Virol. 2023 Jan;95(1):e28138. doi: 10.1002/jmv.28138. Epub 2022 Sep 21. J Med Virol. 2023. PMID: 36097349 Free PMC article. Review.
Cited by
-
SARS-CoV-2 biological clones are genetically heterogeneous and include clade-discordant residues.J Virol. 2025 May 20;99(5):e0225024. doi: 10.1128/jvi.02250-24. Epub 2025 Apr 24. J Virol. 2025. PMID: 40272156 Free PMC article.
References
-
- Secretara de Salud - Gobierno de México Datos Abiertos Dirección General de Epidemiología Secretaría de Salud Gobierno. 2023. [8-August-2023]. https://www.gob.mx/salud/documentos/datos-abiertos-152127 accessed.
-
- Farr B, Rajan D, Betteridge E, Shirley L, Quail M, et al. COVID-19 ARTIC v4.1 Illumina Library Construction and Sequencing Protocol-Tailed Method V.2 DNA Pipelines R&D, Protocol Citation: DNA Pipelines R&D. Epub Ahead of Print. 2022. - DOI
MeSH terms
Supplementary concepts
LinkOut - more resources
Full Text Sources
Medical
Miscellaneous

