

Settling Velocities of Small Microplastic Fragments and Fibers
- PMID: 38512318
- PMCID: PMC11008250
- DOI: 10.1021/acs.est.3c09602
Settling Velocities of Small Microplastic Fragments and Fibers
Erratum in
-
Correction to "Settling Velocities of Small Microplastic Fragments and Fibers".Environ Sci Technol. 2025 Aug 5;59(30):16066-16067. doi: 10.1021/acs.est.5c08557. Epub 2025 Jul 24. Environ Sci Technol. 2025. PMID: 40706018 Free PMC article. No abstract available.
Abstract
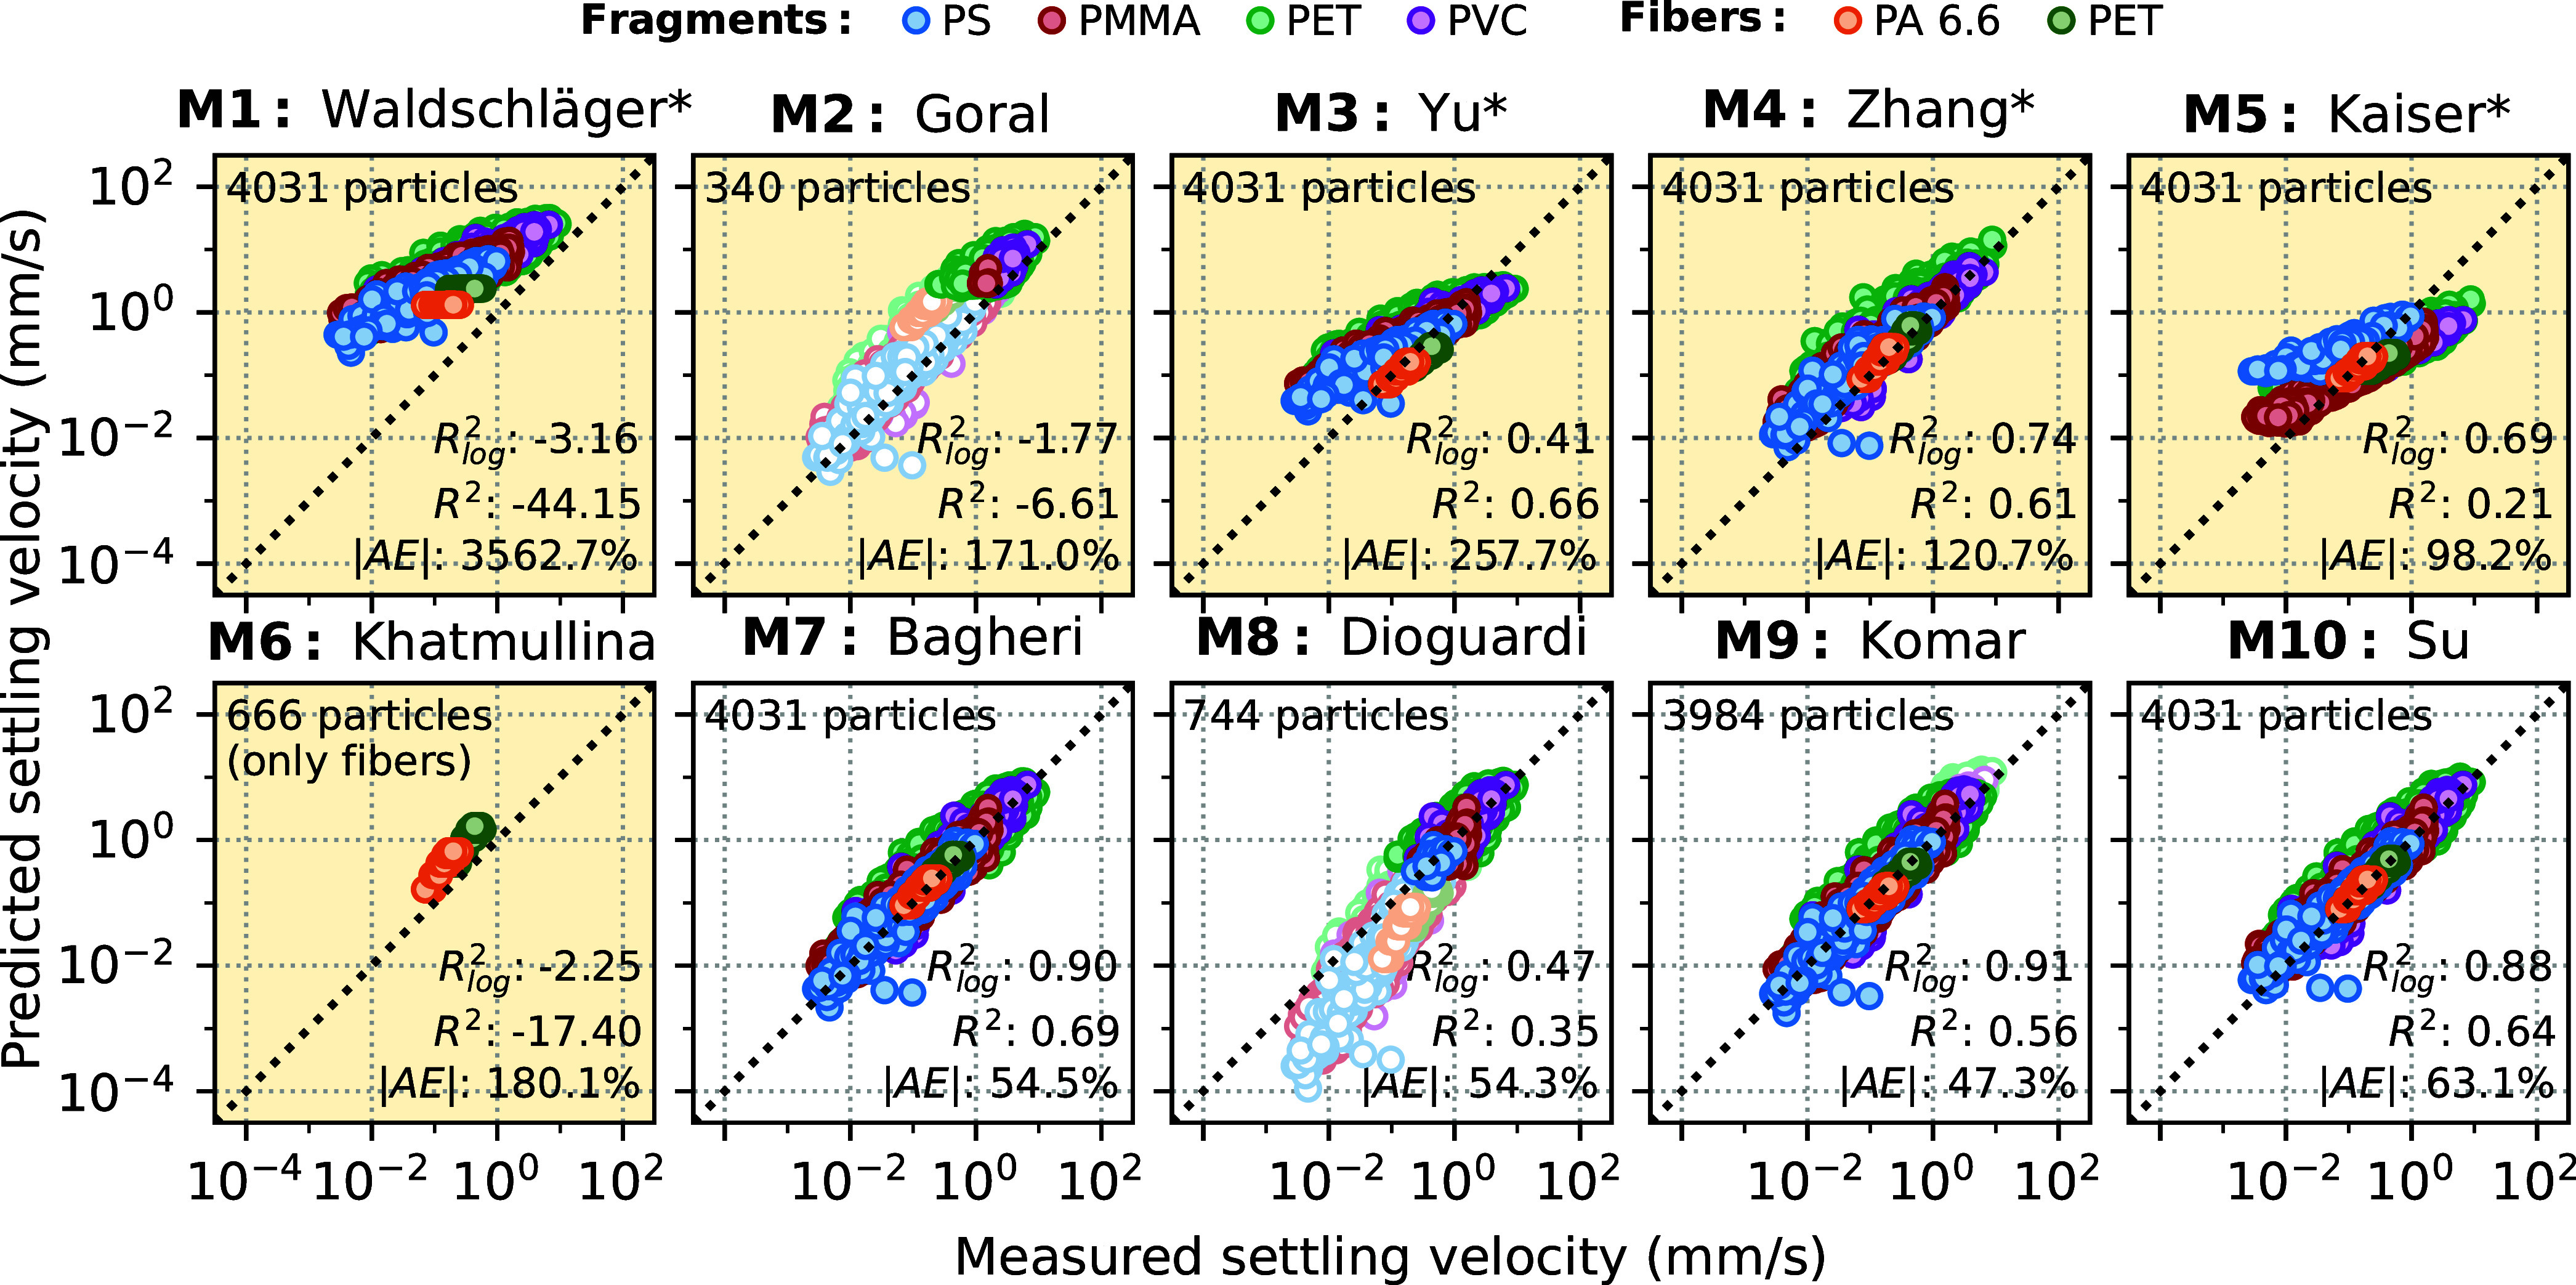
There is only sparse empirical data on the settling velocity of small, nonbuoyant microplastics thus far, although it is an important parameter governing their vertical transport within aquatic environments. This study reports the settling velocities of 4031 exemplary microplastic particles. Focusing on the environmentally most prevalent particle shapes, irregular microplastic fragments of four different polymer types (9-289 μm) and five discrete length fractions (50-600 μm) of common nylon and polyester fibers are investigated, respectively. All settling experiments are carried out in quiescent water by using a specialized optical imaging setup. The method has been previously validated in order to minimize disruptive factors, e.g., thermal convection or particle interactions, and thus enable the precise measurements of the velocities of individual microplastic particles (0.003-9.094 mm/s). Based on the obtained data, ten existing models for predicting a particle's terminal settling velocity are assessed. It is concluded that models, which were specifically deduced from empirical data on larger microplastics, fail to provide accurate predictions for small microplastics. Instead, a different approach is highlighted as a viable option for computing settling velocities across the microplastics continuum in terms of size, density, and shape.
Keywords: fibers; fragments; microplastics; sedimentation; settling velocity; sinking velocity; transport.
Conflict of interest statement
The authors declare no competing financial interest.
Figures


References
-
- Tekman M. B.; Wekerle C.; Lorenz C.; Primpke S.; Hasemann C.; Gerdts G.; Bergmann M. Tying up Loose Ends of Microplastic Pollution in the Arctic: Distribution from the Sea Surface through the Water Column to Deep-Sea Sediments at the HAUSGARTEN Observatory. Environ. Sci. Technol. 2020, 54 (7), 4079–4090. 10.1021/acs.est.9b06981. - DOI - PubMed
-
- Peng X.; Chen M.; Chen S.; Dasgupta S.; Xu H.; Ta K.; Du M.; Li J.; Guo Z.; Bai S. Microplastics contaminate the deepest part of the world’s ocean. Geochem. Perspect. Lett. 2018, 9, 1–5. 10.7185/geochemlet.1829. - DOI
-
- International Organization for Standardization . ISO/TR 21960:–02:Plastics - Environmental aspects - State of knowledge and methodologies, Geneva, Switzerland, 2020https://www.iso.org/standard/72300.html, (accessed August 10, 2023).
-
- Kooi M.; Koelmans A. A. Simplifying Microplastic via Continuous Probability Distributions for Size, Shape, and Density. Environ. Sci. Technol. Lett. 2019, 6 (9), 551–557. 10.1021/acs.estlett.9b00379. - DOI
MeSH terms
Substances
LinkOut - more resources
Full Text Sources
