. 2024 Mar 21;9(8):e173273.
doi: 10.1172/jci.insight.173273.

Integrated plasma proteomics identifies tuberculosis-specific diagnostic biomarkers

Affiliations

Integrated plasma proteomics identifies tuberculosis-specific diagnostic biomarkers

Hannah F Schiff et al. JCI Insight. .

Abstract

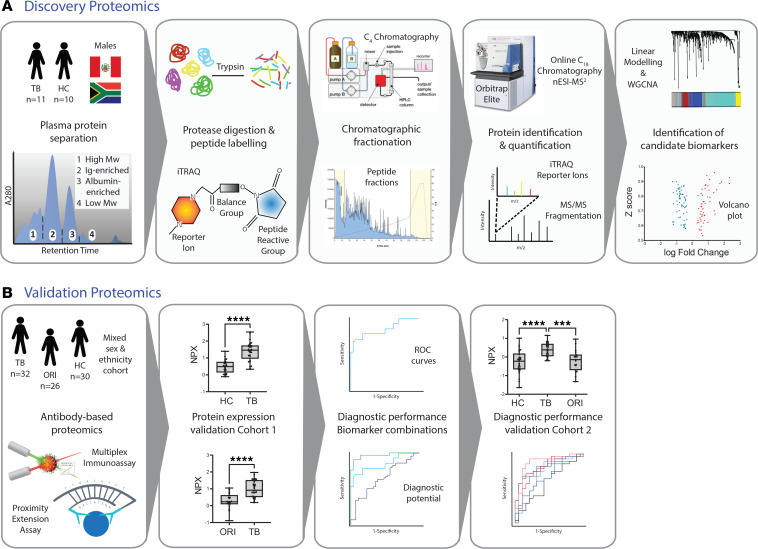
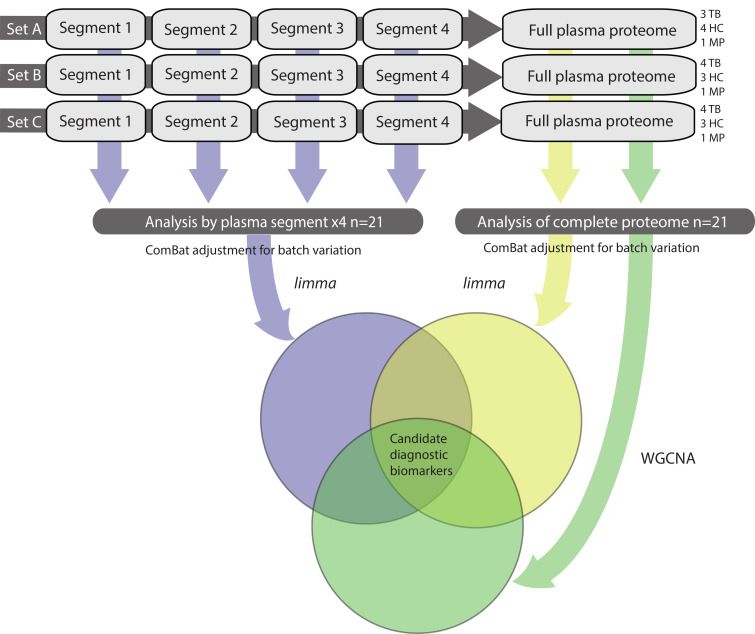
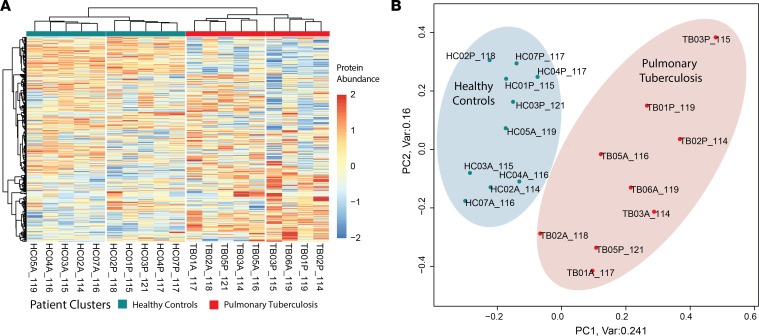
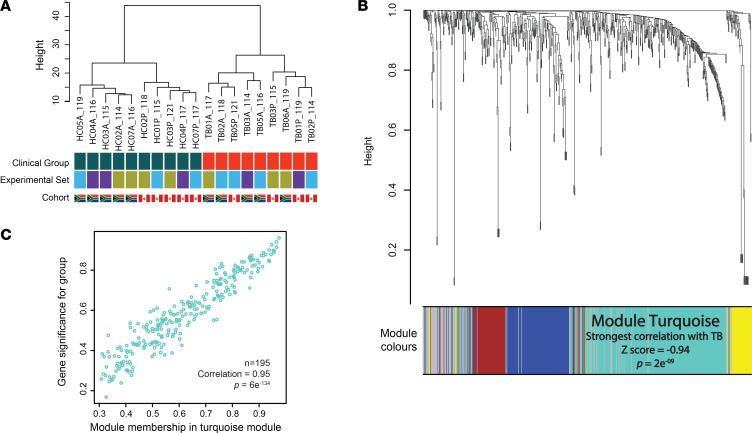
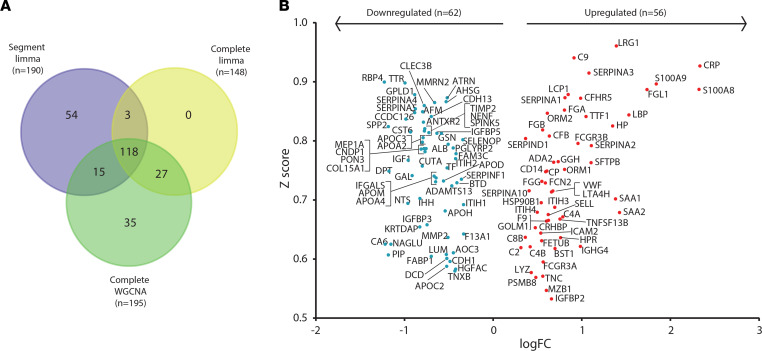
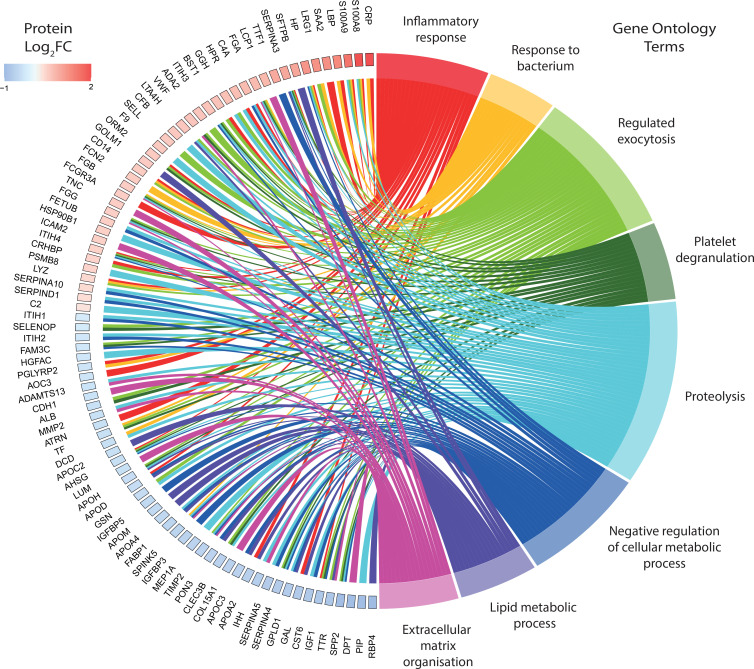
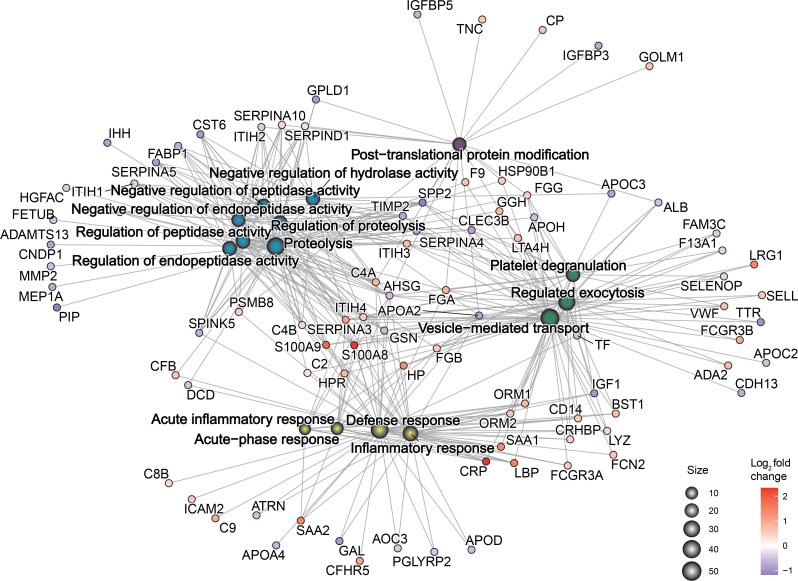
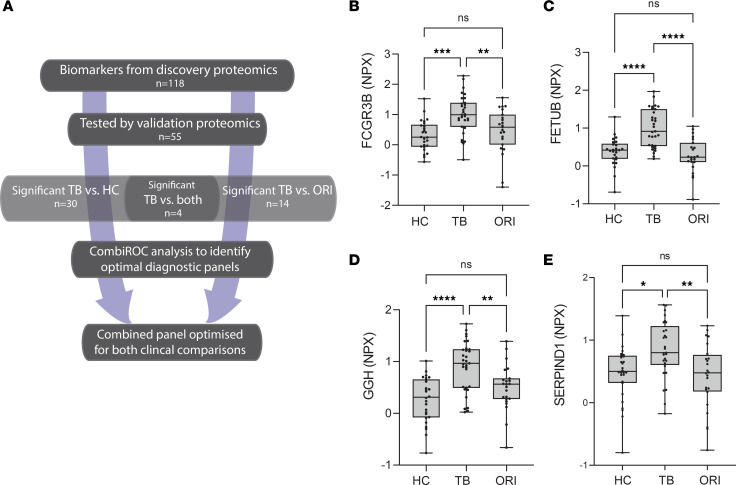
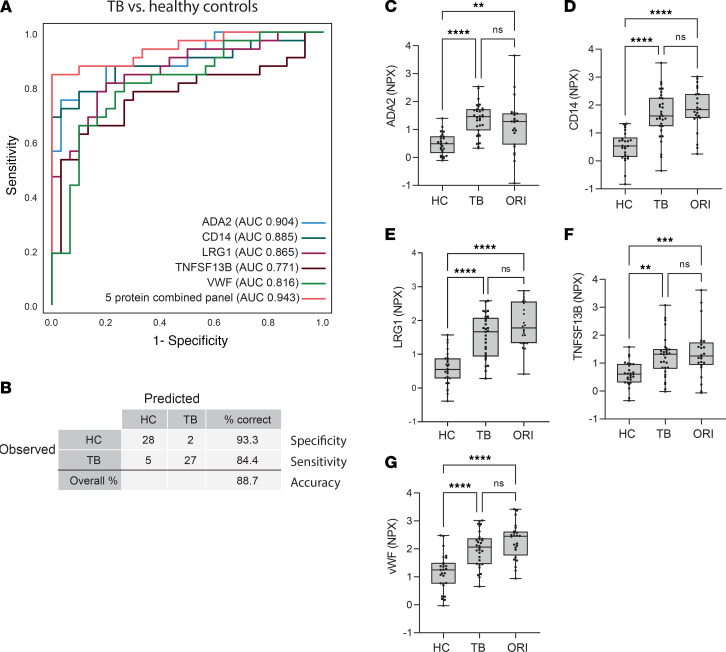
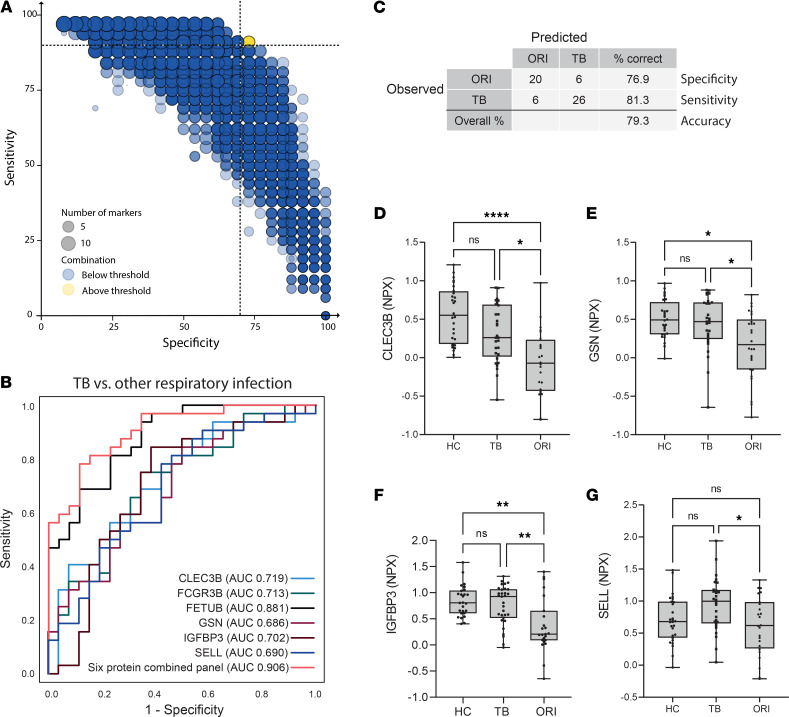
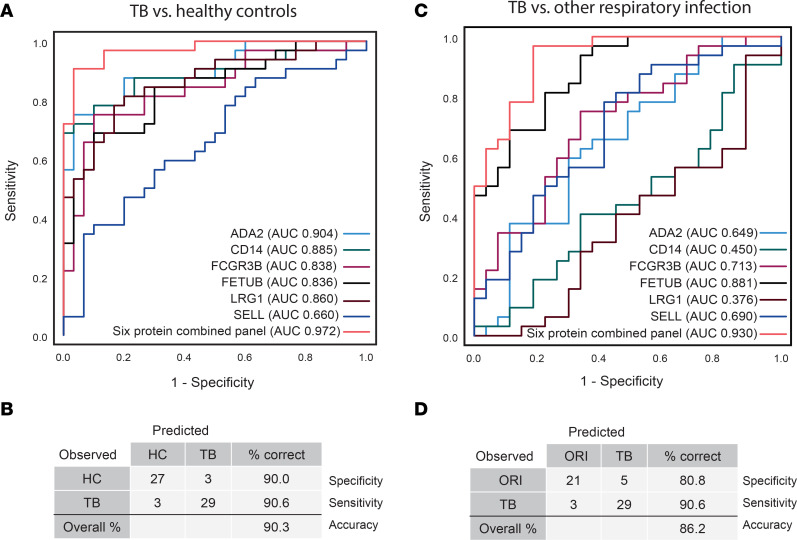
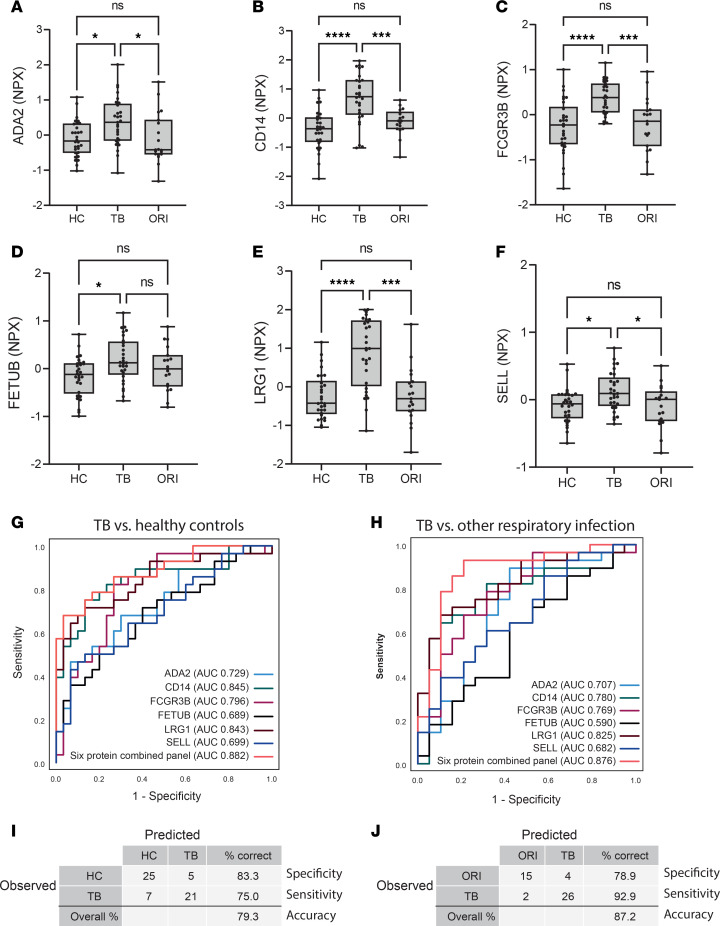
BACKGROUNDNovel biomarkers to identify infectious patients transmitting Mycobacterium tuberculosis are urgently needed to control the global tuberculosis (TB) pandemic. We hypothesized that proteins released into the plasma in active pulmonary TB are clinically useful biomarkers to distinguish TB cases from healthy individuals and patients with other respiratory infections.METHODSWe applied a highly sensitive non-depletion tandem mass spectrometry discovery approach to investigate plasma protein expression in pulmonary TB cases compared to healthy controls in South African and Peruvian cohorts. Bioinformatic analysis using linear modeling and network correlation analyses identified 118 differentially expressed proteins, significant through 3 complementary analytical pipelines. Candidate biomarkers were subsequently analyzed in 2 validation cohorts of differing ethnicity using antibody-based proximity extension assays.RESULTSTB-specific host biomarkers were confirmed. A 6-protein diagnostic panel, comprising FETUB, FCGR3B, LRG1, SELL, CD14, and ADA2, differentiated patients with pulmonary TB from healthy controls and patients with other respiratory infections with high sensitivity and specificity in both cohorts.CONCLUSIONThis biomarker panel exceeds the World Health Organization Target Product Profile specificity criteria for a triage test for TB. The new biomarkers have potential for further development as near-patient TB screening assays, thereby helping to close the case-detection gap that fuels the global pandemic.FUNDINGMedical Research Council (MRC) (MR/R001065/1, MR/S024220/1, MR/P023754/1, and MR/W025728/1); the MRC and the UK Foreign Commonwealth and Development Office; the UK National Institute for Health Research (NIHR); the Wellcome Trust (094000, 203135, and CC2112); Starter Grant for Clinical Lecturers (Academy of Medical Sciences UK); the British Infection Association; the Program for Advanced Research Capacities for AIDS in Peru at Universidad Peruana Cayetano Heredia (D43TW00976301) from the Fogarty International Center at the US NIH; the UK Technology Strategy Board/Innovate UK (101556); the Francis Crick Institute, which receives funding from UKRI-MRC (CC2112); Cancer Research UK (CC2112); and the NIHR Biomedical Research Centre of Imperial College NHS.

Keywords: Diagnostics; Infectious disease; Proteomics; Pulmonology; Tuberculosis.


Figures

Figure 1
Figure 1. Integrated proteomic study design for TB biomarker identification and validation.
(A) Discovery stage comprising sequential orthogonal fractionation of non-depleted plasma at both the protein and peptide level, iTRAQ peptide labeling, and tandem mass spectrometry for protein identification and relative quantification. Complementary bioinformatic analysis approaches (linear modeling, using limma, and WGCNA) were then used to identify and prioritize diagnostic biomarkers by combining outputs of these pipelines. (B) Candidate protein biomarkers were then validated by multiplex antibody-based techniques (Luminex and proximity extension assay) in serum samples from a separate patient cohort of HCs, pulmonary TB, and ORI of mixed sex and ethnicity. High-performing combinatorial panels were identified for key clinical comparisons and diagnostic performance assessed in 2 separate patient cohorts using binary logistic regression and receiver operating characteristic curves. iTRAQ, isobaric tags for relative and absolute quantification; nESI-MS2, nano-electrospray ionization tandem mass spectrometry; limma, linear modeling for microarray data; WGCNA, whole-gene correlation network analysis; PEA, proximity extension assay; NPX, normalized protein expression; TB, tuberculosis; HC, healthy control; ORI, other respiratory infections; ROC, receiver operating characteristic.
Figure 2
Figure 2. Bioinformatic analysis pipeline.
Discovery proteomics experiments were conducted in 12 separate iTRAQ-labeled 8-plex experiments with block randomization of HC and TB samples into 3 experimental sets. Each plasma segment 8-plex experiment included 1 aliquot of a plasma master pool. Grouped protein abundances were calculated across plasma segments for each experimental set to permit analysis over the whole plasma proteome. Protein abundances were then combined by plasma segment and by experimental set and adjusted for experimental batch variation using ComBat. Differential protein expression was analyzed by limma. In parallel, the complete proteome was analyzed by WGCNA to identify protein networks most strongly correlated with TB. Proteins identified as significant by all 3 bioinformatic approaches were then prioritized for validation. iTRAQ, isobaric tags for relative and absolute quantification; ComBat, adjustment for batch effects using an empirical Bayes framework (R package); WGCNA, whole-gene network correlation analysis; limma, linear modeling for microarray data (R package).
Figure 3
Figure 3. Summary data overview by unsupervised analysis.
(A) Clustered heatmap for log2-transformed fully quantified protein abundances (n = 594) shows clear separation of protein abundances between the HC and pulmonary TB groups. iTRAQ tags and clinical groups are indicated. Within HCs, distinct clustering was observed for discovery cohorts of different ethnicity (sample identification: A = South African, P = Peru). This was also observed within the TB group, although some overlap occurred. (B) Principal component analysis (PCA) of log2-transformed protein abundances demonstrates clear separation by clinical group, responsible for 24% of the variance within the data set. HC, healthy control; iTRAQ, isobaric tags for relative and absolute quantification; TB, tuberculosis.
Figure 4
Figure 4. Whole-genome correlation network analysis (WGCNA).
(A) Hierarchical clustering of samples showing discrete clusters by clinical group and absence of clustering by experimental batch. Discrete clustering by cohort ethnicity is again observed in the HC group, but not in TB patients. (B) Protein dendrogram and module colors. Module turquoise, containing 195 proteins, had the strongest correlation with TB (correlation [z] score –0.94, P = 2 × 10⁹). (C) A scatterplot of protein significance by clinical group confirming very high correlation of module turquoise with clinical group (0.95, P = 6 × 10–134). HC, healthy control; TB, tuberculosis.
Figure 5
Figure 5. Complementary bioinformatic analyses identify 118 significantly differentially expressed plasma proteins in TB.
(A) Proteins identified by each bioinformatic approach: 190 from limma analysis of segmental plasma proteomes, 148 by limma analysis of complete plasma proteomes, and 195 proteins within WGCNA module turquoise. One hundred and eighteen proteins were found to be significantly differentially expressed via all 3 analytical approaches. (B) Volcano plot of all 118 significantly differentially expressed proteins by log2(fold change) by limma and correlation (z) score from WGCNA. Markers in the upper outer quadrants have the highest fold changes and strongest correlation to TB. All markers have a P value of less than 0.05 after adjustment for multiple testing within limma. limma, linear modeling for microarray data (R package); WGCNA, whole-genome correlation network analysis.
Figure 6
Figure 6. Divergently regulated proteins link with key biological processes in pulmonary TB.
A chord plot depicting proteins with a log2(fold change) greater than ±0.5 and their links to significantly enriched biological processes in TB. Gene ontology enrichment for biological process was performed using ShinyGO and only significant terms (FDR q ≤ 0.05) are shown. Plot generated with the R package GOplots.
Figure 7
Figure 7. Physiological changes in TB are reflected in the plasma proteome.
Functional enrichment analysis by biological process was performed on the 118 differentially expressed plasma proteins in TB. The gene concept network plot depicts the top 15 most enriched biological processes and their links to divergently regulated proteins. Gene ontology enrichment was performed using ShinyGO and the plot was generated using the cnetplot function in the R package GOplots.
Figure 8
Figure 8. Discovery biomarker candidates validated by proximity extension analysis identify TB-specific biomarkers.
(A) Flow chart outlining the analysis approach to identify significant biomarkers and the best-performing biomarker combinations from our integrated proteomics approach. (BE) Box-and-whisker plots of 4 protein biomarkers significantly differentially expressed in TB compared with both HCs and ORI by proximity extension assay. Boxes show median values and interquartile ranges and whiskers show minimum to maximum values. Statistical differences were calculated using 1-way ANOVA with Tukey’s multiple-comparison test for data with a Gaussian distribution and Kruskal-Willis test with Dunn’s multiple-comparison test for nonparametrically distributed data. NPX, normalized protein expression (log2 scale); AUC, area under the curve; HC, healthy control (n = 30); TB, tuberculosis; (n = 32); ORI, other respiratory infections (n = 26); FCGR3B, low-affinity immunoglobulin receptor 3B; FETUB, fetuin-B; GGH, γ-glutamyl hydrolase; SERPIND1, serpin D1, also known as heparin cofactor 2. NS, P > 0.05; *P ≤ 0.05; **P ≤ 0.01, ***P ≤ 0.001; ****P ≤ 0.0001.
Figure 9
Figure 9. A 5-protein biomarker panel distinguishes pulmonary TB from healthy controls.
(A) Receiver operating characteristic (ROC) curve of the best-performing 5-biomarker combination distinguishing pulmonary TB from HCs, demonstrating an AUC of 0.943 (95% CI: 0.889–1.000). (B) Classification grid illustrating diagnostic performance of the 5-protein biomarker panel in the validation cohort demonstrating a sensitivity of 84.4% (95% CI 67.3%–94.3%), specificity of 93.3% (95% CI: 75.8%–98.8%), and correct classification in 88.7% of cases. (CG) Box-and-whisker plots of the 5 constituent proteins significantly differentially expressed in TB compared with HCs by proximity extension assay. Boxes show median values and interquartile ranges and whiskers show minimum to maximum values. Statistical differences were calculated using 1-way ANOVA with Tukey’s multiple-comparisons test for data with a Gaussian distribution and Kruskal-Willis test with Dunn’s multiple-comparison test for nonparametrically distributed data. NPX, normalized protein expression (log2 scale); AUC, area under the curve; HC, healthy control (n = 30); TB, tuberculosis (n = 32); ORI, other respiratory infection (n = 26); ADA2, adenosine deaminase 2; CD14, monocyte differentiation antigen CD14; LRG1, leucine-rich α-2-glycoprotein; TNFSF13B, tumor necrosis factor ligand superfamily member 13B; vWF, von Willebrand factor. NS, P > 0.05; **P ≤ 0.01, ***P ≤ 0.001; ****P ≤ 0.0001.
Figure 10
Figure 10. A 6-protein biomarker panel distinguishes pulmonary TB from other respiratory infections.
(A) Bubble plot of possible protein combinations within the 14 proteins showing significant differential expression between TB and ORI groups, generated using the CombiROC R package. Dotted lines at 90% sensitivity and 70% specificity corresponding to the WHO Target Product Profile for a triage test for active TB. (B) Receiver operating characteristic (ROC) curve of best-performing biomarker combination and constituent proteins. The 6-protein combined panel AUC = 0.906 (95% CI: 0.83–0.908). (C) Classification grid illustrating diagnostic performance of the 6-protein biomarker panel in the validation cohort demonstrating a sensitivity of 81.3% (95% CI: 63.0%–92.1%), specificity of 76.9% (95% CI: 56.0%–90.2%), and correct classification in 79.3% of cases. (DG) Box-and-whisker plots of protein biomarkers significantly differentially expressed in TB compared with other respiratory infections by proximity extension assay. Box-and-whisker plots of FCGR3B and FETUB are shown in Figure 8. Boxes show mean values and interquartile ranges and whiskers show minimum to maximum values. NPX, normalized protein expression (log2 scale); AUC, area under the curve; HC, healthy control; TB, tuberculosis; ORI, other respiratory infections; CLEC3B, tetranectin; GSN, gelsolin; IGFBP3, insulin-like binding protein 3; SELL, L-selectin; FCGR3B, low-affinity immunoglobulin receptor 3B; FETUB, fetuin-B. NS, P > 0.05; *P ≤ 0.05; **P ≤ 0.01, ****P ≤ 0.0001.
Figure 11
Figure 11. A final combined 6-protein panel discriminates patients with TB from both healthy controls and other respiratory infections.
(A) ROC curve and (B) classification grid of the final 6-protein panel comprising FCGR3B, FETUB, LRG1, ADA2, CD14, and SELL, demonstrating discrimination of patients with TB from healthy controls (AUC 0.972 [95% CI: 0.937–1.000], sensitivity 90.6% [95% CI: 73.8%–97.5%], specificity 90.0% [95% CI: 72.3%–97.4%]). (C) ROC curve and (D) classification grid of the final 6-protein panel discriminating patients with TB from patients with other respiratory infections (AUC 0.930 [95% CI: 0.867–0.993], sensitivity 90.6% [95% CI: 66.5–96.7], specificity 80.8% [95% CI: 68.2–94.5]). All ROC curves and classification grids were generated using SPSS v28.0.1.0 after binary logistic regression for combined proteins. AUC was calculated under nonparametric assumption. TB was set as the positive test outcome and the test direction such that a larger test result indicates a more positive test. ROC, receiver operating characteristic; ADA2, adenosine deaminase 2; CD14, monocyte differentiation antigen; FCGR3B, low-affinity immunoglobulin receptor 3B; FETUB, fetuin-B; LRG1, leucine-rich α-2-glycoprotein; SELL, L-selectin; TB, tuberculosis; HC, healthy control; ORI, other respiratory infections.
Figure 12
Figure 12. The final 6-protein panel differentiates TB from both HC and ORI in a separate clinical cohort.
(AF) Box-and-whisker plots of the 6 proteins in the panel in pulmonary TB compared with HC and ORI by proximity extension assay. Boxes show median values and interquartile ranges and whiskers show minimum to maximum values. Statistical differences were calculated using 1-way ANOVA with Tukey’s multiple-comparison test for data with a Gaussian distribution and Kruskal-Willis test with Dunn’s multiple-comparison test for nonparametrically distributed data. (G) Receiver operating characteristic (ROC) curve of the 6-protein panel distinguishing pulmonary TB from HCs. The 6-protein combined panel AUC = 0.882 (95% CI: 0.796–0.968). Full coordinates in Supplemental Table 16. (H) ROC curve of the 6-protein panel distinguishing pulmonary TB from ORI, AUC = 0.876 (95% CI: 0.765–0.987). Full coordinates in Supplemental Table 17. (I) Classification grid illustrating diagnostic performance of the 6-protein panel distinguishing pulmonary TB from HCs, demonstrating a sensitivity of 75.0% (95% CI: 54.8%–88.6%), specificity of 83.3% (95% CI: 64.5%–93.7%), and correct classification in 79.3% of cases in this cohort. (J) Classification grid illustrating diagnostic performance of the 6-protein panel distinguishing pulmonary TB from other respiratory infection, demonstrating a sensitivity of 92.9% (95% CI: 75.0%–98.8%), specificity of 78.9% (95% CI: 53.9%–93.0%), and correct classification in 87.2% of cases in this cohort. All ROC curves and classification grids were generated using SPSS v28.0.1.0 after binary logistic regression for combined proteins. AUC was calculated under nonparametric assumption. TB was set as the positive test outcome and the test direction such that a larger test result indicates a more positive test. NPX, normalized protein expression (log2 scale); AUC, area under the curve; HC, healthy control (n = 30); TB, tuberculosis (n= 29); ORI, other respiratory infection (n = 19); ADA2, adenosine deaminase 2; CD14, monocyte differentiation antigen CD14; LRG1, leucine-rich α-2-glycoprotein; TNFSF13B, tumor necrosis factor ligand superfamily member 13B; vWF, von Willebrand factor. NS, P > 0.05; *P ≤ 0.05; ***P ≤ 0.001; ****P ≤ 0.0001.

References

    1. WHO. Global Tuberculosis Report 2022. https://www.who.int/teams/global-tuberculosis-programme/tb-reports/globa... Accessed March 19, 2024.
    1. Pai M, et al. Covid-19’s devastating effect on tuberculosis care - a path to recovery. N Engl J Med. 2022;386(16):1490–1493. doi: 10.1056/NEJMp2118145. - DOI - PubMed
    1. Pai M, et al. Transforming tuberculosis diagnosis. Nat Microbiol. 2023;8(5):756–759. doi: 10.1038/s41564-023-01365-3. - DOI - PubMed
    1. Cheng S, et al. Effect of diagnostic and treatment delay on the risk of tuberculosis transmission in Shenzhen, China: an observational cohort study, 1993-2010. PLoS One. 2013;8(6):e67516. doi: 10.1371/journal.pone.0067516. - DOI - PMC - PubMed
    1. Dale KD, et al. Quantifying the rates of late reactivation tuberculosis: a systematic review. Lancet Infect Dis. 2021;21(10):e303–e317. doi: 10.1016/S1473-3099(20)30728-3. - DOI - PubMed

Publication types