. 2024 Aug;38(4):847-858.
doi: 10.1007/s10877-024-01150-5. Epub 2024 Mar 21.

Estimation of the transpulmonary pressure from the central venous pressure in mechanically ventilated patients

Affiliations

Estimation of the transpulmonary pressure from the central venous pressure in mechanically ventilated patients

Federico Franchi et al. J Clin Monit Comput. 2024 Aug.

Abstract

Transpulmonary pressure (PL) calculation requires esophageal pressure (PES) as a surrogate of pleural pressure (Ppl), but its calibration is a cumbersome technique. Central venous pressure (CVP) swings may reflect tidal variations in Ppl and could be used instead of PES, but the interpretation of CVP waveforms could be difficult due to superposition of heartbeat-induced pressure changes. Thus, we developed a digital filter able to remove the cardiac noise to obtain a filtered CVP (f-CVP). The aim of the study was to evaluate the accuracy of CVP and filtered CVP swings (ΔCVP and Δf-CVP, respectively) in estimating esophageal respiratory swings (ΔPES) and compare PL calculated with CVP, f-CVP and PES; then we tested the diagnostic accuracy of the f-CVP method to identify unsafe high PL levels, defined as PL>10 cmH2O. Twenty patients with acute respiratory failure (defined as PaO2/FiO2 ratio below 200 mmHg) treated with invasive mechanical ventilation and monitored with an esophageal balloon and central venous catheter were enrolled prospectively. For each patient a recording session at baseline was performed, repeated if a modification in ventilatory settings occurred. PES, CVP and airway pressure during an end-inspiratory and -expiratory pause were simultaneously recorded; CVP, f-CVP and PES waveforms were analyzed off-line and used to calculate transpulmonary pressure (PLCVP, PLf-CVP, PLPES, respectively). Δf-CVP correlated better than ΔCVP with ΔPES (r = 0.8, p = 0.001 vs. r = 0.08, p = 0.73), with a lower bias in Bland Altman analysis in favor of PLf-CVP (mean bias - 0.16, Limits of Agreement (LoA) -1.31, 0.98 cmH2O vs. mean bias - 0.79, LoA - 3.14, 1.55 cmH2O). Both PLf-CVP and PLCVP correlated well with PLPES (r = 0.98, p < 0.001 vs. r = 0.94, p < 0.001), again with a lower bias in Bland Altman analysis in favor of PLf-CVP (0.15, LoA - 0.95, 1.26 cmH2O vs. 0.80, LoA - 1.51, 3.12, cmH2O). PLf-CVP discriminated high PL value with an area under the receiver operating characteristic curve 0.99 (standard deviation, SD, 0.02) (AUC difference = 0.01 [-0.024; 0.05], p = 0.48). In mechanically ventilated patients with acute respiratory failure, the digital filtered CVP estimated ΔPES and PL obtained from digital filtered CVP represented a reliable value of standard PL measured with the esophageal method and could identify patients with non-protective ventilation settings.

Keywords: ARDS; Central venous pressure; Digital filtering analysis; Esophageal pressure; Mechanical ventilation; Pleural pressure; Respiratory failure; Transpulmonary pressure.


Conflict of interest statement

The authors declare no competing interests.

Figures

Fig. 1
Fig. 1
A showed the CVP curve (in green) and PES curve (in blue). ΔCVP and ΔPES were calculated as differences between values obtained during end-inspiratory and end-expiratory pauses. For each pause, CVP values were identified at the base of the “c” wave (the dotted horizontal line in CVP wave), while for PES positive peak values were considered (the dotted horizontal line in Pes wave). The double headed arrows in the CVP and PES curves identified the magnitude of ΔCVP and ΔPES, respectively. In the red boxes the inspiratory and expiratory pauses were enlarged to appreciate the marker location. X axis, time as seconds (s); y axis, amplitude in cmH2O. B displayed the same curves in Fig. 1A with the addition of f-CVP curve (in black). Δf-CVP was calculated as differences between values obtained during end-inspiratory and end-expiratory pauses. For each pause, f-CVP values were identified at the plateau level (the dotted horizontal line in f-CVP wave). The double headed arrow in the f-CVP curve identified the magnitude of Δf-CVP. In the red boxes the inspiratory and expiratory pauses were enlarged to appreciate the marker location. X axis, time as seconds (s); y axis, amplitude in cmH2O
Fig. 2
Fig. 2
Correlation between Δf-CVP and ΔPES. Δf-CVP, respiratory changes in filtered central venous pressure; ΔPES, respiratory changes in esophageal pressure. Solid line, linear regression line
Fig. 3
Fig. 3
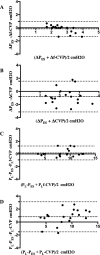
Bland-Altman analysis for the agreement between Δf-CVP and ΔPEs, and between ΔCVP and ΔPES, box A and B, respectively. Bland-Altman analysis for the agreement between PLf-CVP and PLPES, and between PLCVP and PLPES, box C and D, respectively. Broken lines, bias; dotted lines, ± 1.96 SD of the bias. ΔCVP, respiratory changes in central venous pressure; Δf-CVP, respiratory changes in filtered central venous pressure; ΔPES, respiratory changes in esophageal pressure; PLf-CVP, transpulmonary pressure obtained using f-CVP; PLPES, transpulmonary pressure obtained using esophageal pressure; PLCVP, transpulmonary pressure obtained using CVP
Fig. 4
Fig. 4
Correlation between PLf-CVP and PES. PLf-CVP, transpulmonary pressure calculated with filtered central venous pressure; PES, transpulmonary pressure calculated with esophageal pressure. Solid line, linear regression line
Fig. 5
Fig. 5
Four-quadrant trend plot of changes of PLPES and PLf-CVP from baseline to second measurements. Four-quadrant trend plot representing the relationship between changes (∆) in transpulmonary pressure (PL) estimated by esophageal pressure (∆PLPES) and filtered central venous pressure (∆PLf-CVP). ∆ was calculated by subtracting the first PL (baseline) from the second (after an adjustment in ventilator setting). Twelve ∆PL pairs of measurements were considered because four were excluded from the analysis as at least one ∆PL value was zero. Solid line, line of regression

References

    1. Bellani G, Laffey JG, Pham T, et al. Epidemiology, patterns of care, and mortality for patients with acute respiratory distress syndrome in intensive care units in 50 countries. JAMA. 2016;315:788–800. 10.1001/jama.2016.0291 - DOI - PubMed
    1. Fan E, Del Sorbo L, Goligher EC, Hodgson CL, Munshi L, Walkey AJ, Adhikari NKJ, Amato MBP, Branson R, Brower RG, Ferguson ND, Gajic O, Gattinoni L, Hess D, Mancebo J, Meade MO, McAuley DF, Pesenti A, Ranieri VM, Rubenfeld GD, Rubin E, Seckel M, Slutsky AS, Talmor D, Thompson BT, Wunsch H, Uleryk E, Brozek J, Brochard LJ. American Thoracic Society, European Society of Intensive Care Medicine, and Society of Critical Care Medicine. An Official American Thoracic Society/European Society of Intensive Care Medicine/Society of Critical Care Medicine Clinical Practice Guideline (2017) Mechanical Ventilation in Adult Patients with Acute Respiratory Distress Syndrome. Am J Respir Crit Care Med 195(9):1253–1263. - PubMed
    1. Terragni PP, Rosboch G, Tealdi A, Corno E, Menaldo E, Davini O, Gandini G, Herrmann P, Mascia L, Quintel M, et al. Tidal hyperinflation during low tidal volume ventilation in acute respiratory distress syndrome. Am J Respir Crit Care Med. 2007;175(2):160–6. 10.1164/rccm.200607-915OC - DOI - PubMed
    1. Bellani G, Guerra L, Musch G, Zanella A, Patroniti N, Mauri T, Messa C, Pesenti A. Lung regional metabolic activity and gas volume changes induced by tidal ventilation in patients with acute lung injury. Am J Respir Crit Care Med. 2011;183(9):1193–9. 10.1164/rccm.201008-1318OC - DOI - PMC - PubMed
    1. Talmor D, Sarge T, Malhotra A, O’Donnell CR, Ritz R, Lisbon A, Novack V, Loring SH. Mechanical ventilation guided by esophageal pressure in acute lung injury. N Engl J Med. 2008;359(20):2095–104. 10.1056/NEJMoa0708638 - DOI - PMC - PubMed

LinkOut - more resources