. 2024 Mar 21;134(10):e166795.
doi: 10.1172/JCI166795.

Excess glucocorticoids inhibit murine bone turnover via modulating the immunometabolism of the skeletal microenvironment

Affiliations

Excess glucocorticoids inhibit murine bone turnover via modulating the immunometabolism of the skeletal microenvironment

Xu Li et al. J Clin Invest. .

Abstract

Elevated bone resorption and diminished bone formation have been recognized as the primary features of glucocorticoid-associated skeletal disorders. However, the direct effects of excess glucocorticoids on bone turnover remain unclear. Here, we explored the outcomes of exogenous glucocorticoid treatment on bone loss and delayed fracture healing in mice and found that reduced bone turnover was a dominant feature, resulting in a net loss of bone mass. The primary effect of glucocorticoids on osteogenic differentiation was not inhibitory; instead, they cooperated with macrophages to facilitate osteogenesis. Impaired local nutrient status - notably, obstructed fatty acid transportation - was a key factor contributing to glucocorticoid-induced impairment of bone turnover in vivo. Furthermore, fatty acid oxidation in macrophages fueled the ability of glucocorticoid-liganded receptors to enter the nucleus and then promoted the expression of BMP2, a key cytokine that facilitates osteogenesis. Metabolic reprogramming by localized fatty acid delivery partly rescued glucocorticoid-induced pathology by restoring a healthier immune-metabolic milieu. These data provide insights into the multifactorial metabolic mechanisms by which glucocorticoids generate skeletal disorders, thus suggesting possible therapeutic avenues.

Keywords: Bone biology; Bone disease; Fatty acid oxidation; Osteoporosis.


Conflict of interest statement

Conflict of interest: The authors have declared that no conflict of interest exists.

Figures

Figure 1
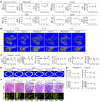
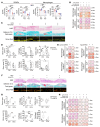
Figure 1. Excess GC induces rapid trabecular bone loss in male mice.
(AF) Bone phenotypes of mice treated with placebo (Placebo-H) or high-dose (6.25 mg/kg/d) prednisolone (GCs-H). (A) Bone mass and soft tissue weight of the body, tibia, spine, and femur as measured by dual-energy x-ray absorptiometry (n = 3–7 per time point). BMC, bone mineral content; BMD, bone mineral density. (B and C) Representative micro-CT images (B) and quantification (C) of bone volume fraction (BV/TV), bone mineral density (BMD), trabecular thickness (Tb.Th), trabecular separation (Tb.Sp), trabecular number (Tb.N), and bone volume (BV) in trabecula (n = 4–8 per time point; scale bar: 500 μm). (D and E) Representative micro-CT images (D) and quantification (E) of the periosteal envelope (Tt.Ar), cortical bone area (Ct.Ar), cortical area fraction (Ct.Ar/Tt.Ar), and average cortical thickness (Ct.Th) in cortical bone (n = 5 per time point; scale bar: 500 μm). (F) Representative H&E (scale bar: 500 μm) and sirius red (scale bar: 50 μm) staining of tibia. Data are mean ± SD. *P < 0.05, **P < 0.01 by 2-way ANOVA (A, C, and E) with Bonferroni’s post hoc test.
Figure 2
Figure 2. GC-induced bone loss coincides with reduced bone turnover.
(A and B) Representative images of calcein/xylenol double labeling (A) and assessment of bone remodeling (B) (n = 4–5; scale bar: 500 μm). (C and D) Representative Goldner trichrome staining (C) (scale bar: 50 μm) and quantification of the number of osteoblasts per trabecular area (N.Ob/T.Ar), number of osteoblasts per bone perimeter (N.Ob/B.Pm), number of osteoclasts per trabecular area (N.Oc/T.Ar), and number of osteoclasts per trabecular area (N.Oc/B.Pm) (D) (n = 5). (E) Serum concentration of PINP and CTX1 in the circulation (n = 5–7 per time point). (F and G) Ex vivo osteogenic induction, transcription levels (F, at day 3, n = 3), and alkaline phosphatase (ALP) staining (G, at day 5, n = 4) of bone surface adherent cells. (H and I) Ex vivo osteoclastogenic induction, transcription levels (H, at day 3, n = 3), and TRAP staining (I, at day 5, n = 4) of bone surface cells (scale bar: 50 μm). Data are mean ± SD. *P < 0.05, ***P < 0.001 by 2-way ANOVA (B, D, and E) with Bonferroni’s post hoc test or 2-tailed Student’s t test (G and I).
Figure 3
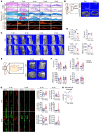
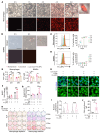
Figure 3. GCs inhibit callus formation and delay fracture healing.
(A) Representative H&E, Safranin O and fast green, and sirius red staining of callus (scale bars: 1 mm). (B) Representative micro-CT images in callus (scale bar: 500 μm). (C and D) Representative micro-CT images (C) and quantification (D) of BV, total volume (TV), BV/TV, and BMD in distal end calluses (n = 5; scale bar: 500 μm) at week 2 post-fracture. (E and F) Representative micro-CT images (E) and quantification (F) of BV, TV, BV/TV, and BMD (n = 7–9 per time point; scale bar: 500 μm) in calluses of weeks 4 and 8 post-fracture. (G) Representative images of calcein/xylenol double labeling and assessment of bone remodeling (n = 6–8 per time point; scale bar: 200 μm). (H) Mechanical strength of femora at week 4 (n = 7). Data are mean ± SD. *P < 0.05, **P < 0.01 by 2-tailed Student’s t test (D, G, and H) or 2-way ANOVA (F) with Bonferroni’s post hoc test.
Figure 4
Figure 4. GCs impede bone formation and resorption during the rapid phase of callus formation.
(A) Representative immunofluorescence images of Sp7 (scale bar: 50 μm) and quantification of positive region (n = 6–7). (B) Representative TRAP staining images (scale bar: 100 μm) and quantification of positive region (n = 6–12 per time point). (C) Representative Goldner trichrome from weeks 4 and 8 post-fracture calluses (scale bar: 50 μm). (D) TRAP staining from weeks 4 and 8 post-fracture calluses (scale bar: 50 μm) and quantification of positive region (n = 6 per time point). (E and F) Ex vivo osteogenic induction, transcription levels (E, at day 3, n = 3), and representative ALP staining images (F, at day 5, n = 4) of week 2 callus cells. (G and H) Ex vivo osteoclastogenic induction, transcription levels (G, at day 3, n = 3), and representative TRAP staining images (H, at day 5, n = 4) of week 2 callus cells (scale bar: 50 μm). Ctrl, placebo group; GCs, prednisolone-treated group. Data are mean ± SD. *P < 0.05, **P < 0.01, ***P < 0.001 by 2-tailed Student’s t test (A, F, and H) or 2-way ANOVA (B and D) with Bonferroni’s post hoc test.
Figure 5
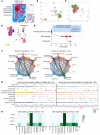
Figure 5. Intercellular communications of the macrophage-associated immune milieu within the callus.
(A) Representative histological characterization of F4/80-positive macrophage pool within the callus (scale bar: 500 μm). (BH) Single-cell RNA sequencing analysis of cell populations and communications. (B and C) RNA velocity field onto the t-distributed stochastic neighbor embedding plot of hematopoietic cells (B) and osteolineage (C). (D) Pseudotime ordering of hematopoietic and bone formatting cell lineages. (E) Pseudotime ordering of hematopoietic stem cells, macrophages, and osteoclasts. (F) Interaction patterns of callus cells (classified by numbers). (G) Incoming communication patterns of target cells. (H) CSF signaling pathway network of callus cells. Ctrl, placebo group; GCs, prednisolone-treated group.
Figure 6
Figure 6. GCs alter the macrophage-associated immune milieu to affect bone formation.
(A) Violin plots of normalized expression of Csf1r and Csf1 in the callus. (B and C) Representative micrographs (B) and quantifications (C) of DiI-labeled macrophages (red) with the coculture of BSMPs or Csf1 siRNA–transfected BSMPs (scale bar: 50 μm). (D) Supernatant concentration of Csf1 from BSMPs or Csf1 siRNA–transfected BSMPs (n = 3). (E and F) Representative micro-CT images (E) and quantification (F) of BMD, BV/TV, and BV in the callus with or without macrophage depletion (n = 6; scale bar: 500 μm). DT, diphtheria toxin. (G and H) Representative H&E, Safranin O and fast green, and sirius red staining (G) and quantification (H) of week 2 calluses with or without macrophage depletion in CD11b-DTR mice (n = 5–7; scale bar: 1 mm). Data are mean ± SD. *P < 0.05, **P < 0.01, ***P < 0.001 by 2-tailed Student’s t test (C) or 1-way ANOVA (C and D) or 2-way ANOVA (F and H) with Bonferroni’s post hoc test.
Figure 7
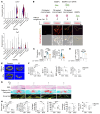
Figure 7. Reduced fatty acid metabolism inhibits bone formation.
(A) Extracellular acidification rate (ECAR) and oxygen consumption rate (OCR) tracings from BSMPs and macrophages under normal-serum (10% FBS) or low-serum (1%) culture condition (n = 6–8). (B) Osteogenic differentiation of BSMPs (with or without macrophage addition) exposed to control or different nutritional stresses, assessed by ALP or ARS staining. (C and D) Representative H&E, Safranin O and fast green, and sirius red staining (C) and quantification (D) of week 2 calluses with or without depletion of Cpt1a (through tamoxifen) in Ubc-Cre-ERT2 Cpt1afl/fl mice (n = 5–7; scale bar: 1 mm). (E) Representative ALP or ARS staining images of BSMPs (with or without macrophage addition) transfected with vehicle, Cpt1a shRNA, or Atgl shRNA during osteogenic differentiation. (F and G) Representative H&E, Safranin O and fast green, and sirius red staining (F) and quantification (G) of week 2 calluses with or without local injection of fatty acids (FA) in wild-type mice (n = 5–6; scale bar: 1 mm). (H) Representative ALP or ARS staining images of BSMPs (with or without addition of macrophages) exposed to normal-serum or low-serum condition, with or without the addition of fatty acids (oleate acid and palmitate acid) during osteogenic differentiation. Data are mean ± SD. *P < 0.05, **P < 0.01, ***P < 0.001 by 2-way ANOVA (A, D, and G) with Bonferroni’s post hoc test.
Figure 8
Figure 8. Macrophages uptake fatty acid more rapidly than bone-forming cells.
(A and C) Real-time ATP production assays of BSMPs (A) and macrophages (C) with or without Dex exposure (n = 6–8). (B and D) Cellular substrate oxidation measurement in BSMPs (B) and macrophages (D) transfected with vehicle (Ctrl), Mpc1 shRNA, Gls shRNA, or Cpt1a shRNA (n = 4–6). (E) Violin plots of normalized expression of Cd36. (F) Gene expression of Cd36 on BSMPs and macrophages in culture (n = 3). (G and H) Flow cytometry assessment of Cd36 expression on BSMPs (G) and macrophages (H) treated under the culture of different serum conditions (n = 3). (I and J) Flow cytometry assessment of fatty acid (Red C12) uptake by BSMPs (I) (n = 3) and macrophages (J) (n = 3). (K and L) Flow cytometry assessment of glucose (2-NBDG) uptake by BSMPs (K) and macrophages (L) (n = 3). (M) Uptake patterns of glucose and fatty acids by BSMPs and macrophages in normal- and low-serum conditions, quantified by flow cytometry. (N) Intracellular ATP in BSMPs and macrophages, exposed to normal-serum or low-serum condition, with or without the addition of fatty acids (oleate acid and palmitate acid) (n = 5). Dex, 10–6 M dexamethasone. Data are mean ± SD. *P < 0.05, **P < 0.01, ***P < 0.001 by 1-way ANOVA (B and D) or 2-way ANOVA (A, C, E, F, HL, and N) with Bonferroni’s post hoc test.
Figure 9
Figure 9. Fatty acids fuel macrophages to promote osteogenesis.
(A) Mitochondrial content in macrophages under different culture conditions, as measured by MitoTracker Green (Thermo Fisher Scientific) (n = 3). (B) BMP2 production from macrophages exposed to palmitic acid and/or oleic acid (n = 3). (CE) Representative images of macrophages stained for GR and quantification of nuclear localization (n = 100; scale bars: 50 μm). (C) Cells were transfected with vehicle or Cpt1a shRNA (n = 100). (D) Cells were treated with SSO (n = 100). (E) Cells were treated with palmitic acid and/or oleic acid (n = 100). (FH) Occupancy of GR at the BMP2 promoter of macrophages exposed to different culture conditions. (F) Cells were transfected with Cpt1a shRNA (n = 4). (G) Cells were treated with SSO (n = 3). (H) Cells were treated with palmitic acid and/or oleic acid (n = 3). (I) ALP (at day 5) and ARS (at day 10) staining of BSMPs cultured with supernatants from low serum– and H-Dex–pretreated macrophages with the addition of palmitic acid, SSO, and/or BMP2 siRNA. Low serum, 1% FBS culture condition; Dex, 10–6 M dexamethasone. Data are mean ± SD. *P < 0.05, **P < 0.01, ***P < 0.001 by 2-way ANOVA (A, B, and E), 1-way ANOVA (C, D, F, and G) with Bonferroni’s post hoc test, or 2-tailed Student’s t test (H).
Figure 10
Figure 10. The fabricated fatty acid–containing nanoparticles reprogram macrophage metabolism.
(A and B) Representative microscopy of FA-LNP (red) uptake by macrophages (A) or BSMPs (B) at specific time points (scale bars: 100 μm). (C and D) Flow cytometry quantification of FA-LNP uptake by macrophages (C) or BSMPs (D) (n = 3). (E) Intracellular ATP in macrophages and BSMPs, exposed to normal-serum or low-serum condition, with or without the addition of FA-LNPs (n = 5–6). (F) Under low-serum condition (1% FBS), transcription levels of BMP2 in macrophages exposed to Dex and/or FA-LNPs (n = 3). (G) Under low-serum condition (1% FBS), BMP2 production from macrophages exposed to Dex and/or FA-LNPs (n = 3) with transfection of vehicle or Cpt1a shRNA. (H and I) Representative microscopy of macrophages (after exposure to different serum conditions, Dex, and/or FA-LNPs) stained for GR (H) and quantification of nuclear localization (I) (n = 100). Scale bar: 50 μm. (J) Occupancy of GR at the BMP2 promoter of macrophages (after exposure to low-serum conditions, H-Dex, and/or FA-LNPs) (n = 3). (K) Osteogenic differentiation of BSMPs (with or without addition of macrophages) exposed to normal-serum or low-serum condition, with or without the addition of FA-LNPs, assessed by ALP or ARS staining. Dex, 10–6 M dexamethasone. *P < 0.05, **P < 0.01, ***P < 0.001 by 2-way ANOVA (EG and I) with Bonferroni’s post hoc test or 2-tailed Student’s t test (J).
Figure 11
Figure 11. Macrophage-targeted metabolic reprogramming improves healing in the GC-associated fracture model.
(A) Distribution of FA-LNPs (red) in week 2 callus revealed by red fluorescence (n = 5–8; scale bar: 50 μm). (B) Representative micro-CT images and quantification (distal ends) of BMD, BV/TV, and BV in the callus from mice treated with vehicle control (Ctrl) or 6.25 mg/kg/d of prednisolone (GCs) with or without FA-LNPs (n = 5–8; scale bar: 500 μm). (C) Representative H&E, Safranin O and fast green, and sirius red staining and quantification of callus at week 2 from mice with or without FA-LNPs (n = 5–8; scale bar: 1 mm). Data are mean ± SD. *P < 0.05, **P < 0.01, ***P < 0.001 by 2-way ANOVA (B and C) with Bonferroni’s post hoc test.
Figure 12
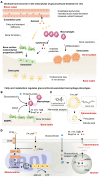
Figure 12. Schematic overview of the main findings.
(A) Excess GC levels cause rapid bone loss and delayed fracture healing. The main feature is reduced bone turnover. Disruption of vascularization impairs fatty acid delivery, leading to a simultaneous decrease in bone formation and resorption, but with a net bone loss. (B) Bone formation–associated macrophages are more likely to take up exogenous fatty acids. Fatty acid oxidation regulates the secretory phenotypes of M2c macrophages and promotes osteogenesis. (C) We developed a macrophage-targeted fatty acid delivery system (FA-LNPs) to increase delivery efficiency while reducing the frequency of local injections. (D) After entering the cytoplasm of the macrophage, fatty acids participate in mitochondrial oxidative phosphorylation, which fuels GC receptors and drives them into the nucleus to regulate the production of cytokines.

References

    1. Cain DW, Cidlowski JA. Immune regulation by glucocorticoids. Nat Rev Immunol. 2017;17(4):233–247. doi: 10.1038/nri.2017.1. - DOI - PMC - PubMed
    1. Sinha S, et al. Dexamethasone modulates immature neutrophils and interferon programming in severe COVID-19. Nat Med. 2022;28(1):201–211. doi: 10.1038/s41591-021-01576-3. - DOI - PMC - PubMed
    1. Horby P, et al. Dexamethasone in hospitalized patients with Covid-19. N Engl J Med. 2021;384(8):693–704. doi: 10.1056/NEJMoa2021436. - DOI - PMC - PubMed
    1. Li W, et al. General recommendation for assessment and management on the risk of glucocorticoid-induced osteonecrosis in patients with COVID-19. J Orthop Translat. 2021;31:1–9. doi: 10.1016/j.jot.2021.09.005. - DOI - PMC - PubMed
    1. Salamone IM, et al. Intermittent glucocorticoid treatment enhances skeletal muscle performance through sexually dimorphic mechanisms. J Clin Invest. 2022;132(6):e149828. doi: 10.1172/JCI149828. - DOI - PMC - PubMed

MeSH terms