. 2024 Jun;67(6):1079-1094.
doi: 10.1007/s00125-024-06123-6. Epub 2024 Mar 21.

Differential CpG methylation at Nnat in the early establishment of beta cell heterogeneity

Affiliations

Differential CpG methylation at Nnat in the early establishment of beta cell heterogeneity

Vanessa Yu et al. Diabetologia. 2024 Jun.

Abstract

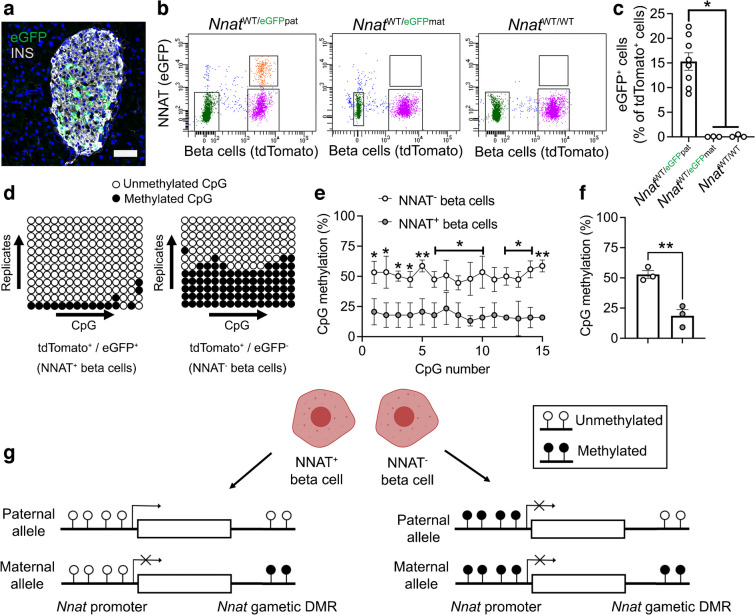
Aims/hypothesis: Beta cells within the pancreatic islet represent a heterogenous population wherein individual sub-groups of cells make distinct contributions to the overall control of insulin secretion. These include a subpopulation of highly connected 'hub' cells, important for the propagation of intercellular Ca2+ waves. Functional subpopulations have also been demonstrated in human beta cells, with an altered subtype distribution apparent in type 2 diabetes. At present, the molecular mechanisms through which beta cell hierarchy is established are poorly understood. Changes at the level of the epigenome provide one such possibility, which we explore here by focusing on the imprinted gene Nnat (encoding neuronatin [NNAT]), which is required for normal insulin synthesis and secretion.

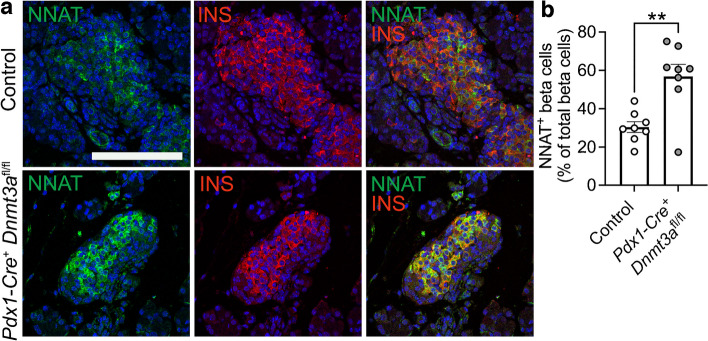
Methods: Single-cell RNA-seq datasets were examined using Seurat 4.0 and ClusterProfiler running under R. Transgenic mice expressing enhanced GFP under the control of the Nnat enhancer/promoter regions were generated for FACS of beta cells and downstream analysis of CpG methylation by bisulphite sequencing and RNA-seq, respectively. Animals deleted for the de novo methyltransferase DNA methyltransferase 3 alpha (DNMT3A) from the pancreatic progenitor stage were used to explore control of promoter methylation. Proteomics was performed using affinity purification mass spectrometry and Ca2+ dynamics explored by rapid confocal imaging of Cal-520 AM and Cal-590 AM. Insulin secretion was measured using homogeneous time-resolved fluorescence imaging.

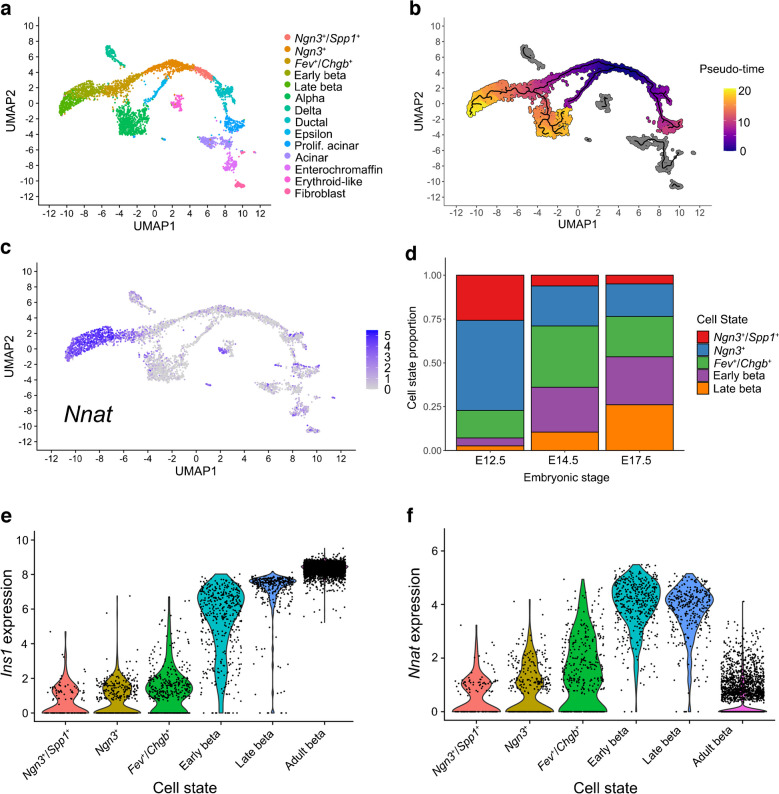
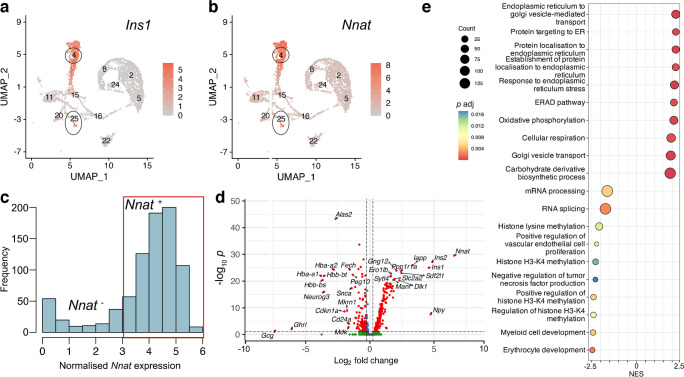
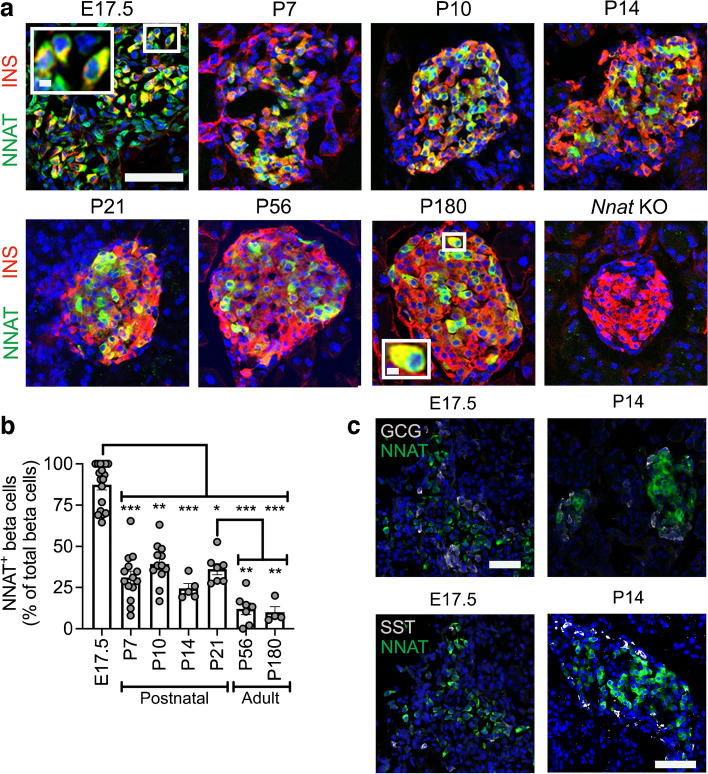
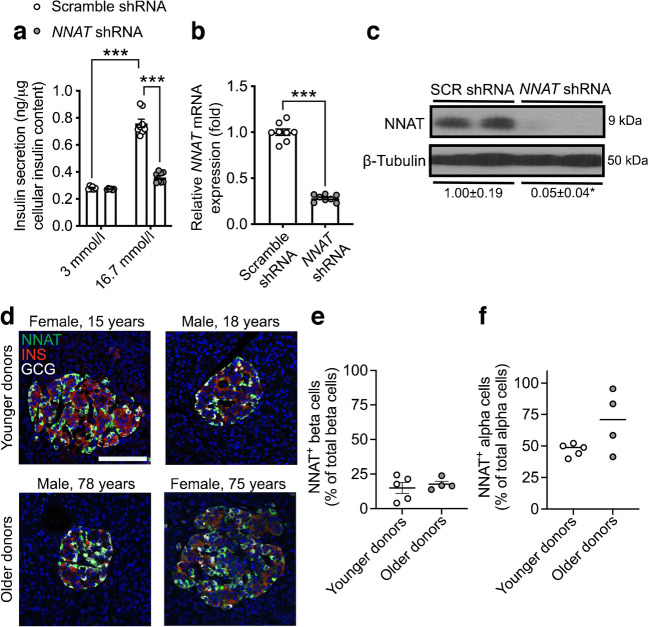
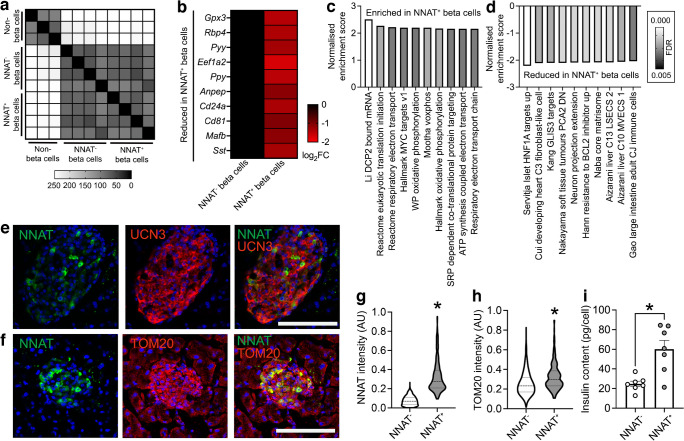
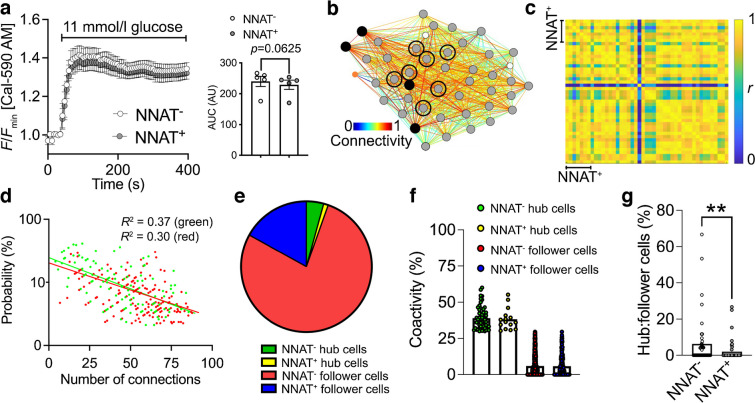
Results: Nnat mRNA was differentially expressed in a discrete beta cell population in a developmental stage- and DNA methylation (DNMT3A)-dependent manner. Thus, pseudo-time analysis of embryonic datasets demonstrated the early establishment of Nnat-positive and -negative subpopulations during embryogenesis. NNAT expression is also restricted to a subset of beta cells across the human islet that is maintained throughout adult life. NNAT+ beta cells also displayed a discrete transcriptome at adult stages, representing a subpopulation specialised for insulin production, and were diminished in db/db mice. 'Hub' cells were less abundant in the NNAT+ population, consistent with epigenetic control of this functional specialisation.

Conclusions/interpretation: These findings demonstrate that differential DNA methylation at Nnat represents a novel means through which beta cell heterogeneity is established during development. We therefore hypothesise that changes in methylation at this locus may contribute to a loss of beta cell hierarchy and connectivity, potentially contributing to defective insulin secretion in some forms of diabetes.

Data availability: The mass spectrometry proteomics data have been deposited to the ProteomeXchange Consortium via the PRIDE partner repository with the dataset identifier PXD048465.

Keywords: Beta cell development; Ca2+; Connectivity; CpG methylation; Heterogeneity; Identity; Imprinted genes; Insulin; Islet; Neuronatin; Type 2 diabetes.


Figures

Fig. 1
Fig. 1
Nnat expression is a marker for late-stage beta cell differentiation during islet development. (ac) UMAP projection of scRNA-seq data from embryonic mouse islets (E12.5–E17.5), with cells labelled by their cellular state (a), pseudo-time (scale bar represents abstract unit of time) (b) and corresponding Nnat expression (log-normalised expression level) (c). (d) Changes in the distribution of beta cell precursors from E12.5 to E17.5. (e, f) Violin plots showing the fluctuations in Ins1 (e) and Nnat (f) expression (both log-normalised expression level) from E12.5 to adulthood in the beta cell development trajectory. Prolif., proliferating; UMAP, uniform manifold approximation and projection
Fig. 2
Fig. 2
Transcriptomic analyses of islet cells at E17.5 reveal Nnat+ cells to be a more differentiated beta cell subcluster. (a, b) Islet cells plotted in the UMAP space and coloured by Ins1 (a) and Nnat (b) expression, respectively. Individual cellular clusters are labelled. Beta cell clusters are highlighted with black circles. (c) Distribution of Nnat expression among beta cell clusters, along with the expression range used in defining Nnat+ beta cells (highlighted by the red rectangle). (d) Volcano plot showing the log2 fold change in gene expression between Nnat+ and Nnat beta cells against FDR-corrected p values. Genes with FDR<0.1 are coloured red. Top ten upregulated and downregulated genes are labelled by gene name. (e) GSEA of differentially expressed genes between Nnat+ and Nnat beta cells (using gene ontology-biological process [GO-BP] terms), showing the top ten upregulated and downregulated processes. The normalised enrichment score (NES) is plotted along the x-axis. Circle diameters are proportional to the number of genes in each process, with the colours defining statistical significance. UMAP, uniform manifold approximation and projection
Fig. 3
Fig. 3
A subpopulation of NNAT+ beta cells develops during the early postnatal period in mice. (a) Representative confocal microscopy of pancreatic cryosections from wild-type mice on a C57BL/6J background of developmental stages from E17.5 through the postnatal period into adulthood. Sections were immunostained with antibodies against endogenous NNAT (green) and insulin (INS, red). Nuclei are visualised with DAPI and sections from P56 mice with constituent deletion of Nnat were used as an immunostaining control. Scale bar, 100 μm (inset, 10 μm). (b) Quantification of NNAT+ beta cells from images shown in (a), expressed as NNAT/INS co-positive cells as a percentage of total INS-positive cells (n=4–15 mice per timepoint, Kruskal–Wallis test with Dunn’s multiple comparisons). (c) Representative confocal microscopy of pancreatic cryosections as in (a) from E17.5 and P14 mice (n=18 and n=5 mice, respectively) immunostained with antibodies against endogenous NNAT (green) and GCG or SST (both grey). Scale bar, 100 μm. Representative images from three independent experiments and breeding pairs. *p<0.05, **p<0.01, ***p<0.001. GCG, glucagon; KO, knockout; SST, somatostatin
Fig. 4
Fig. 4
NNAT is expressed in a subset of human beta cells and NNAT deficiency in human beta cells reduces insulin secretion. (a) GSIS analysis at low (3 mmol/l) and high (16.7 mmol/l) glucose in human EndoC-βH1 beta cells following 72 h of lentiviral-mediated shRNA knockdown of NNAT with data expressed as insulin secreted into culture media as a percentage of total cellular insulin content (n=8 independent cultures per group, two-way ANOVA with Sidak’s multiple corrections test). (b, c) RT-PCR (n=8, unpaired Student’s t test) and western blot (n=4, Mann–Whitney U test) analysis of NNAT expression in EndoC-βH1 beta cells after transient NNAT silencing as in (a). (c) Western blotting analysis of NNAT protein levels shown via a representative blot of two independent experiments. β-Tubulin was used as a loading control. Mean values for band intensities in multiple experiments quantified by densitometry are shown below the panel, expressed relative to scramble (SCR) shRNA controls. (d) Representative confocal microscopy of human pancreatic cryosections from younger (15.6±0.9 years, n=5) and older (71.0±3.9 years, n=4) donors. Sections were immunostained with antibodies against endogenous NNAT (green), insulin (INS, red) and glucagon (GCG, grey). Donor sex and age are indicated in the text. Nuclei are visualised with DAPI. Scale bar, 100 μm. (e, f) Quantification of NNAT+ beta (e) and alpha (f) cells from images shown in (d), expressed as NNAT/INS or NNAT/GCG co-positive cells as a percentage of total INS-positive or GCG-positive cells. *p<0.05, ***p<0.001
Fig. 5
Fig. 5
Beta cell heterogeneity of NNAT expression is associated with changes in CpG methylation at the Nnat promoter. (a) Representative confocal microscopy of pancreatic cryosections from P56 mice with Nnat-driven eGFP expression from the paternal allele (NnatWT/eGFPpat) (n=7 mice). Sections were immunostained with antibodies against eGFP (green) and insulin (INS, grey). Nuclei are visualised with DAPI. Scale bar, 50 μm. (b) FACS separation of dispersed primary islet cells from reporter mice with insulin-driven expression of tdTomato (to label beta cells) and Nnat-driven eGFP expression from the paternal (NnatWT/eGFPpat) or maternal (NnatWT/eGFPmat) allele or wild-type (NnatWT/WT) at this locus (representative FACS plot of the dispersed islet preparation from a single mouse shown) (n=8, 3 and 3 mice per genotype, respectively, Kruskal–Wallis test with Dunn’s multiple comparisons). (c) Quantification of data in (b) expressed as percentage of eGFP/tdTomato co-positive primary islet cells. (d) Representative bisulphite analysis of CpG methylation at the Nnat promoter in FACS-purified islet cell populations from (b) (n=3 NnatWT/eGFPpat mice with paternally expressed Nnat-driven eGFP, n≥12 clones each). Closed circles, methylated CpG; open circles, unmethylated CpG. (e, f) Quantification of data in (d) expressed as percentage CpG methylation across the Nnat promoter at individual CpGs (e) and across the entire Nnat promoter (f) (both paired Student’s t test). (g) Schematic summarising level of CpG methylation at the Nnat promoter and gametic DMR in NNAT+ vs NNAT beta cells (created with BioRender.com). Representative image in (a) and bisulphite analyses in (d) used experimental mice from three independent experiments and breeding pairs. *p<0.05, **p<0.01
Fig. 6
Fig. 6
Postnatal restriction of NNAT in a subset of beta cells is at least partially driven by the de novo methyltransferase DNMT3A. (a) Representative confocal microscopy of pancreatic cryosections from mice with conditional deletion of DNMT3A under the control of the Pdx1 promoter (Pdx1-Cre+ Dnmt3afl/fl) vs control (Pdx1-Cre Dnmt3afl/fl) mice at P6. Sections were immunostained with antibodies against endogenous NNAT (green) and insulin (INS, red). (b) Quantification of NNAT+ beta cells from images shown in (a), expressed as NNAT/INS co-positive cells as a percentage of total INS-positive cells. Scale bar, 50 μm (n=8 mice per genotype, unpaired Student’s t test, **p<0.01). Nuclei are visualised with DAPI
Fig. 7
Fig. 7
NNAT+ adult beta cells are transcriptionally distinct and have significantly higher insulin content. (a) Correlation matrix of differentially expressed genes between NNAT+ and NNAT beta cells as assessed by RNA-seq analysis (n=4 FACS-purified populations from individual mouse islet preparations). Scale bar (0–255) gives an integer provided to the R function where the darker colour corresponds to higher sample correlation. (b) Heatmap of the top ten most differentially expressed genes reduced in NNAT+ beta cells compared with NNAT beta cells. (c, d) GSEA showing categories significantly enriched (c) and reduced (d) in NNAT+ (vs NNAT) beta cells. (e, f) Representative confocal microscopy of pancreatic cryosections from P56 (8-week-old) wild-type mice on a C57BL/6J background immunostained with antibodies against endogenous NNAT (green) and UCN3 (red, e) or TOM20 (red, f). Scale bar, 100 μm. Nuclei are visualised with DAPI. Representative images from three independent experiments and breeding pairs (g, h). Quantification of NNAT (g) and TOM20 (h) staining in NNAT and NNAT+ beta cells (INS+) from images shown in (f), expressed as mean intensity of the NNAT or TOM20 channel (*p<0.05, paired Student’s t test, 1329 NNAT and 295 NNAT+ beta cells from 15 islets, n=3 mice). (i) Insulin content assessed in NNAT+ and NNAT beta cells (*p<0.05, n=7 FACS-purified populations from individual mouse islet preparations, Wilcoxon matched-pairs signed rank test). AU, arbitrary units; FC, fold change
Fig. 8
Fig. 8
NNAT+ beta cells show altered glucose-induced Ca2+ dynamics and are de-enriched for highly connected ‘hub’ cells within individual islets. (a) Ca2+-bound Cal-590 AM fluorescence in response to high glucose (11 mmol/l) in NNAT and NNAT+ cells from primary islets from NnatWT/eGFPpat reporter mice expressed as normalised intensity over time (F/Fmin) (n=61 islets total from five mice per genotype; quantification of AUC on the right, p=0.063, Wilcoxon matched-pairs signed rank test). (b) Representative Cartesian map of beta cells with colour-coded lines connecting cells according to the strength of coactivation (colour-coded R values from 0 to 1, blue to red). Beta cells are represented by differently coloured nodes depending on their coactivity with the other beta cells, where black nodes indicate coactivity with ≥80% of the remaining beta cells, while grey, white and orange nodes represent coactivity with ≥60%, ≥40% and <40%, respectively. Nodes circled with a solid black line indicate NNAT+ cells. (c) Representative heatmaps depicting connectivity strength (r) of all cell pairs (colour-coded r values from 0 to 1, blue to yellow). (d) Log–log graphs of beta cell–beta cell connectivity distribution. NNAT+ cells are represented by green circles while NNAT cells are represented by red circles (45 islets total using primary islet preparations, each from an individual NnatWT/eGFPpat reporter mouse). (e) Categorisation of beta cells based on data from (d). (f) Percentage coactivity of beta cells between all cells in identified ‘hub’ and ‘follower’ cells. (g) The proportion of cells designated as ‘hub’ vs ‘follower’ cells in both the NNAT and NNAT+ populations assessed in each of 45 islets (**p<0.01, Wilcoxon matched-pairs signed rank test). Analyses in panels (ag) obtained from three independent experiments and three different breeding pairs of experimental mice. AU, arbitrary units

Update of

References

    1. Rutter GA, Pullen TJ, Hodson DJ, Martinez-Sanchez A. Pancreatic β-cell identity, glucose sensing and the control of insulin secretion. Biochem J. 2015;466(2):203–218. doi: 10.1042/BJ20141384. - DOI - PubMed
    1. Salinno C, Cota P, Bastidas-Ponce A, Tarquis-Medina M, Lickert H, Bakhti M. β-cell maturation and identity in health and disease. Int J Mol Sci. 2019;20(21):5417. doi: 10.3390/ijms20215417. - DOI - PMC - PubMed
    1. Hoffman BG, Robertson G, Zavaglia B, et al. Locus co-occupancy, nucleosome positioning, and H3K4me1 regulate the functionality of FOXA2-, HNF4A-, and PDX1-bound loci in islets and liver. Genome Res. 2010;20(8):1037–1051. doi: 10.1101/gr.104356.109. - DOI - PMC - PubMed
    1. Dhawan S, Tschen SI, Zeng C, et al. DNA methylation directs functional maturation of pancreatic β cells. J Clin Invest. 2015;125(7):2851–2860. doi: 10.1172/JCI79956. - DOI - PMC - PubMed
    1. Lu TT, Heyne S, Dror E, et al. The polycomb-dependent epigenome controls β cell dysfunction, dedifferentiation, and diabetes. Cell Metab. 2018;27(6):1294–1308 e1297. doi: 10.1016/j.cmet.2018.04.013. - DOI - PMC - PubMed

Publication types