. 2024 Mar 21;81(1):150.
doi: 10.1007/s00018-024-05188-1.

The exon junction complex is required for DMD gene splicing fidelity and myogenic differentiation

Affiliations

The exon junction complex is required for DMD gene splicing fidelity and myogenic differentiation

Dylan Da Cunha et al. Cell Mol Life Sci. .

Abstract

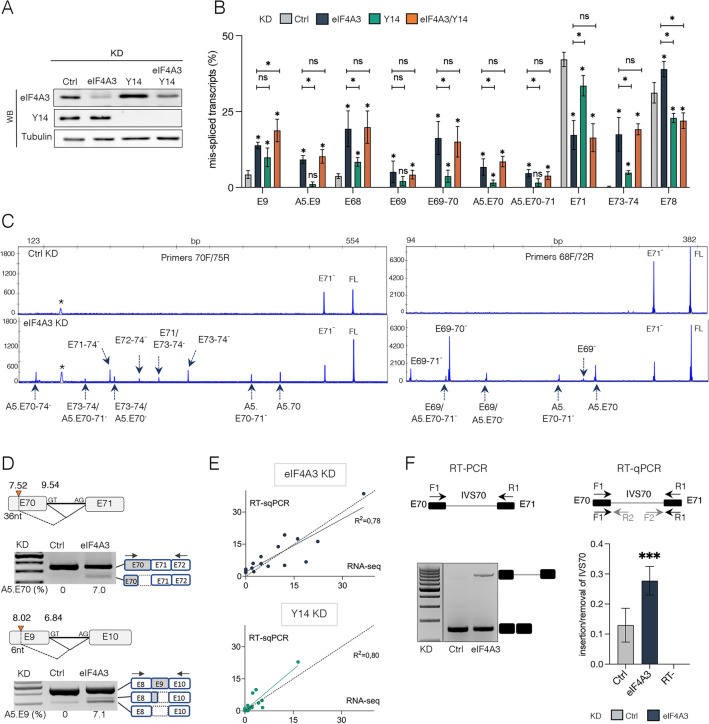
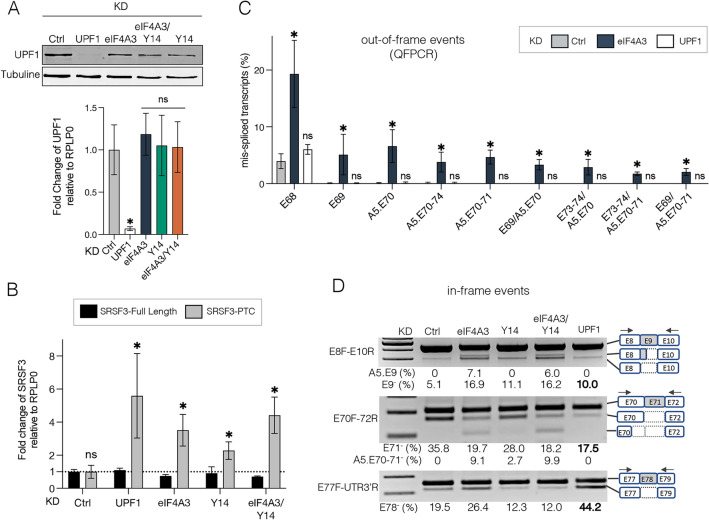
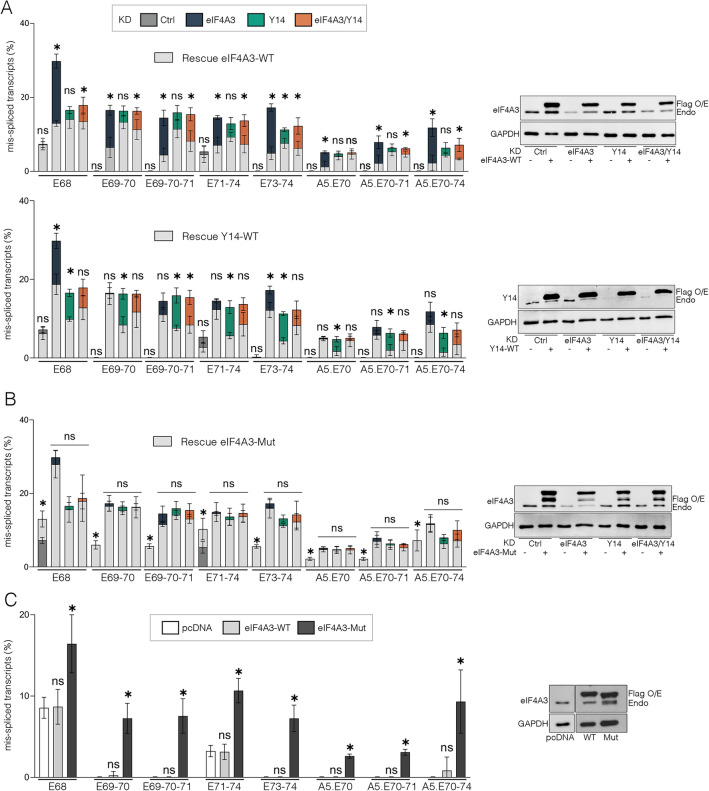
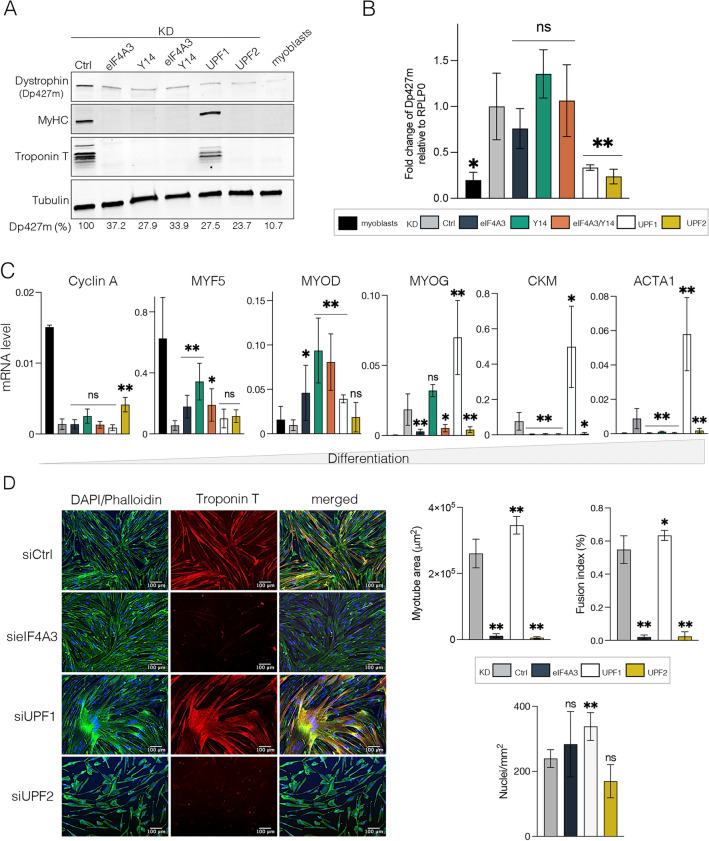
Deposition of the exon junction complex (EJC) upstream of exon-exon junctions helps maintain transcriptome integrity by preventing spurious re-splicing events in already spliced mRNAs. Here we investigate the importance of EJC for the correct splicing of the 2.2-megabase-long human DMD pre-mRNA, which encodes dystrophin, an essential protein involved in cytoskeletal organization and cell signaling. Using targeted RNA-seq, we show that knock-down of the eIF4A3 and Y14 core components of EJC in a human muscle cell line causes an accumulation of mis-splicing events clustered towards the 3' end of the DMD transcript (Dp427m). This deregulation is conserved in the short Dp71 isoform expressed ubiquitously except in adult skeletal muscle and is rescued with wild-type eIF4A3 and Y14 proteins but not with an EJC assembly-defective mutant eIF4A3. MLN51 protein and EJC-associated ASAP/PSAP complexes independently modulate the inclusion of the regulated exons 71 and 78. Our data confirm the protective role of EJC in maintaining splicing fidelity, which in the DMD gene is necessary to preserve the function of the critical C-terminal protein-protein interaction domain of dystrophin present in all tissue-specific isoforms. Given the role of the EJC in maintaining the integrity of dystrophin, we asked whether the EJC could also be involved in the regulation of a mechanism as complex as skeletal muscle differentiation. We found that eIF4A3 knockdown impairs myogenic differentiation by blocking myotube formation. Collectively, our data provide new insights into the functional roles of EJC in human skeletal muscle.

Keywords: Duchenne muscular dystrophy; Myoblasts differentiation; Nonsense mediated mRNA Decay (NMD); PININ; RNPS1; UPF1.


Conflict of interest statement

The authors have no relevant financial or non-financial interests to disclose.

Figures

Fig. 1
Fig. 1
Splicing profile of the Dp427m isoform upon depletion of the EJC proteins eIF4A3 and Y14 .A Inclusion level of the 79 DMD exons (Percent Spliced In, PSI) calculated from DMD-targeted RNA-seq datasets after eIF4A3 (dark blue) or Y14 (green) KD (n = 2) in the C25Cl48 cell line differentiated for 3 days compared to control (Ctrl, grey) (n = 4). B eIF4A3 and Y14 mRNA and protein levels were monitored by RT-qPCR (upper panel, means ± SD, n = 2) and western blot analysis (representative images, bottom panel). C Mis-spliced transcripts identified with the IPSA software in eIF4A3 KD are depicted in the bar graph and compared to levels in Y14 KD and Ctrl conditions. DI Sashimi plots color-coded by condition (Ctrl, eIF4A3, Y14 KD) depicting (DH) the differentially spliced exons and (I) intron 70 (IVS70) retention. The raw junction read counts (mean of duplicates) are shown on top of each junction represented as curved lines. Schematic of the primary transcript (ENST00000367455) for the DMD gene from the Ensembl database, version 75, with exons shown as boxes, introns shown as lines, and arrows indicating the direction of transcription
Fig. 2
Fig. 2
Validation of DMD aberrant splicing events upon depletion of EJC components. A Western blot analysis of eIF4A3, Y14 and Tubulin as loading control in the different KD conditions. B Quantification of splicing events in Ctrl, eIF4A3 and/or Y14 KD by fluorescent semi-quantitative RT-PCR (QFPCR) (n = 4) in C25Cl48 cells. Data are shown as means ± SD (*p < 0.05; multiple Mann–Whitney test). ns, non-significant. C Representative electropherograms (x-axis: fragment size; y-axis: fluorescence intensity) of capillary electrophoresis analysis of large-sized amplified fragments using primers 70F/75R or 68F/72R in eIF4A3 KD compared to control (Ctrl). Size-calling of splicing events (i.e. exon 71 skipping (E71-), full-length RT-PCR product (FL)) was performed with the GeneMapper® v6.0 Software (arrows). (*) Non-specific band. D Representative agarose gels showing activation of alternative donor splice site (orange triangle) in exon 70 (A5.E70) and in exon 9 (A5.E9) in eIF4A3 KD condition (values in % below the gel). The identified splicing patterns are shown schematically at the top of the gels with the MaxEnt scores (in bold) for the natural and alternative donor splice sites. On the right side of the gels, gray and empty dotted boxes represent included and deleted exonic sequences, respectively. Black arrows, position of the primers. E Correlation between DMD-targeted RNA-seq and QFPCR data in eIF4A3 and Y14 KD. Plots for linear regression analyses and the R-squared (R2) values are shown. F Validation of IVS70 (698 bp) in eIF4A3 KD condition by RT-PCR using primers in exons 70 and 71 (F1/R1) (left panel) or RT-qPCR using three different primer pairs (F1/R1, F1/R2, F2/R1) (right panel). In qPCR, ratios of relative expression of DMD transcript with intron retained (mean of data (n = 8) measured with primers F1/R2 (n = 4) and F2/R1 (n = 4)) compared to relative DMD transcript expression with intron removed (measured with primers F1-R1 (n = 4)) are shown. No reverse transcriptase control (RT-). Data are mean ± SD (***p < 0.001; multiple Mann–Whitney test). All measurements are normalized to RPLP0 expression
Fig. 3
Fig. 3
Effect of UPF1 KD on EJC-dependent splicing events. A Assessment of UPF1 expression in UPF1, eIF4A3, Y14 and Ctrl KD conditions at protein and mRNA levels by western blot using Tubulin as loading control (upper panel) and RT-qPCR (bottom panel), respectively. B RT-qPCR of the SRSF3 NMD-sensitive transcript isoform (SRSF3-PTC containing exon 4) compared to full-length SRSF3 isoform (SRSF3-Full Length) in Ctrl, UPF1, eIF4A3 and/or Y14 KD. C Bar graph showing levels of out-of-frame splicing events determined by QFPCR in UPF1 KD compared to eIF4A3 KD and Ctrl condition. In (A, B, C) all data are mean ± SD of 4 independent replicates (*p < 0.05; multiple Mann–Whitney test). ns, non-significant. D Representative agarose gels showing changes in the inclusion level of in-frame DMD E9, E71 and E78 upon UPF1 KD. The structure of splicing events is depicted on the right side of the gels and levels (%) of aberrant splicing events are given below the gel
Fig. 4
Fig. 4
HeLa cell line as a model to study EJC-dependent splicing events in the 3’ end of DMD mRNA. A Scheme depicting the C25Cl48 and HeLa cells specific DMD isoforms (Dp427m and Dp71, specific promoter position). B Representative western blot showing siRNA-mediated knockdown of eIF4A3 and/or Y14 in HeLa cells with Tubulin as a loading control. C The splicing events quantified by QFPCR induced by eIF4A3 and/or Y14 KD in HeLa cells (Dp71) are correlated with those detected in C25Cl48 cells (Dp427m). Plots for linear regression analyses and the R-squared (R2) values are shown below the bar graphs. D Agarose gels of RT-PCR of KPNA1 exon 11 comparing exon skipping level (E11-, %) in eIF4A3 and Y14 KD in C25Cl48 and HeLa cells
Fig. 5
Fig. 5
eIF4A3 and Y14 individually contribute to the inclusion of DMD exons but EJC formation is required for correct DMD splicing. A HeLa cells depleted for eIF4A3 and/or Y14 were transfected with siRNA-resistant wild type (WT) eIF4A3 (upper panel) and Y14 (bottom panel) expression vector with a FLAG tag or B with a mutant (Mut) siRNA-resistant eIF4A3 that does not form EJC (eIF4A3-Mut). Histograms show the quantification by QFPCR of mis-spliced transcripts in rescue conditions (light grey bars) compared to eIF4A3, Y14, eIF4A3/Y14 and Ctrl KD conditions. Data are mean ± SD (n = 4) (*p < 0.05; multiple Mann–Whitney test). ns, non-significant. C The wild-type (WT) or mutant (Mut) siRNA-resistant FLAG-eIF4A3 protein was overexpressed in untreated HeLa cells and splicing events were quantified as described above and compared to the control condition (empty pcDNA vector, white bars). Detection of endogenous (endo) and FLAG-tagged (Flag) eIF4A3 or Y14 proteins by western blot is shown in the right panel. GAPDH serves as loading control. The additional upper band on western blot detecting the exogenous eIF4A3-Mut protein can correspond to different forms of the proteins
Fig. 6
Fig. 6
The EJC-peripheral proteins regulate splicing of DMD exons 71 and 78. A Western blot analyses of C25Cl48 cells depleted for eIF4A3 and proteins of the ASAP/PSAP complexes. Tubulin was used as a loading control (left panel). Western blot showing the KD efficiency of MLN51 (right panel). B Quantification by QFPCR of exon 71 (E71) and exon 78 (E78) skipping level (%). Data are mean ± SD (n = 4) (*p < 0.05; multiple Mann–Whitney test). ns, non-significant. C Representative agarose gels showing changes in the inclusion level of E71 and E78 (%, skipping level below the gels) in KD of MLN51 and ASAP/PSAP components (ACINUS, PININ, RNPS1 and SAP18)
Fig. 7
Fig. 7
Depletion of EJC components in C25Cl48 cells decreases dystrophin expression and impairs myogenic differentiation. A The Dp427m expression level in C25Cl48 cells depleted for EJC (eIF4A3, Y14, eIF4A3/Y14), UPF1 and UPF2 was assessed by western blot in comparison to siRNA control (Ctrl) or untreated proliferating C25Cl48 cells (myoblasts). Myosin heavy chain (MyHC) and Troponin T serve as markers of the differentiation state and Tubulin as loading control. Quantification by RT-qPCR of B Dp427m mRNA and C the myogenic differentiation factors Cyclin A, MYF5, MYOD, MYOG, ACTA1, CKM. Data are mean ± SD (n = 5) (*p < 0.05; **p < 0.01; multiple Mann–Whitney test). ns, non-significant. D Representative images of immunofluorescence microscopy at 10X of C25Cl48 cells treated with siRNAs (Ctrl, eIF4A3, UPF1 and UPF2) for Troponin-T (red), Phalloïdin-488 to visualize actin filaments (green) and DAPI (blue). Scale bar = 100 µm. Myotube morphology was characterized by calculating mean myotube area, total number of nuclei and fusion index (nuclei per myotube/total nuclei). (*p < 0.05; **p < 0.01; multiple Mann–Whitney test). ns, non-significant

References

    1. Wilkinson ME, Charenton C, Nagai K. RNA splicing by the spliceosome. Annu Rev Biochem. 2020;89:359–388. doi: 10.1146/annurev-biochem-091719-064225. - DOI - PubMed
    1. De Conti L, Baralle M, Buratti E. Exon and intron definition in pre-mRNA splicing. WIREs RNA. 2013;4:49–60. doi: 10.1002/wrna.1140. - DOI - PubMed
    1. Fu XD, Ares M. Context-dependent control of alternative splicing by RNA-binding proteins. Nat Rev Genet. 2014;15:689–701. doi: 10.1038/nrg3778. - DOI - PMC - PubMed
    1. Baralle FE, Giudice J. Alternative splicing as a regulator of development and tissue identity. Nat Rev Mol Cell Biol. 2017;18:437–451. doi: 10.1038/nrm.2017.27. - DOI - PMC - PubMed
    1. Le Hir H, Gatfield D, Izaurralde E, Moore MJ. The exon–exon junction complex provides a binding platform for factors involved in mRNA export and nonsense-mediated mRNA decay. EMBO J. 2001;20:4987–4997. doi: 10.1093/emboj/20.17.4987. - DOI - PMC - PubMed

LinkOut - more resources