. 2024 Oct;46(5):4225-4242.
doi: 10.1007/s11357-024-01124-0. Epub 2024 Mar 21.

Anti-cytomegalovirus antibody levels stratify human immune profiles across the lifespan

Affiliations

Anti-cytomegalovirus antibody levels stratify human immune profiles across the lifespan

Makiko Watanabe et al. Geroscience. 2024 Oct.

Abstract

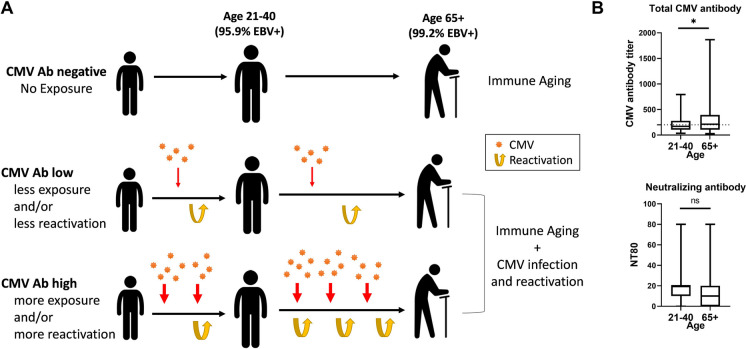
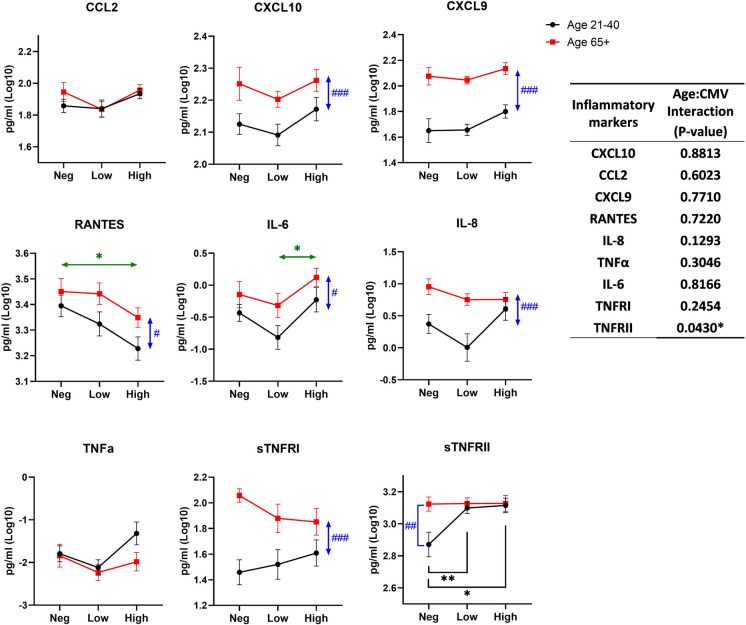
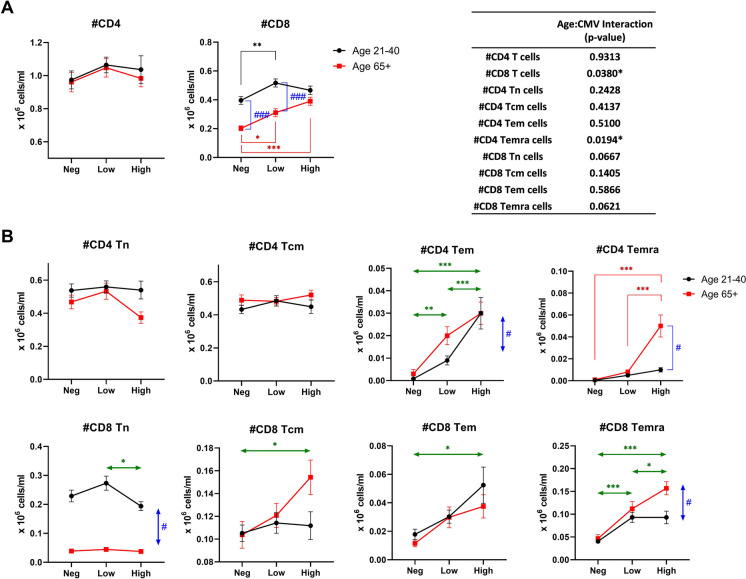
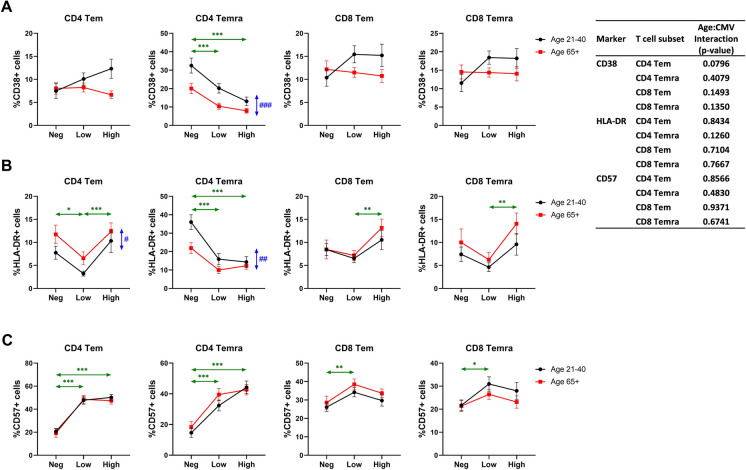
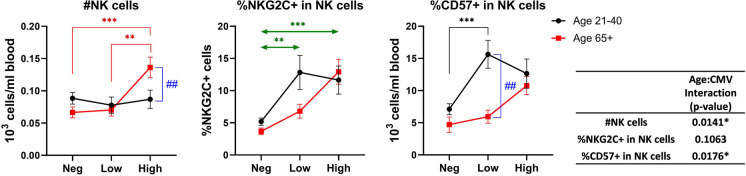
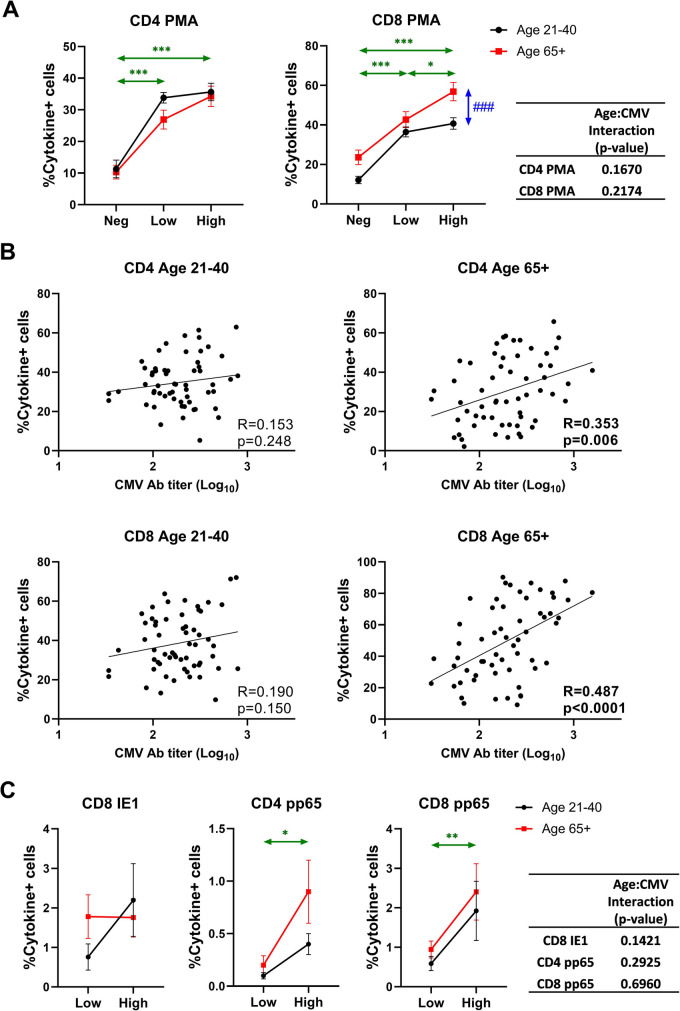
Human cytomegalovirus (hCMV) is a ubiquitous latent persistent herpesvirus infecting 60-90% of the population worldwide. hCMV carriage in immunocompetent people is asymptomatic; thus, hCMV can be considered a component of normative aging. However, hCMV powerfully modulates many features of the immune, and likely other, systems and organs. Questions remain as to how hCMV carriage affects the human host. We used anti-CMV antibody titers as a stratifying criterion to examine the impact of "intensity" of hCMV infection as a potential biomarker of aging, inflammation, and immune homeostasis in a cohort of 247 participants stratified into younger (21-40 years) and older (> 65 years of age) groups. We showed that anti-CMV antibody titers increased with age and directly correlated to increased levels of soluble tumor necrosis factor (sTNFR) I in younger but not older participants. CD8 + cell numbers were reduced in the older group due to the loss in CD8 + T naïve (Tn) cells. In CMV carriers and, in particular, in anti-CMV Ab-high participants, this loss was mitigated or reversed by an increase in the numbers of CD8 + T effector memory (Tem) and T effector memory reexpressing CD45RA (Temra) cells. Analysis of CD38, HLA-DR, and CD57 expression revealed subset (CD4 or CD8)-specific changes that correlated with anti-CMV Ab levels. In addition, anti-CMV Ab levels predicted anti-CMV CD8 T cell responsiveness to different CMV open reading frames (ORFs) selectively in older participants, which correlated to the transcriptional order of expression of specific CMV ORFs. Implications of these results for the potential predictive value of anti-CMV Ab titers during aging are discussed.

Keywords: CMV; Immune aging; Immune profiles.


Conflict of interest statement

The authors declare no competing interests.

Figures

Fig. 1
Fig. 1
Cohort stratification by age, CMV and EBV serostatus and anti-CMV antibody response magnitude in relation to expected relationship to CMV exposure and reactivation
Fig. 2
Fig. 2
Effect of age and CMV serostatus on inflammatory markers in plasma. The interaction of age and CMV serostatus for each inflammatory marker level in plasma is analyzed by ANOVA (inset table). Data are presented as mean ± SE. Black circle and line, age 21–40; red square and line, age 65 + . Neg, anti-CMV antibody negative; low, anti-CMV antibody titer low; high, anti-CMV antibody titer high. Vertical double-head arrows (blue) represent the comparison between age groups regardless of CMV status and horizontal double-head arrows (Green) represent the comparison between CMV groups regardless of age. p-values for group comparisons were adjusted by Holm’s method. Statistical significance between age groups is shown as #p < 0.05, ##p < 0.01, and ###p < 0.001. Statistical significance between CMV groups is shown as *p < 0.05, **p < 0.01, and ***p < 0.001
Fig. 3
Fig. 3
Effect of age and CMV serostatus on numbers of T cell subsets in blood. The interaction of age and CMV serostatus for each T cell subset is analyzed by ANOVA (inset table). A Comparison of total CD4 and CD8 T cells between the age/CMV groups. B Comparison of T cell subsets between the age/CMV groups. Tn, naïve T cells; Tcm, central memory T cells; Tem, effector memory T cells; Temra, RA-positive effector memory T cells. Black circle and line, age 21–40; red square and line, age 65 + . Neg, anti-CMV antibody negative; low, anti-CMV antibody titer low; high, anti-CMV antibody titer high. Vertical double-head arrows (blue) represent the comparison between age groups regardless of CMV status and horizontal double-head arrows (Green) represent the comparison between CMV groups regardless of age. Data are presented as mean ± SE. p-values for group comparisons were adjusted by Holm’s method. Statistical significance between age groups is shown as #p < 0.05, ##p < 0.01, and ###p < 0.001. Statistical significance between CMV groups is shown as *p < 0.05, **p < 0.01, and ***p < 0.001
Fig. 4
Fig. 4
Effect of age and CMV serostatus on expression of functional markers on effector memory T cells. The interaction of age and CMV serostatus for each expression level of CD38 (A), HLA-DR (B), or CD57 (C) on effector memory CD4 and CD8 T cells is analyzed by ANOVA (inset table). Tem, effector memory T cells; Temra, RA-positive effector memory T cells. Black circle and line, age 21–40; red square and line, age 65 + . Neg, anti-CMV antibody negative; low, anti-CMV antibody titer low; high, anti-CMV antibody titer high. Vertical double-head arrows (blue) represent the comparison between age groups regardless of CMV status and horizontal double-head arrows (Green) represent the comparison between CMV groups regardless of age. Data are presented as mean ± SE. p-values for group comparisons were adjusted by Holm’s method. Statistical significance between age groups is shown as #p < 0.05, ##p < 0.01, and ###p < 0.001. Statistical significance between CMV groups is shown as *p < 0.05, **p < 0.01, and ***p < 0.001
Fig. 5
Fig. 5
Effect of age and CMV serostatus on NK cells. The interaction of age and CMV serostatus for the number of NK cells, frequency of NKG2C + cells in total NK cells, and frequency of CD57 + cells in total NK cells in blood is analyzed by ANOVA (inset table). Black circle and line, age 21–40; red square and line, age 65 + . Neg, anti-CMV antibody negative; low, anti-CMV antibody titer low; high, anti-CMV antibody titer high. Vertical double-head arrows (blue) represent the comparison between age groups regardless of CMV status and horizontal double-head arrows (Green) represent the comparison between CMV groups regardless of age. Data are presented as mean ± SE. p-values for group comparisons were adjusted by Holm’s method. Statistical significance between age groups is shown as #p < 0.05, ##p < 0.01, and ###p < 0.001. Statistical significance between CMV groups is shown as *p < 0.05, **p < 0.01, and ***p < 0.001
Fig. 6
Fig. 6
Effect of age and CMV serostatus on non-specific and CMV-specific T cell response. PBMCs were stimulated by PMA/ionomycin or CMV peptides and IFN-γ and TNF-α positive cells were quantified by intracellular staining followed by flow cytometry. Cytokine + cells are defined by IFN-γ + and/or TNF-α + cells. A Effect of age and CMV serostatus on non-specific T cell response. B Correlation analysis between CMV antibody titer and frequency of cytokine + cells in CD4 or CD8 of different age groups. Pearson’s R and correlation p-values are shown at the bottom right corner of each scatter plot. C Effect of age and CMV serostatus on CMV-specific T cell response. A and C Black circle and line, age 21–40; red square and line, age 65 + . Neg, anti-CMV antibody negative; low, anti-CMV antibody titer low; high, anti-CMV antibody titer high. Vertical double-head arrows (blue) represent the comparison between age groups regardless of CMV status and horizontal double-head arrows (Green) represent the comparison between CMV groups regardless of age. Data are presented as mean ± SE. The interaction of age and CMV serostatus for frequency of cytokine + cells in CD4 or CD8 T cells is analyzed by ANOVA. p-values for group comparisons were adjusted by Holm’s method. Statistical significance between age groups is shown as #p < 0.05, ##p < 0.01, and ###p < 0.001. Statistical significance between CMV groups is shown as *p < 0.05, **p < 0.01, and ***p < 0.001

References

    1. Cannon MJ, Schmid DS, Hyde TB. Review of cytomegalovirus seroprevalence and demographic characteristics associated with infection. Rev Med Virol. 2010;20(4):202–13. 10.1002/rmv.655. 10.1002/rmv.655 - DOI - PubMed
    1. Chen S, Pawelec G, Trompet S, Goldeck D, Mortensen LH, Slagboom PE, Christensen K, Gussekloo J, Kearney P, Buckley BM, Ford I, Jukema JW, Westendorp RGJ, Maier AB. Associations of cytomegalovirus infection with all-cause and cardiovascular mortality in multiple observational cohort studies of older adults. J Infect Dis. 2021;223(2):238–46. 10.1093/infdis/jiaa480. 10.1093/infdis/jiaa480 - DOI - PMC - PubMed
    1. Brizic I, Hirsl L, Britt WJ, Krmpotic A, Jonjic S. Immune responses to congenital cytomegalovirus infection. Microbes Infect. 2018;20(9–10):543–51. 10.1016/j.micinf.2017.12.010. 10.1016/j.micinf.2017.12.010 - DOI - PMC - PubMed
    1. Mocarski ES Jr. Biology and replication of cytomegalovirus. Transfus Med Rev. 1988;2(4):229–34. 10.1016/s0887-7963(88)70050-4. 10.1016/s0887-7963(88)70050-4 - DOI - PubMed
    1. Nelson CT, Demmler GJ. Cytomegalovirus infection in the pregnant mother, fetus, and newborn infant. Clin Perinatol. 1997;24(1):151–60 https://www.ncbi.nlm.nih.gov/pubmed/9099507. 10.1016/S0095-5108(18)30189-1 - DOI - PubMed