. 2024 Jun;70(6):507-518.
doi: 10.1165/rcmb.2023-0469OC.

Kisspeptin/KISS1R Signaling Modulates Human Airway Smooth Muscle Cell Migration

Affiliations

Kisspeptin/KISS1R Signaling Modulates Human Airway Smooth Muscle Cell Migration

Premanand Balraj et al. Am J Respir Cell Mol Biol. 2024 Jun.

Abstract

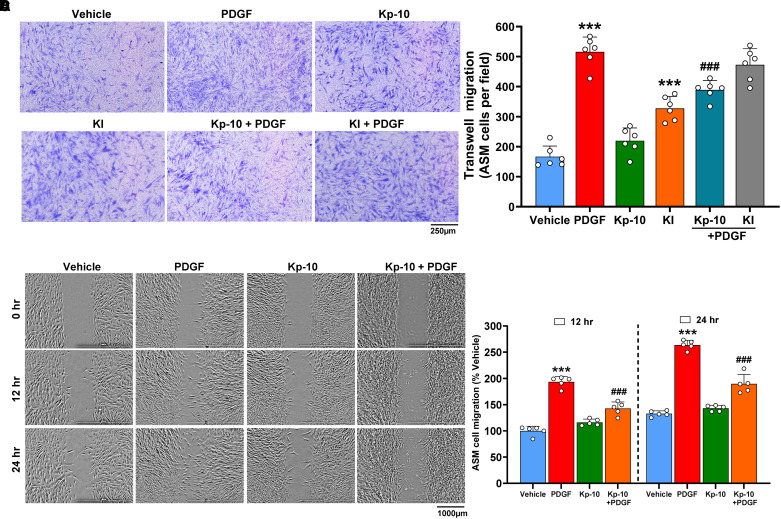
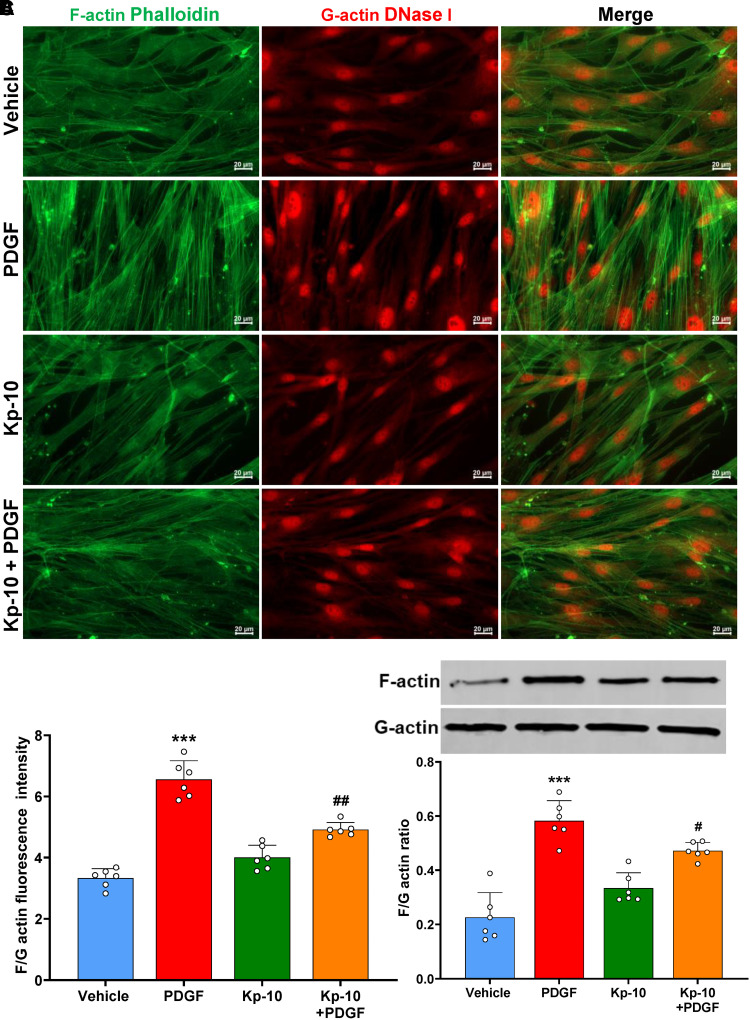
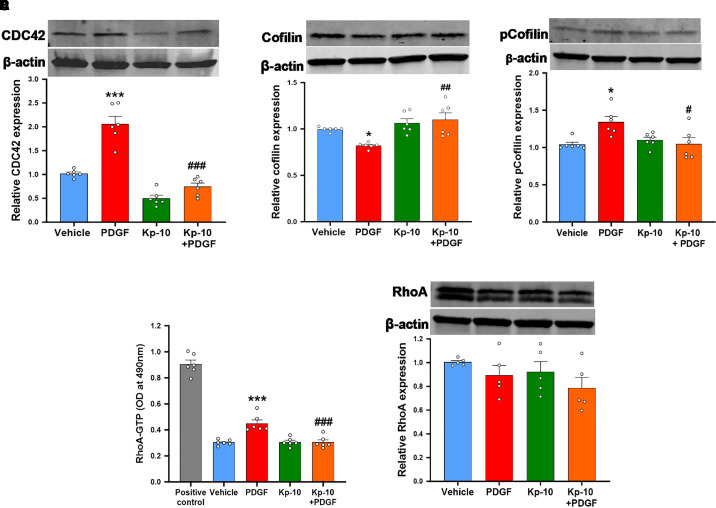
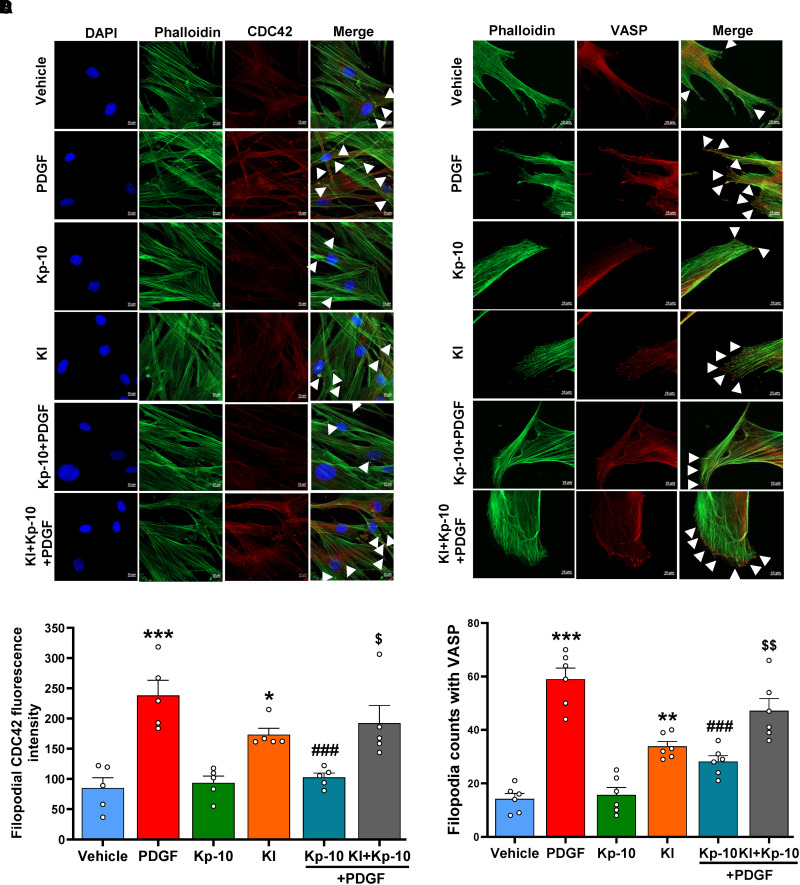
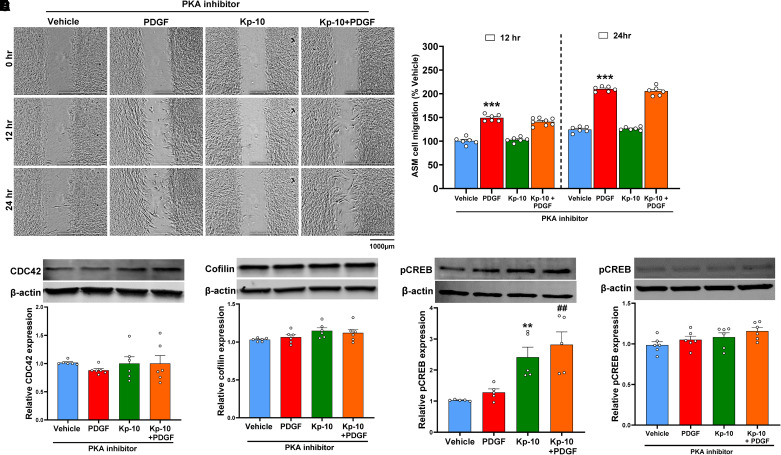
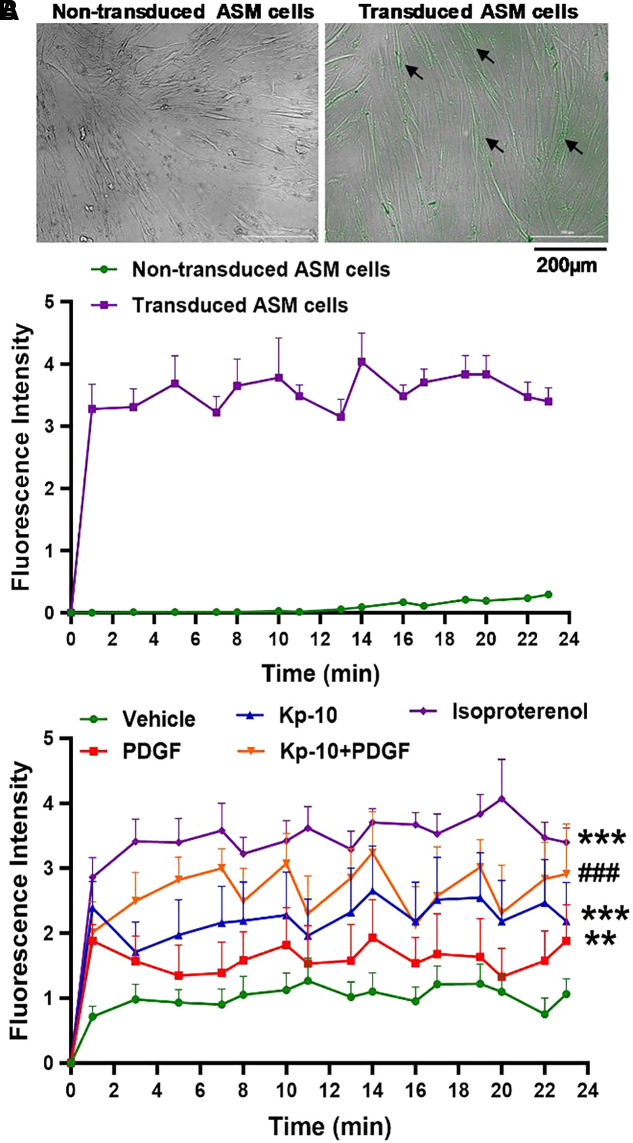
Airway remodeling is a cardinal feature of asthma, associated with increased airway smooth muscle (ASM) cell mass and upregulation of extracellular matrix deposition. Exaggerated ASM cell migration contributes to excessive ASM mass. Previously, we demonstrated the alleviating role of Kp (kisspeptin) receptor (KISS1R) activation by Kp-10 in mitogen (PDGF [platelet-derived growth factor])-induced human ASM cell proliferation in vitro and airway remodeling in vivo in a mouse model of asthma. Here, we examined the mechanisms by which KISS1R activation regulates mitogen-induced ASM cell migration. KISS1R activation using Kp-10 significantly inhibited PDGF-induced ASM cell migration, further confirmed using KISS1R shRNA. Furthermore, KISS1R activation modulated F/G actin dynamics and the expression of promigration proteins like CDC42 (cell division control protein 42) and cofilin. Mechanistically, we observed reduced ASM RhoA-GTPAse with KISS1R activation. The antimigratory effect of KISS1R was abolished by PKA (protein kinase A)-inhibitory peptide. Conversely, KISS1R activation significantly increased cAMP and phosphorylation of CREB (cAMP-response element binding protein) in PDGF-exposed ASM cells. Overall, these results highlight the alleviating properties of Kp-10 in the context of airway remodeling.

Keywords: actin dynamics; airway remodeling; asthma; cAMP-dependent protein kinase A; mitogen.


Figures

Figure 1.
Figure 1.
KISS1R (kisspeptin receptor) activation regulates PDGF (platelet-derived growth factor)-induced human airway smooth muscle (ASM) cell migration. Human ASM cells were cultured in 24-well Transwell plates/inserts and subjected to various treatments, including Kp-10 (1 μM), KI (Kp-234 trifluoroacetate, 1 μM), and PDGF (2 ng/ml). After a 24-hour incubation period, traversed cells were fixed, stained, and subsequently imaged using a light microscope at 10× magnification. (A) Representative microscopic images of Transwell-migrated ASM cells. Scale bar, 250 μm. (B) ImageJ software was used for the quantification of migrated ASM cells across different treatment groups, providing a graphical representation of the observed outcomes. (C) Lionheart-Fx automated microscope captured time-lapse images of migrated ASM cells at 0, 12, and 24 hours. Representative images presented with a scale bar of 1,000 μm. (D) Graphical representation of the selected random fields from each treatment group and percentage of cell-covered area at each time point quantified using ImageJ software. Data were analyzed using one-way or two-way ANOVA followed by Tukey’s post hoc test. Data are presented as mean ± SEM (n = 5–6/group); ***P < 0.001 versus vehicle and ###P < 0.001 versus PDGF.
Figure 2.
Figure 2.
Effect of Kp-10 on PDGF-induced migration of KISS1R shRNA human ASM cells. (A) Representative images captured using the Lionheart-Fx automated microscope show the migration of ASM cells in two-well inserts at 0, 12, and 24 hours, with scale bars of 1,000 μm as reference. (B) Bar graph shows the percentage cell coverage was quantified at each time point using ImageJ software. (C) Western blot analysis serves to validate knockdown of KISS1R in human ASM cells. Data were analyzed using one-way ANOVA followed by Tukey’s post hoc test, unpaired t test. Data are presented as mean ± SEM (n = 5/group); ***P < 0.001 versus vehicle KISS1R shRNA and **P < 0.01 versus negative (Neg) shRNA.
Figure 3.
Figure 3.
KISS1R activation on PDGF-induced F/G-actin dynamics in human ASM cells. (A) Representative images showing F-actin– and G-actin–stained ASM cells. F-actin was stained using phalloidin AF-488, and G-actin was stained using DNase I, AF-594. Scale bars, 20 μm. (B) Bar graph representing the relative fluorescence intensity of F-actin and G-actin. (C) The effect of Kp-10 on PDGF-induced F-actin and G-actin formation was further verified by Western blotting. Data were analyzed using one-way ANOVA followed by Tukey’s post hoc test. Data are presented as mean ± SEM (n = 6/group); ***P < 0.001 versus vehicle; #P < 0.05 and ##P < 0.01 versus PDGF.
Figure 4.
Figure 4.
Regulation of human ASM cell migration by KISS1R activation: Modulation of actin-associated proteins. Human ASM cells were seeded onto 100-mm plates and subjected to 24-hour serum deprivation before Kp-10 treatment followed by exposure to PDGF. After 24 hours, the cell lysates from various treatment groups were subjected to Western blot analysis to determine the expression levels of actin-associated proteins such as (A) CDC42, (B) Cofilin, (C) phospho-cofilin (pCofilin), and (E) RhoA. (D) The graph illustrates RhoA-GTP levels quantified using G-LISA. Data were analyzed using one-way ANOVA followed by Tukey’s post hoc test. Data are presented as mean ± SEM (n = 5–6/group); *P < 0.05 and ***P < 0.001, versus vehicle; #P < 0.05, ##P < 0.01, and ###P < 0.001 versus PDGF.
Figure 5.
Figure 5.
KISS1R activation regulates CDC42 and filopodial formation in human ASM cells. Human ASM cells were fixed and immunostained for CDC42 and VASP (vasodilator-stimulated phosphoprotein) after respective treatments. Images were taken on a Zeiss LSM880 confocal fast airyscan module using 408-, 488-, and 647-nm lasers. White arrows indicate CDC42 or VASP localization in filopodial region. The quantitative analysis was performed using Zeiss software. (A) Representative images showing filopodial CDC42 expression. (B) Graphical representation of filopodial CDC42 fluorescence intensity. Scale bars, 10 μm. (C) Representative images showing filopodial VASP localization. Scale bars, 10 μm. (D) Quantification of filopodia VASP localization. Data were analyzed using one-way ANOVA followed by Tukey’s post hoc test. Data are presented as mean ± SEM (n = 5–6/group); *P < 0.05, **P < 0.01, and ***P < 0.001, versus vehicle; ###P < 0.001 versus PDGF; $P < 0.05 and $$P < 0.01 versus Kp-10 + PDGF.
Figure 6.
Figure 6.
KISS1R activation by Kp-10 modulates human ASM cell migration by PKA (protein kinase A)-dependent mechanism. Human ASM cells were seeded in two-well inserts and treated for 24 hours with PKA inhibitory peptide (10 μM), Kp-10 (1 μM), and PDGF (2 ng/ml). (A) Images captured with the Lionheart-Fx automated microscope depict the migration of ASM cells in two-well inserts at 0, 12, and 24 hours; scale bar, 1,000 μm. (B) Graphical representation of the selected random fields from each treatment group and percentage of cell-covered area at each time point was quantified using ImageJ software. Western blot panels represent expression levels for (C) CDC42 and (D) Cofilin expression in human ASM cells treated with PKA inhibitory peptide. (E) Western blot analysis of pCREB (phosphorylated cAMP response element–binding) protein. (F) Western blot analysis of pCREB protein of human ASM cells treated with PKA inhibitory peptide (10 μM). Data were analyzed using one-way ANOVA followed by Tukey’s post hoc test. Data are presented as mean ± SEM (n = 5–6/group); **P < 0.01 and ***P < 0.001 versus vehicle; ##P < 0.01 versus PDGF.
Figure 7.
Figure 7.
Effect of Kp-10 on cAMP dynamics in human ASM cells. (A, top panel) Representative images show nontransduced human ASM cells alongside transduced ASM cells expressing the cADDis cAMP sensor after 48 hour incubation period. (A, bottom panel) Fluorescence traces show responses to isoproterenol treatment over 24 minutes both for transduced and nontransduced ASM cells; an upward deflection of trace signifies an increase in cAMP levels. Scale bars, 200 μm. (B) Graph displays fluorescence levels from transduced ASM cells after treatment with Kp-10 (1 μM), PDGF (2 ng/ml), and isoproterenol (1 μM). Data at the final time point of fluorescence intensity were analyzed using one-way ANOVA followed by Tukey’s post hoc test. Data are presented as mean ± SEM (n = 6/group); **P < 0.01 and ***P < 0.001 versus vehicle; ###P < 0.001 versus PDGF.

Comment in

Similar articles

Cited by

References

    1. Hough KP, Curtiss ML, Blain TJ, Liu R-M, Trevor J, Deshane JS, et al. Airway remodeling in asthma. Front Med (Lausanne) . 2020;7:191. - PMC - PubMed
    1. Prakash YS. Airway smooth muscle in airway reactivity and remodeling: what have we learned? Am J Physiol Lung Cell Mol Physiol . 2013;305:L912–L933. - PMC - PubMed
    1. Araujo BB, Dolhnikoff M, Silva LF, Elliot J, Lindeman JH, Ferreira DS, et al. Extracellular matrix components and regulators in the airway smooth muscle in asthma. Eur Respir J . 2008;32:61–69. - PubMed
    1. Chetty A, Nielsen HC. Targeting airway smooth muscle hypertrophy in asthma: an approach whose time has come. J Asthma Allergy . 2021;14:539–556. - PMC - PubMed
    1. Hedges JC, Dechert MA, Yamboliev IA, Martin JL, Hickey E, Weber LA, et al. A role for p38(MAPK)/HSP27 pathway in smooth muscle cell migration. J Biol Chem . 1999;274:24211–24219. - PubMed

MeSH terms

LinkOut - more resources