. 2024 Sep 1;15(9):661-685.
doi: 10.1093/procel/pwae014.

Dietary pyruvate targets cytosolic phospholipase A2 to mitigate inflammation and obesity in mice

Affiliations

Dietary pyruvate targets cytosolic phospholipase A2 to mitigate inflammation and obesity in mice

Sadaf Hasan et al. Protein Cell. .

Abstract

Obesity has a multifactorial etiology and is known to be a state of chronic low-grade inflammation, known as meta-inflammation. This state is associated with the development of metabolic disorders such as glucose intolerance and nonalcoholic fatty liver disease. Pyruvate is a glycolytic metabolite and a crucial node in various metabolic pathways. However, its role and molecular mechanism in obesity and associated complications are obscure. In this study, we reported that pyruvate substantially inhibited adipogenic differentiation in vitro and its administration significantly prevented HFD-induced weight gain, white adipose tissue inflammation, and metabolic dysregulation. To identify the target proteins of pyruvate, drug affinity responsive target stability was employed with proteomics, cellular thermal shift assay, and isothermal drug response to detect the interactions between pyruvate and its molecular targets. Consequently, we identified cytosolic phospholipase A2 (cPLA2) as a novel molecular target of pyruvate and demonstrated that pyruvate restrained diet-induced obesity, white adipose tissue inflammation, and hepatic steatosis in a cPLA2-dependent manner. Studies with global ablation of cPLA2 in mice showed that the protective effects of pyruvate were largely abrogated, confirming the importance of pyruvate/cPLA2 interaction in pyruvate attenuation of inflammation and obesity. Overall, our study not only establishes pyruvate as an antagonist of cPLA2 signaling and a potential therapeutic option for obesity but it also sheds light on the mechanism of its action. Pyruvate's prior clinical use indicates that it can be considered a safe and viable alternative for obesity, whether consumed as a dietary supplement or as part of a regular diet.

Keywords: cytosolic phospholipase; metabolic disease; obesity; pyruvate.


Conflict of interest statement

The authors declare no competing interests related to this article.

Figures

Figure 1.
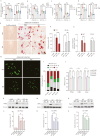
Figure 1.
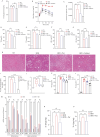
Effect of pyruvate on adipogenic differentiation in primary cells. (A) Heatmap of gene expression levels from RNA seq analysis of bmMSCs isolated from C57BL/6 mice treated with or without low (2 mmol/L) or high (4 mmol/L) concentrations of pyruvate, in the presence of TNFα for 24 h. (B) Volcano plot showing statistical significance (P-value) vs. fold change for differentially expressed genes (DEGs) of bmMSCs treated with pyruvate in the presence (4 mmol/L) in the presence of TNFα for 24 h. The dots represent significantly upregulated and significantly downregulated DEGs with P-value > 4. (C and E) qPCR analysis of (C) PPARγ, (D) CEBPα, and (E) Fabp4 in, in vitro differentiated primary preadipocytes with adipogenic differentiation medium containing pyruvate concentrations ranging from 0.02 to 10 mmol/L. (F–H) qPCR analysis of (F) PPARγ, (G) CEBPα,  and (H) Fabp4 in, in vitro differentiated primary preadipocytes with adipogenic differentiation medium containing 4 mmol/L pyruvate, analyzed at four-time points post-adipogenic induction. (I) Oil Red O staining of lipid droplets (stained red) in ASCs during adipogenic differentiation with 4 mmol/L of pyruvate at indicated time points was visualized by microscopy. (J) Oil O Red destaining/elution absorbance was measured at 510 nm and normalized to the undifferentiated cells. (K) Quantification of intracellular TG content. (L) Oil Red O staining of lipid droplets (stained red) in bmMSCs during adipogenic differentiation with 4 mmol/L of pyruvate at indicated time points was visualized by microscopy. (M) Oil O Red destaining/elution absorbance was measured at 510 nm and normalized to the undifferentiated cells. (N) Quantification of intracellular TG content. Data are mean ± SEM; *P < 0.05, **P < 0.01, ***P < 0.001. Scale bar, 100 µm (n = 3).
Figure 2.
Figure 2.
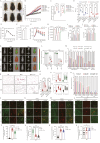
Pyruvate mitigates HFD-induced weight gain and white adipose tissue inflammation. C57BL/6 male mice were fed a high-fat diet (HFD) and chow diet (CD) for 10 weeks ± intervention with 1% pyruvate in drinking water. The experimental groups are mice fed on chow diet (CD), high-fat diet (HFD), HFD receiving pyruvate (HFD + Pyr), and HFD receiving orlistat (HFD + Orlistat). (A) Weight gain in male mice. (B) Abdominal circumference at the end of the experimental period. (C) Comparison between adipose tissue (vWAT and sWAT) weight. (D) Average food consumption per week. (E) Cumulative caloric intake per mouse. (F) Fecal lipid content. (G–H) Serum level of inflammatory cytokines; (G) IL-1β, and (H) IL-6 in indicated experimental groups. (I–L) Representative immunofluorescence microphotographs of vWAT sections from three indicated groups; double stained with (I) F4/80 and iNOS (M1 macrophage). (J) Quantification of co-expression per field for M1 or (K) F4/80 and CD206 (M2 macrophage). (L) Quantification of co-expression per field for M2 macrophages. (M) Quantitative RT-PCR of various genes in vWAT in indicated experimental groups, with the expression of CD-fed mice, normalized against Gapdh, being regarded as 1. (N) Representative microphotographs of hematoxylin-eosin stained vWAT sections from different experimental groups. (O) Histological quantification for crown-like structures (CLS) and (P) comparison of mean adipocyte diameter, using Image J software. (Q and R) In vivo imaging of anesthetized NF-κB-Luc mice fed on HFD and CD for 10 weeks with/without 1% pyruvate in drinking water after 10 weeks. (Q) The figure shows representative bioluminescence images of chow-fed mice with no luciferin injection (CD-NL), chow diet-fed mice with luciferin injection (CD-L), high diet-fed mice with no luciferin injection (HFD-NL), high diet-fed mice with luciferin injection (HFD-L), high diet-fed mice receiving pyruvate with luciferin injection (HFD + Pyr) and high diet-fed mice receiving orlistat with luciferin injection (HFD + Pyr). The heat map depicts a two-dimensional visualization of light emitted ventrally from the mice following luciferin injection. All images were captured 10 min post-substrate administration with a 60-second exposure. Grayscale images were obtained prior to luminescence imaging as a reference. (R) Quantification of in vivo NF-κB activity by measuring bioluminescence from NF-κB-Luc. (S) Dual-energy-X-ray absorptiometry (DXA) scan images for indicated experimental groups. (T) Lean mass and fat mass measurements by DXA for different experimental groups. Data are mean ± SEM; *P < 0.05, **P < 0.01, ***P < 0.001 (n = 6). Scale bar, 100 μm.
Figure 3.
Figure 3.
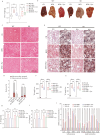
Pyruvate prevented HFD-induced metabolic dysregulation and hepatic steatosis. (A) Fasting blood glucose level comparing different experimental groups. (B) Blood glucose level measured by OGTT after 8 h fasting in the indicated experimental groups. (C) Area under curve (AUC) for panel (B). (D–G) Serum lipid parameters of indicated experimental group (D) triglycerides level (TGs), (E) total cholesterol (TC), (F) low-density lipoprotein cholesterol (LDL) and (G) high-density lipoprotein cholesterol (HDL). (H) Hematoxylin and eosin-stained liver sections representing mice from each experimental group. (I) Quantification of the lipid droplets (steatosis) for each group, (J) weight of liver tissue, (K) hepatic triglyceride level and (L) hepatic total cholesterol level. (M) Quantitative RT-PCR of the mRNA levels of inflammation and lipid metabolism markers in the liver, as indicated. The expression of CD-fed mice, normalized against Gapdh, is regarded as 1. (N–O) Hepatic mRNA expression of inflammatory genes (N) IL-1β and O. IL-6. Data are mean ± SEM; *P < 0.05, **P < 0.01, ***P < 0.001 (n = 6). Scale bar, 100 μm.
Figure 4.
Figure 4.
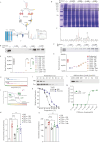
Target identification and validation for the molecular target of pyruvate. (A) Schematic representation of drug affinity responsive target stability (DARTS). (B) Coomassie blue staining of DARTS assay gel. The band with a molecular weight of approximately 80 kDa was protected by pyruvate treatment (indicated in a black box). (C) Mass spectrometry adapted image for PLA2G4A, encoding cPLA2. (D) DARTS followed by immunoblot employing anti-cPLA2 antibody to confirm pyruvate’s binding target. (E) Quantification of panel D showing relative cPLA2 band intensity in with or without pyruvate groups. (F) DARTS followed by immunoblot employing anti-PLEXINB2 antibody to confirm pyruvate’s binding target. (G) Quantification of panel (F) showing relative PLEXINB2 band intensity in with or without pyruvate groups. (H) Schematic representation of CETSA. (I) Schematic representation associated with CETSA outlining the principle. (J) CETSA melt response at indicated temperatures with or without pyruvate using western blot analysis. (K) CETSA associated densitometry analysis curve. (L) Isothermal dose response (ITDR) with serial concentrations of pyruvate at 55°C. (M) ITDR associated curve showing relative soluble fraction using western blot analysis. (N) cPLA2 activity of RAW264.7 cells transfected with cPLA2 expression plasmid, treated with TNFα, ATK, or low (2 mmol/L) and high concentrations (4 mmol/L) of pyruvate. O. Arachidonic acid (AA) levels: BMDMs without or with TNFα in the absence or presence of low (2 mmol/L) and high concentrations (4 mmol/L) of pyruvate for 48 h were examined for AA levels using an ELISA kit. ATK was used as a positive control. Data are mean ± SEM; *P < 0.05, **P < 0.01, ***P < 0.001 (n = 3).
Figure 5.
Figure 5.
cPLA2 is essential for pyruvate’s anti-obesity effects. cPLA2 WT and cPLA2 KO mice were fed a CD or HFD for 16 weeks with or without pyruvate intervention. (A) Gross appearance. (B) Body weights for the indicated periods. (C) Measurement of abdominal circumference. (D) Comparison between adipose tissue (vWAT and sWAT) weight for the indicated groups. (E) Blood glucose level measured by OGTT after 8 h fasting in WT and KO mice fed on CD. (F) Area under curve (AUC) for panel (E). (G) Blood glucose level measured by OGTT after 8 h fasting in the indicated HFD-fed experimental groups. (H) Area under curve (AUC) for panel (G). (I–J) Serum level of inflammatory cytokines; (I) IL-1β and (J) IL-6 in indicated experimental groups. (K) Dual-energy-X-ray absorptiometry (DXA) scan images for indicated experimental groups showing (left to right) x-ray image, bone enhanced image, and color composition image. (L) Body composition measurement by DXA showing lean mass and fat mass for different experimental groups. (M) Quantitative RT-PCR of various target genes for adipogenesis, lipogenesis, and lipolysis in vWAT in indicated experimental groups on HFD with or without pyruvate, with the expression of CD-fed WT and KO mice, normalized with β-actin, being regarded as 1. (N) Representative microphotographs of hematoxylin-eosin stained vWAT sections from different indicted experimental groups showing CLS. (O) Histological quantification for CLS percentage. (P–Q) Comparison of the meaning of (P) adipocyte area and (Q) adipocyte diameter, using Image J software. (R) Quantitative RT-PCR of various target genes for M1 (IL-6, Ccl2, TNFα, and IL-1β) and M2 macrophage markers (Arg1 and Cd206) in vWAT in indicated experimental groups on HFD with or without pyruvate, with the expression of CD-fed WT and KO mice, normalized with β-actin, being regarded as 1. (S–V) Representative immunofluorescence microphotographs of vWAT sections from cPLA2 WT mice from the indicated experimental group; double stained with (S) F4/80 (red) and iNOS (green) (M1 macrophage) (T) Quantification of co-expression per field for M1 macrophages or (U) F4/80 (red) and CD206 (green) (M2 macrophage) (V) Quantification of co-expression per field for M2 macrophages. (W–Z) Representative immunofluorescence microphotographs of vWAT sections from cPLA2 KO mice from the indicated experimental group; double stained with (W) F4/80 (red) and iNOS (green) (M1 macrophage). (X) Quantification of co-expression per field for M1 macrophages or (Y) F4/80 (red) and CD206 (green) (M2 macrophage). (Z) Quantification of co-expression per field for M2 macrophages. Data are mean ± SEM; *P < 0.05, **P < 0.01, ***P < 0.001 (n = 6). Scale bar, 100 μm.
Figure 6.
Figure 6.
Ablation of cPLA2 impairs pyruvate-mediated dyslipidemia amelioration. cPLA2 WT and cPLA2 KO mice were fed a CD or HFD for 16 weeks with or without pyruvate intervention in drinking water for the assessment of the following. (A) Weight of liver tissue. (B) Gross morphologic changes in the liver. (C) Representative micrographs showing microscopic changes by H&E staining on liver sections. (D) Quantification of the lipid droplets (steatosis) for each group in panel (C). (E) Representative micrographs showing Oil Red O staining for liver sections showing lipid accumulation. (F) Hepatic triglyceride level. (G) Hepatic total cholesterol level. (H–I) Hepatic mRNA expression of inflammatory genes (H) IL-1β and (I) IL-6. (J) Quantitative RT-PCR of the mRNA levels of inflammation and lipid metabolism markers in the liver, as indicated. The expression of WT and KO CD-fed mice, normalized against Gapdh, is regarded as 1. Data are mean ± SEM; *P < 0.05, **P < 0.01, ***P < 0.001 (n = 6). Scale bar, 100 μm.
Figure 7.
Figure 7.
Loss of cPLA2 impairs pyruvate-mediated inflammation and adipogenesis in vitro. (A–D) Bone marrow cells from cPLA2 WT and KO mice from different experimental groups differentiated into macrophages. These BMMϕ were treated with TNFα with/without low (2 mmol/L) and high concentrations (4 mmol/L) of pyruvate. (A and B) The mRNA expression of IL-1β and IL-6 was tested by qPCR. (B–D) The secretory level of IL-1β and IL-6 was detected by ELISA. (E) Representative images of Oil Red O (ORO) stained lipid droplets in preadipocytes induced with adipogenic differentiation with or without pyruvate for 8 days, from cPLA2 WT and KO mice. (F) Quantification for adipocyte number in WT and KO groups with or without pyruvate. (G) Lipid accumulation measured by the colorimetric quantification of the ORO release from indicated groups. (H) Microphotographs of lipid droplets of in vitro differentiated preadipocytes for indicated groups stained (green) with fluorescent lipid dye. (I) Droplets were measured and divided into four size groups: 10–20, 20–30, 30–40, and >50 µm. The size and distribution of lipid droplets were measured by Image J software. (J) Expression of PPARγ, C/EBPα, and Fabp4 genes by real-time qRT-PCR in differentiating preadipocyte cells from cPLA2 WT and KO mice, untreated or treated with pyruvate. All values were normalized with respect to β-actin. (K–P) Immunoblot analysis of homogenate from in vitro differentiated preadipocytes on Day 8, for the indicated groups. β-actin was used as a loading control. (K) PPARγ protein level. (L) Quantification of panel (K). (M) C/EBPα protein level. (N) Quantification of panel (M). (O) Fabp4 protein level. (P) Quantification of panel (O).

References

    1. Abbott Mj, Tang T, Sul HS.. The role of phospholipase A(2)-derived mediators in obesity. Drug Discov Today Dis Mech 2010;7:e213–e218. - PMC - PubMed
    1. Avtanski D, Pavlov VA, Tracey KJet al. Characterization of inflammation and insulin resistance in high-fat diet-induced male C57BL/6J mouse model of obesity. Animal Model Exp Med 2019;2:252–258. - PMC - PubMed
    1. Baker RG, Hayden MS, Ghosh S.. NF-κB, inflammation, and metabolic disease. Cell Metab 2011;13:11–22. - PMC - PubMed
    1. Cancello R, Henegar C, Viguerie Net al. Reduction of macrophage infiltration and chemoattractant gene expression changes in white adipose tissue of morbidly obese subjects after surgery-induced weight loss. Diabetes 2005;54:2277–2286. - PubMed
    1. Carlsen H, Haugen F, Zadelaar Set al. Diet-induced obesity increases NF-kappaB signaling in reporter mice. Genes Nutr 2009;4:215–222. - PMC - PubMed