. 2024 Mar 21;20(3):e1012104.
doi: 10.1371/journal.ppat.1012104. eCollection 2024 Mar.

A genome-wide CRISPR screening uncovers that TOB1 acts as a key host factor for FMDV infection via both IFN and EGFR mediated pathways

Affiliations

A genome-wide CRISPR screening uncovers that TOB1 acts as a key host factor for FMDV infection via both IFN and EGFR mediated pathways

Gaochuang Peng et al. PLoS Pathog. .

Abstract

The interaction between foot-and-mouth disease virus (FMDV) and the host is extremely important for virus infection, but there are few researches on it, which is not conducive to vaccine development and FMD control. In this study, we designed a porcine genome-scale CRISPR/Cas9 knockout library containing 93,859 single guide RNAs targeting 16,886 protein-coding genes, 25 long ncRNAs, and 463 microRNAs. Using this library, several previously unreported genes required for FMDV infection are highly enriched post-FMDV selection in IBRS-2 cells. Follow-up studies confirmed the dependency of FMDV on these genes, and we identified a functional role for one of the FMDV-related host genes: TOB1 (Transducer of ERBB2.1). TOB1-knockout significantly inhibits FMDV infection by positively regulating the expression of RIG-I and MDA5. We further found that TOB1-knockout led to more accumulation of mRNA transcripts of transcription factor CEBPA, and thus its protein, which further enhanced transcription of RIG-I and MDA5 genes. In addition, TOB1-knockout was shown to inhibit FMDV adsorption and internalization mediated by EGFR/ERBB2 pathway. Finally, the FMDV lethal challenge on TOB1-knockout mice confirmed that the deletion of TOB1 inhibited FMDV infection in vivo. These results identify TOB1 as a key host factor involved in FMDV infection in pigs.


Conflict of interest statement

The authors have declared that no competing interests exist.

Figures
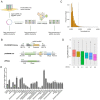
Fig 1
Fig 1. Strategy for identifying essential genes for FMDV infection.
A The process of CRISPR screening for host genes associated with FMDV infection. These designed sgRNA constructs were synthesized as sgRNA oligos, which were subsequently cloned into piggyBac vectors. IBRS-2 cells were transfected with library plasmids to obtain the mutant cell library, subsequently exposing to FMDV infection. B Library plasmids including PB-CRISPR library, piggyBac transposase expression vector pPBase, and doxycycline-induced Cas9 expression vector pCRISPR-S10. C Sequencing result of sgRNAs targeting sequences in plasmid pools libraries. D The post-FMDV infection mutant cell populations containing the whole CRISPR pooled sgRNA library were characterized using next-generation sequencing. (1–1, 1–2, 1–3) and (2–1, 2–2, 2–3) were two independent FMDV infection experiments, with three biological replicates in each group. E Thirty of the candidate gene-knockout monoclonal cell lines were infected with FMDV at 0.1 MOI for 12 h. The FMDV RNA copies were measured by absolute quantitative real-time PCR. Control, the wild-type cells transfected with non-targeting sgRNA. Data shown includes technical replicates from a single experiment and is representative of three independent experiments (E). Data are represented as means ± S.D.; *P < 0.05; **P < 0.01; ***P < 0.001; ns, no significant. P values were determined by two-sided Student’s t-test.
Fig 2
Fig 2. TOB1-knockout significantly inhibits FMDV replication in IBRS-2, PK-15, and iPAM cells.
A Alignment of the nucleic acid sequences of clonal knockout cells of TOB1 with wild-type cells. sgRNA targeting sites are highlighted in red. The red characters “-” indicate the deleted bases in the knockout cells. Protospacer adjacent motif (PAM) sites are indicated in blue. B Protein levels of TOB1 in TOB1-knockout cells were detected by Western blot (left). Western blot results were quantitatively analyzed by image J software (right). C Absolute quantitative real-time PCR for determination of FMDV RNA copies number in TOB1-knockout IBRS-2 and PK-15 cells with FMDV infection at 0.1 MOI for 6, 12, and 24 h. D, E TOB1-knockout IBRS-2 and PK-15 cells were infected with equal amounts of FMDV (MOI of 0.1) for 6, 12, and 24 h, the viral titers were measured by TCID50 assay (D); the expression levels of viral proteins were detected by Western blot (E). KO1 and KO2, two monoclonal cell lines with different knockout types of IBRS-2, PK-15, and iPAM cells. Data shown includes technical replicates from a single experiment and is representative of three independent experiments (C). Data are represented as means ± S.D.; *P < 0.05; **P < 0.01; ***P < 0.001; ns, no significant. P values were determined by two-sided Student’s t-test.
Fig 3
Fig 3. Comparison of RNA-seq results between IBRS-2 control and TOB1-knockout cells.
A Volcano plots of DEGs (FDR<0.05 and log2FC>1) between control and TOB1-knockout IBRS-2 cells. The red dots represent the up-regulated DEGs and the green dots represent the down-regulated DEGs. The black dots indicate no significant difference. DEGs, differentially expressed genes. B Gene ontology (GO) function enrichment analysis of DEGs between control and TOB1-knockout IBRS-2 cells. C KEGG pathway analysis for DEGs between IBRS-2 control and TOB1-knockout cells. The color and the size of the dots represent the fold changes and the number of enriched DEGs, respectively. D A total of 12 DEGs involved in IFN pathway were selected and displayed in the column chart. FPKM, expected number of Fragments Per Kilobase of transcript sequence per Millions base pairs sequenced. Data shown includes technical replicates from a single experiment and is representative of three independent experiments (D). Data are represented as means ± S.D.; *P < 0.05; **P < 0.01; ***P < 0.001; ns, no significant. P values were determined by two-sided Student’s t-test.
Fig 4
Fig 4. ISGs and the phosphorylation levels of STAT1/2 upregulated in TOB1-knockout cells.
A, B The transcriptional levels of ISGs in TOB1-knockout IBRS-2 (A) and PK-15 (B) cells were measured by qPCR. C, D HEK293T cells were transfected with an empty vector, hTOB1-Flag or pTOB1-Flag plasmid (100 ng) (C) and hTOB1-Flag or pTOB1-Flag plasmid (0, 50, 100, or 200 ng) (D), and STAT1/2 promoter-driven luciferase reporter plasmid together with an internal control pRL-TK reporter plasmid for 24 h. Cells were stimulated with IFN-β for another 12 h, and whole-cell lysates were collected for measurements of luciferase activity. E, F The protein and phosphorylation of STAT1/2 in TOB1-knockout IBRS-2 and iPAM cells (left), TOB1-overexpressed cells (middle), and TOB1-knockout cells with TOB1 plasmid rescued (right) were detected by Western blot at 0 min, 15 min, 30 min and 60 min treated with IFN-β. EV, transfected with empty vector; Mock, transfected with empty vector and treated with IFN-β; hTOB1, human TOB1 expressing plasmid; pTOB1, pig TOB1 expressing plasmid. Data shown includes technical replicates from a single experiment and is representative of two independent experiments (A, B, C, D). Data are represented as means ± S.D.; *P < 0.05; **P < 0.01; ***P < 0.001; ns, no significant. P values were determined by two-sided Student’s t-test.
Fig 5
Fig 5. TOB1-knockout potentiated the expression of RIG-I and MDA5.
A IBRS-2 and PK-15 control cells and TOB1-knockout cells were transfected with poly(I:C) for 12 h. The transcriptional levels of IFNA, IFNB, and ISG15 were measured by qPCR, respectively. B The key nodal molecules including RIG-I, MDA5, and JAK-STAT pathway were detected by Western blot, under either poly(I:C) or IFN-β-stimulated in TOB1-knockout IBRS-2 cells. C TOB1-knockout PK-15 and iPAM cells were transfected with poly(I:C) for 12 h. The protein level of RIG-I was measured by Western blot. D, E IBRS-2 and PK-15 control cells and TOB1-knockout cells were transfected with poly(I:C) for 0 h, 6 h, and 12 h. The mRNA level of RIG-I and MDA5 (D), CEBPA and CEBPB (E) were measured by qPCR. F, G IBRS-2 control cells and TOB1-knockout cells were transfected with pRK-CEBPA-HA or pRK-HA plasmid (F), si-CEBPA or si-NC (G) for 24 h. The mRNA level of RIG-I and MDA5 were measured by qPCR. H The binding of TOB1 to CEBPA mRNA was detected by RNA immunoprecipitation assay. The RNA obtained from RNA immunoprecipitation was reverse transcribed and subjected to PCR amplification and detected by agarose gel electrophoresis (left), and the enrichment efficiency of different genes is detected by qPCR (right). I The mRNA levels of CEBPA were examined with adding Actinomycin D for 0, 4, 8, 12, 16, 20, 24 h by qPCR in IBRS-2 and PK-15 control cells and TOB1-knockout cells. CEBPA/B, CCAAT enhancer binding protein alpha/beta; si-NC, si-negative control; CDK2, cyclin dependent kinase 2. Data shown includes technical replicates from a single experiment and is representative of three independent experiments (A, D, E). Data are represented as means ± S.D.; *P < 0.05; **P < 0.01; ***P < 0.001; ns, no significant. P values were determined by two-sided Student’s t-test.
Fig 6
Fig 6. TOB1-knockout inhibits FMDV entry by inhibiting EGFR pathway.
A IBRS-2 Control and TOB1-knockout IBRS-2 cells were infected with FMDV for 1 h at 4°C (left) or 30 min at 37°C (right). The FMDV RNA copies number were detected by absolute quantitative real-time PCR. NC (left panel), FMDV was incubated with neutralizing antibodies and was then used to infect cells. FMDV positive serum was provided by the Foot-and-Mouth Disease Reference Laboratory. NC (right panel), cells were infected by FMDV after Chlorpromazine (CPZ)-treatment. B PK-15 control and TOB1-knockout cells were infected with FMDV (MOI of 0.1, 1 and 10) for 1 h at 4°C (left) or 30 min at 37°C (right). The replication levels of FMDV were quantified by qPCR. C TOB1-knockout cells and control cells were infected with FMDV (MOI of 10) for 30 min at 37°C. The samples were subjected to immunofluorescence using anti-VP1 antibody. D IBRS-2 and PK-15 control cells were treated with EGFR/ERBB2 tyrosine kinase domain inhibitor (Lapatinib) or DMSO at 0.03, 0.3, 3, 30, 300 μM for 24 h. Then, cells were infected with FMDV for 12 h at 0.01 MOI. The FMDV RNA copies number were detected by absolute quantitative real-time PCR. PC, positive control. Mock, uninfected group. L, Lapatinib. D, DMSO. E IBRS-2 and PK-15 control cells were treated with EGFR specific inhibitors (Erlotinib and Gefitinib) or DMSO at 0, 2, 5, 10 μM for 24 h. Then, cells were infected with FMDV for 12 h at 0.01 MOI. The replication levels of FMDV were measured by qPCR. F IBRS-2 and PK-15 control cells were treated with EGFR specific inhibitors (Erlotinib and Gefitinib) at 10 μM for 24 h. Then, cells were infected with FMDV for 1 h at 4°C (the first and third sub-panels of Fig 6F) or 30 min at 37°C (the second and fourth sub-panels of Fig 6F). Absolute quantitative real-time PCR was performed to detect the FMDV RNA copy numbers. G IBRS-2 and PK-15 control cells, EGFR and ERBB2-knockout cells were infected with FMDV for 30 min at 37°C. Absolute quantitative real-time PCR was performed to detect the FMDV RNA copies number. H IBRS-2 control and TOB1-knockout cells were treated with EGF for 0, 5, 10, 30, 45, and 60 min at 10 μM (up) and PK-15 control and TOB1-knockout cells were treated with EGF for 0, 10 min, 30 min, 1 h, 1.5 h, and 2 h at 10 μM (down). Western blot was performed using anti-EGFR, anti-pEGFR, anti-AKT, and anti-pAKT antibodies. I Control and TOB1-knockout IBRS-2 cells were infected with FMDV at 0.1 MOI for 0–2 h. The samples were subjected to Western blot for EGFR pathway expression and activation. J HEK293T cells were co-transfected with pPB-EF1α-TOB1-Flag and pRK-EGFR-HA or pRK-ERBB2-HA. The interactions of TOB1 and EGFR or ERBB2 were examined using co-immunoprecipitation. K HEK293T cells were co-transfected with pRK-EGFR-HA and VP1, VP2, or VP3. The interactions of EGFR and FMDV viral proteins were examined using Co-immunoprecipitation. Data shown includes technical replicates from a single experiment and is representative of three independent experiments (A, E, F, G). Data are represented as means ± S.D.; *P < 0.05; **P < 0.01; ***P < 0.001; ns, no significant. P values were determined by two-sided Student’s t-test.
Fig 7
Fig 7. TOB1 deletion prevents FMDV infection in vivo.
A Knockout schematic representation position of the sequence for TOB1 in TOB1-/- mice. The mouse genome of TOB1 contained two exons. CRISPR/Cas9 technology was used to design a targeted vector to exon 2. B Expression and protein levels of TOB1 in TOB1-/- and TOB1+/+ mice were detected by PCR amplification and Western blot to determine TOB1 knockout efficiency. C Three-day-old TOB1-/- and TOB1+/+ (n = 6 in each group) suckling mice were used and divided into three groups. One group was subcutaneously injected with equal amounts of PBS, and the other two groups were injected subcutaneously with two concentrations of FMDV (7×10³ and 7×10⁴ PFU). The survival rate was monitored every 24 h. One of the TOB1+/+ mice group was died before injected with 7×10³ PFU FMDV. D Three-day-old TOB1-/- and TOB1+/+ (n = 4 in each group) mice were used and subcutaneously injected with equal amounts of PBS and FMDV (7×10⁴ PFU) and euthanized at 72 h after FMDV infection. Samples from FMDV-infected mouse were detected by absolute quantitative real-time PCR individually. E The lung tissue in TOB1-/- and TOB1+/+ mice injected with equal amounts of PBS and FMDV (7×10⁴ PFU) and euthanized at 72 h after FMDV infection were subjected to HE staining. F The MLF cells from TOB1-/- and TOB1+/+ mice were infected with FMDV of 0.1 MOI for 12 and 24 h. The FMDV RNA copies were measured by absolute quantitative real-time PCR. G The expression of CEBPA, CEBPB, RIG-I, IFNB, ISG15, and ISG56 were detected by qPCR in the MLF cells from TOB1-/- and TOB1+/+ mice. H The MLF cells from TOB1-/- and TOB1+/+ mice were infected with FMDV of 0.1 MOI for 0, 10 min, 30 min, 1 h, 1.5 h, and 2 h. The samples were subjected to Western blot for EGFR pathway expression and activation. Data shown includes technical replicates from a single experiment and is representative of three independent experiments (D, F, G). Data are represented as means ± S.D.; *P < 0.05; **P < 0.01; ***P < 0.001; ns, no significant. P values were determined by two-sided Student’s t-test.

Similar articles

Cited by

References

    1. Jamal SM, Belsham GJ. Foot-and-mouth disease: past, present and future. Vet Res. 2013; 44(1):116. doi: 10.1186/1297-9716-44-116 - DOI - PMC - PubMed
    1. Kitching RP, Alexandersen S. Clinical variation in foot and mouth disease: pigs. Rev Sci Tech. 2002; 21(3):513–8. doi: 10.20506/rst.21.3.1367 - DOI - PubMed
    1. Kitching RP. Clinical variation in foot and mouth disease: cattle. Rev Sci Tech. 2002; 21(3):499–504. doi: 10.20506/rst.21.3.1343 - DOI - PubMed
    1. Pinto AA. Foot-and-mouth disease in tropical wildlife. Ann N Y Acad Sci. 2004; 1026:65–72. doi: 10.1196/annals.1307.008 - DOI - PubMed
    1. Brito BP, Rodriguez LL, Hammond JM, Pinto J, Perez AM. Review of the Global Distribution of Foot-and-Mouth Disease Virus from 2007 to 2014. Transbound Emerg Dis. 2017; 64(2):316–332. doi: 10.1111/tbed.12373 - DOI - PubMed