. 2024 Mar 22;383(6689):1374-1379.
doi: 10.1126/science.adk6921. Epub 2024 Mar 21.

Determination of single-molecule loading rate during mechanotransduction in cell adhesion

Affiliations

Determination of single-molecule loading rate during mechanotransduction in cell adhesion

Myung Hyun Jo et al. Science. .

Abstract

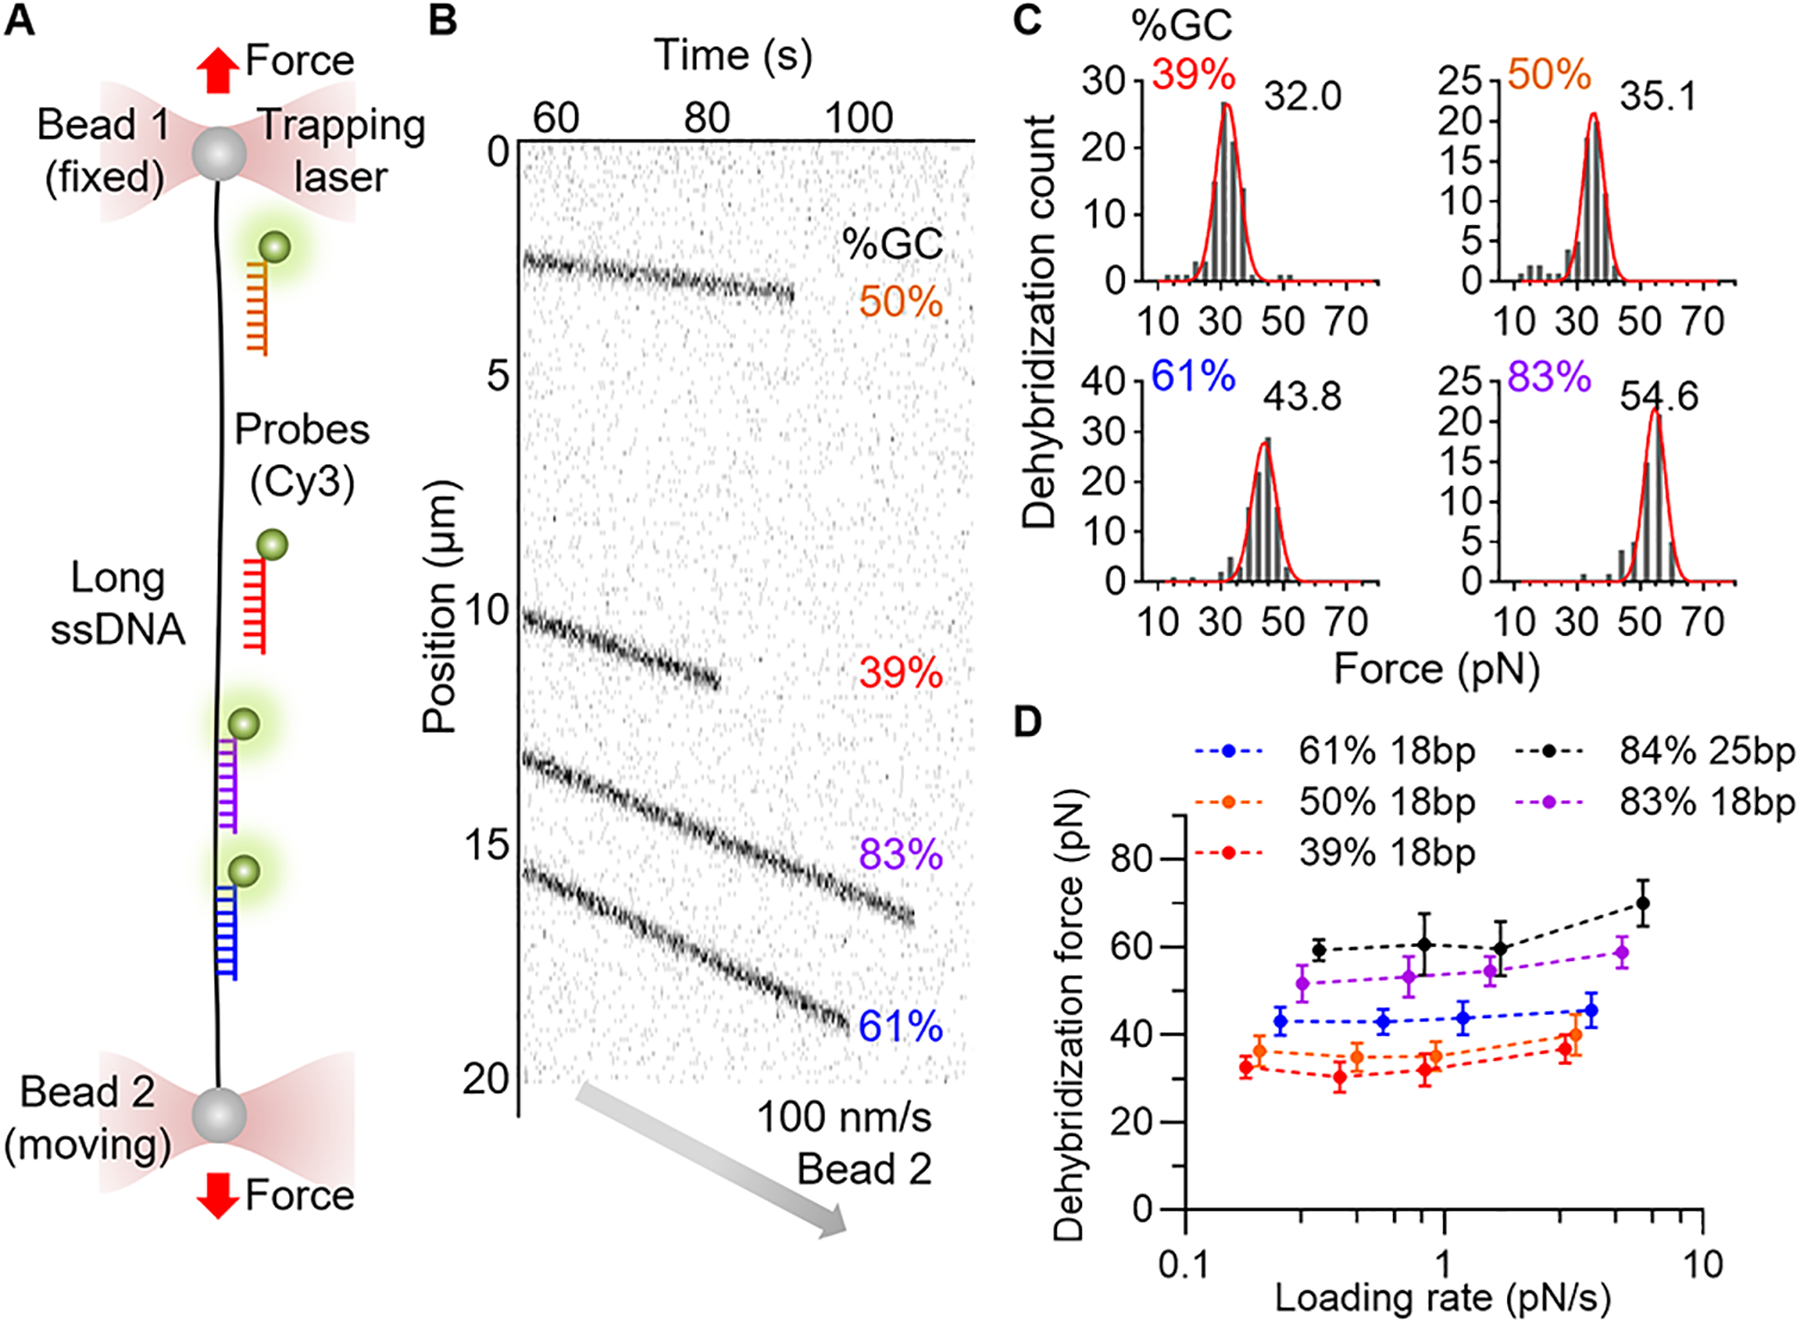
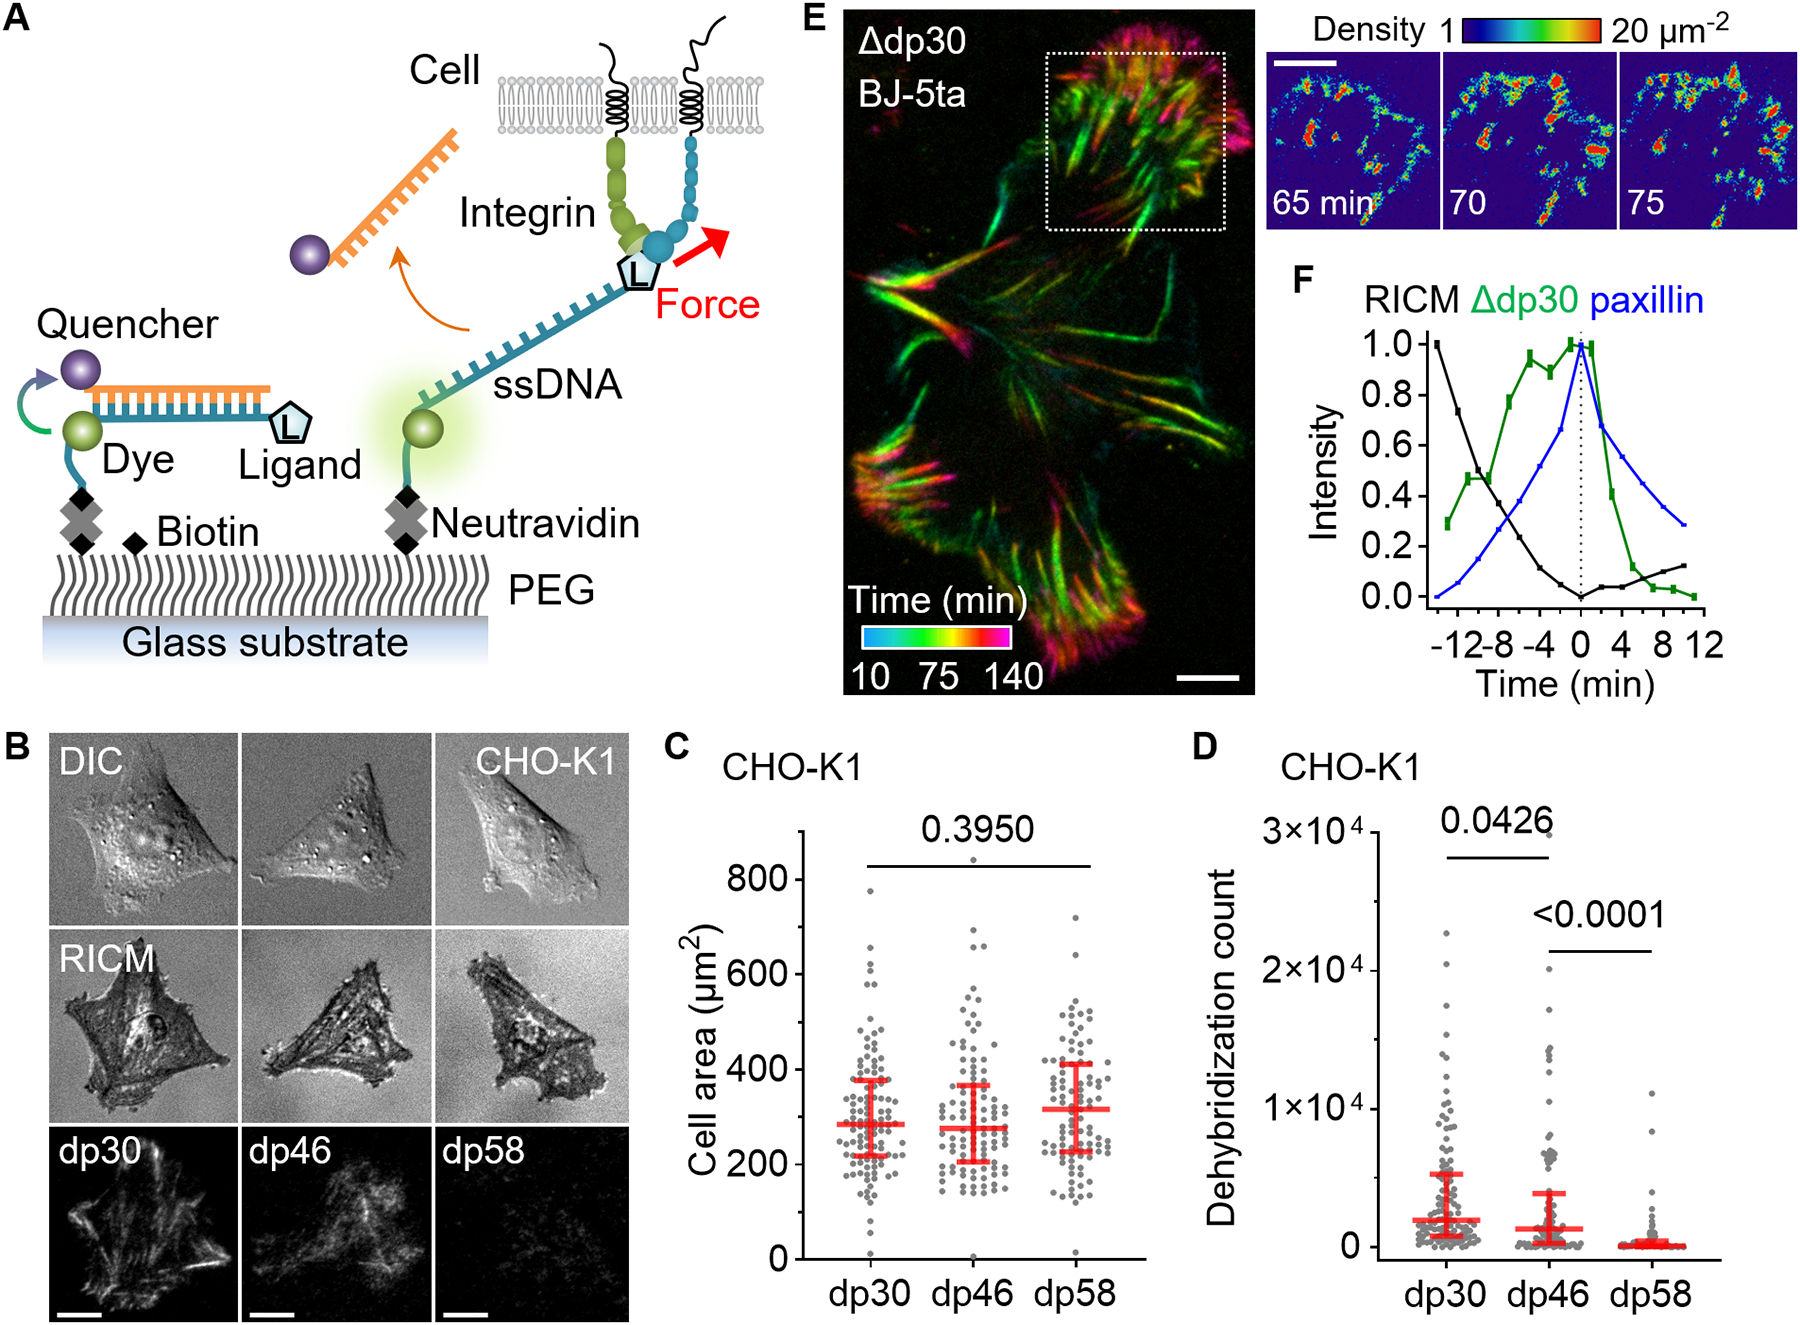
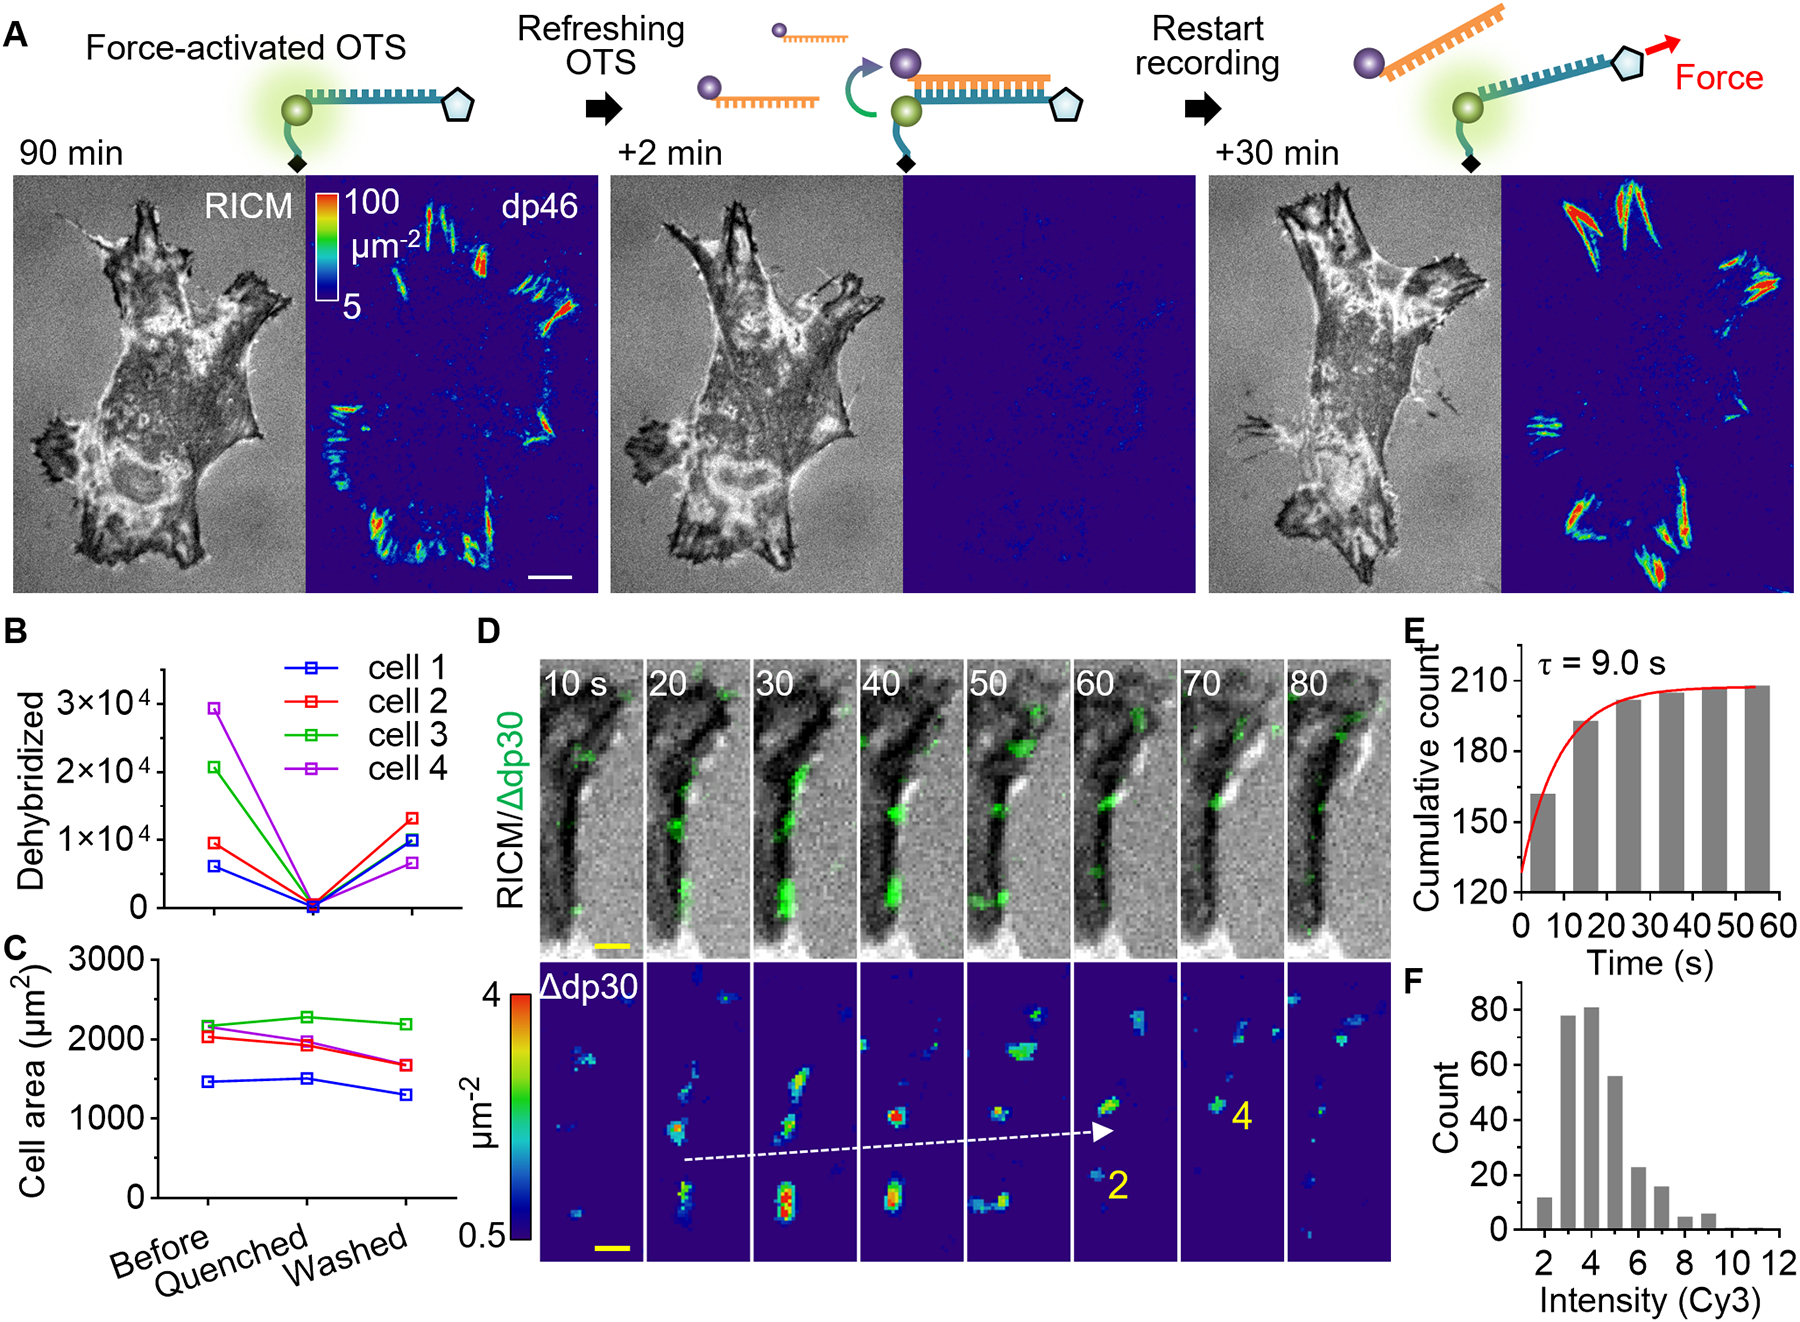
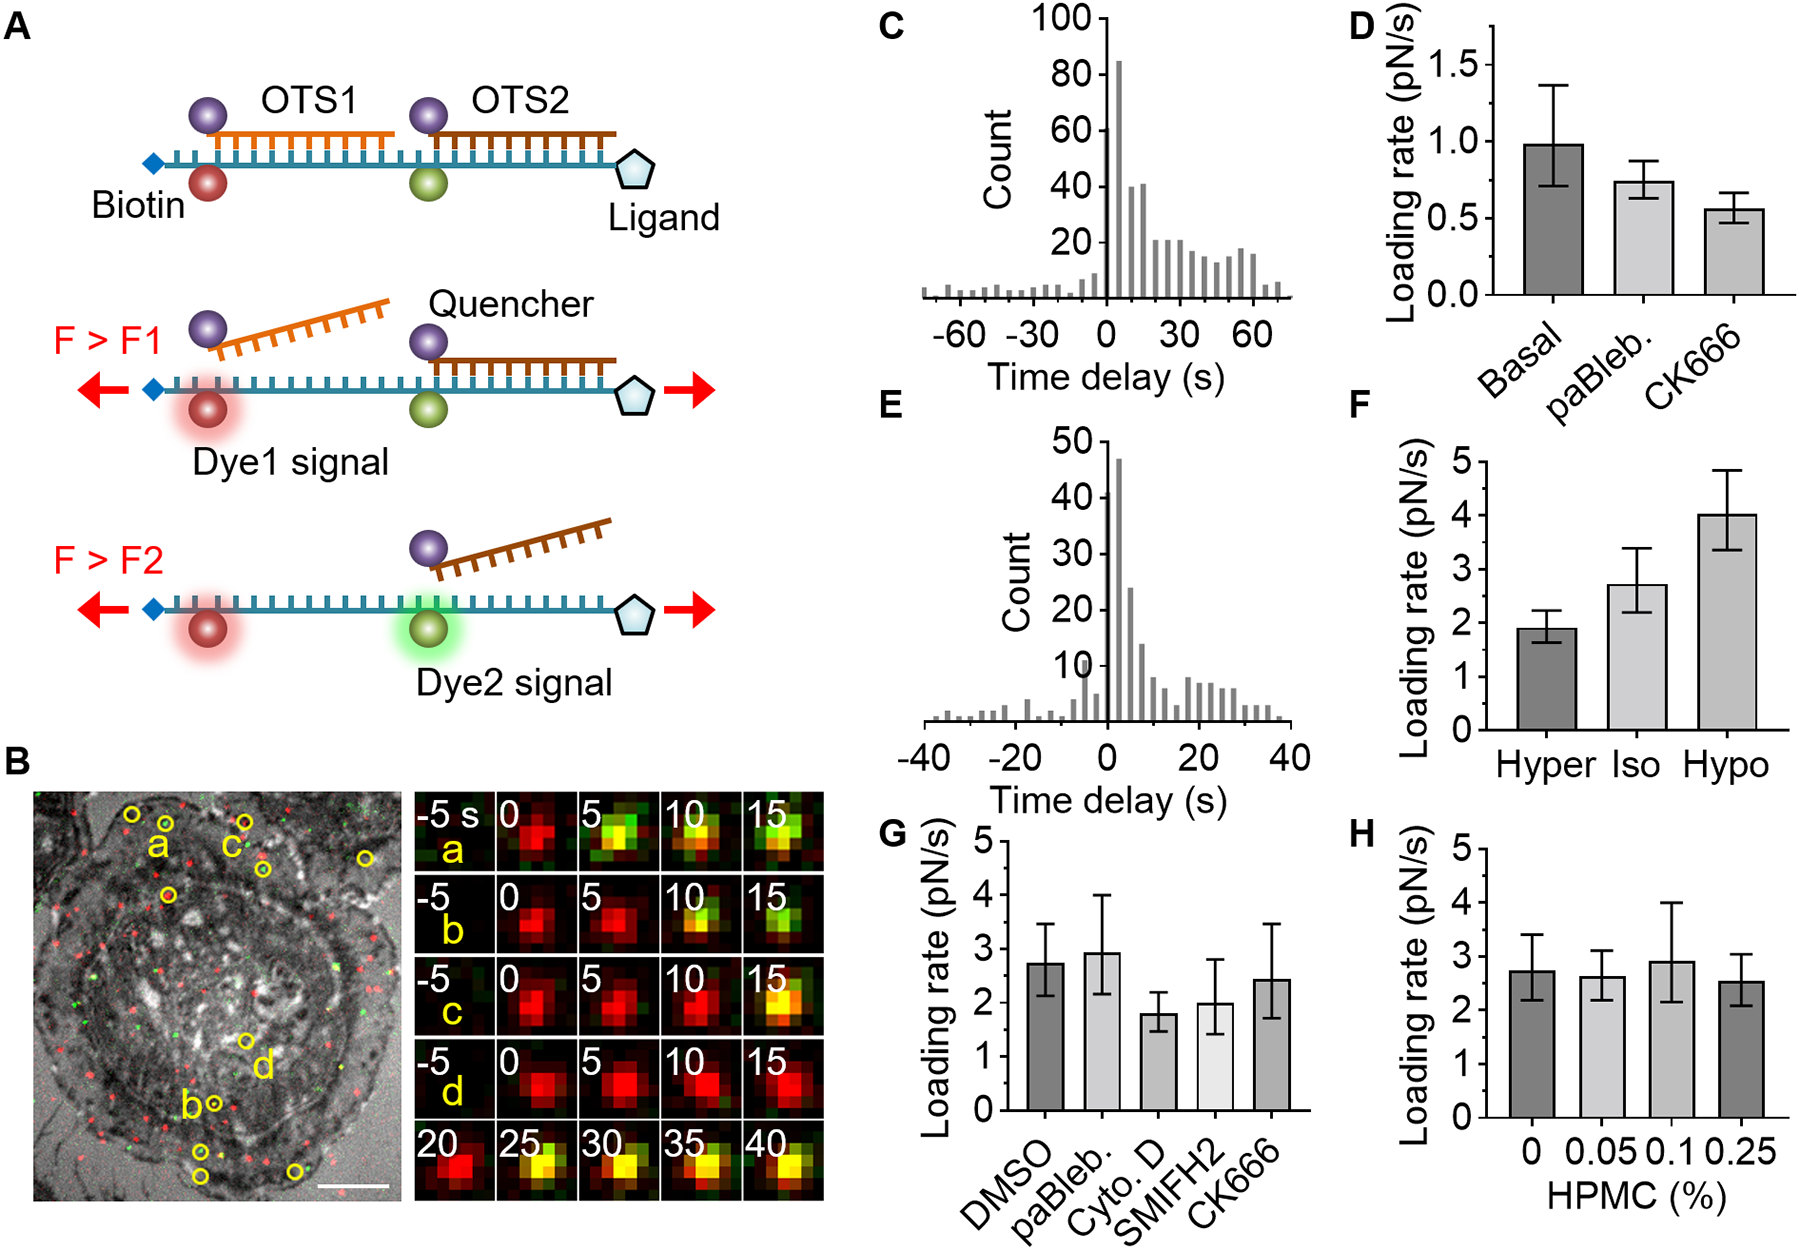
Cells connect with their environment through surface receptors and use physical tension in receptor-ligand bonds for various cellular processes. Single-molecule techniques have revealed bond strength by measuring "rupture force," but it has long been recognized that rupture force is dependent on loading rate-how quickly force is ramped up. Thus, the physiological loading rate needs to be measured to reveal the mechanical strength of individual bonds in their functional context. We have developed an overstretching tension sensor (OTS) to allow more accurate force measurement in physiological conditions with single-molecule detection sensitivity even in mechanically active regions. We used serially connected OTSs to show that the integrin loading rate ranged from 0.5 to 4 piconewtons per second and was about three times higher in leukocytes than in epithelial cells.


Conflict of interest statement

Competing interests: Olivia Yang is currently employed by LUMICKS. All other authors declare no competing interests.

Figures

Fig. 1.
Fig. 1.. Stretching Force-Induced Oligonucleotide Dehybridization.
Oligonucleotide dehybridization force was measured using optical tweezers. (A) Schematic of experimental setup. Fluorescently labeled oligonucleotides on a long ssDNA captured and stretched by optical tweezers. (B) Kymograph of four DNA oligonucleotides (18 bp, Cy3) on a ssDNA being stretched at a speed of 100 nm/s. The disappearance of fluorescent signals indicates dehybridization. (C) Distributions of dehybridization force (100 nm/s, RT). Gaussian fitting (red line) result is indicated. N = 89, 67, 96, and 52 obtained from seven or more different ssDNA. (D) Loading rate dependent dehybridization force. Dehybridization force of five DNA oligonucleotides was measured using four different stretching speeds (20, 50, 100, and 300 nm/s). The loading rates corresponding to the applied force were calculated using force-extension data and stretching speed (fig. S1). Data are mean±SD.
Fig. 2.
Fig. 2.. Overstretch tension sensor.
Single-molecular force sensors were created based on force-induced oligonucleotide dehybridization. (A) Schematic of force detection using OTS. (B) Images of epithelial-like CHO-K1 cells seeded (2 hours) on densely immobilized (~1000 μm−2) dp30, dp46, and dp58 conjugated with a cRGDfK ligand. (C) CHO-K1 cell area on the three OTS coated surfaces. N = 112, 109, and 99 cells from three independent experiments. (D) The count of dehybridized OTS per cell. The red lines are median and interquartile range. P-values are from the Kruskal-Wallis test. (E) BJ-5ta fibroblast force-activated dp30 signal is temporally resolved at 5 min intervals. The density of force events quantified by measuring single Cy3 signals. (F) Temporal relation between RICM, dp30 signal increase, and paxillin-GFP signals. Pixel-wise signal traces were aligned to the peak of GFP signal and averaged (2830 pixels; mean±SE). BJ-5ta fibroblast spreading was monitored at 2 min time intervals. Scale bars, 10 μm.
Fig. 3.
Fig. 3.. OTS refreshing.
Refreshment of forced-activated OTS maintains the high detection sensitivity and reveals integrin subclusters within focal adhesions. (A) Quencher strands were injected (1 uM, 500 uL/min) into the imaging chamber to erase dp46 signals force-activated by fibroblasts. The force recording was resumed by washing out the quencher strands. (B) The total dp30 signal per cell in each step. N = 4 cells. (C) Cell area in each step. (D) Force detection within a mature focal adhesion on refreshed dp30 surface. The time resolved force signals (dp30 signal increase or Δdp30) are overlaid on the RICM images (top panel) and the intensity-calibrated images are shown after median filtering (bottom panel). The force transmission count for each frame is shown in yellow text for two spots. (E) The lifetime of force signal spots. Single-exponential fitting of the cumulative count was shown. (F) Fluorescence intensity histogram of individual spot normalized to single Cy3 signal. White scale bars, 10 μm. yellow scale bar, 2 μm.
Fig. 4.
Fig. 4.. Cellular force loading rate measurement using serially connected OTS.
A serially connected OTS detects two levels of force, enabling loading rate measurement. (A) Schematic of two-level force detection using OTS. (B-D) RGD-binding integrin force in epithelial cells (U2-OS). The ligand used is cRGDfK. (B) Two OTS signals (red for dp16-Atto647N and green for dp30-Cy3) are overlaid on the ventral surface image (RICM). Colocalized signals were marked in yellow circles (Atto647N and Cy3). Time-lapse images of the spots are shown. Scale bars, 10 μm. (C) Histogram of time delay between dp16 and dp30 signals (5 s interval). (D) Effect of cytoskeletal inhibitors on loading rate in U2-OS cells: para-amino-Blebbistatin (10 μM) or CK666 (50 μM). (E-H) Integrin α4β1 force in monocyte (THP-1) was measured using LDVP. (E) Histogram of measured time delay in basal condition (2.5 s interval). (F) Loading rate in a hypertonic, isotonic, or hypotonic medium. (G) Loading rate with DMSO (0.02%) or a cytoskeletal inhibitor: para-amino-Blebbistatin (10 μM), Cytochalasin D (0.5 μM), SMIFH2 (1 μM), or CK666 (10 μM). (H) Viscosity effect on loading rate. Hydroxypropyl methylcellulose was added. Data is combined from three independent experiments. Data and error bars indicate the result of single-exponential fitting and 90% confidence intervals (D, F-H). See fig. S7 for additional information.

References

    1. Engler AJ, Sen S, Sweeney HL, Discher DE, Matrix Elasticity Directs Stem Cell Lineage Specification. Cell 126, 677–689 (2006). - PubMed
    1. Levental KR, Yu H, Kass L, Lakins JN, Egeblad M, Erler JT, Fong SFT, Csiszar K, Giaccia A, Weninger W, Yamauchi M, Gasser DL, Weaver VM, Matrix Crosslinking Forces Tumor Progression by Enhancing Integrin Signaling. Cell 139, 891–906 (2009). - PMC - PubMed
    1. Sun Z, Guo SS, Fässler R, Fassler R, Integrin-mediated mechanotransduction. Journal of Cell Biology 215, 445–456 (2016). - PMC - PubMed
    1. Florin E-L, Moy VT, Gaub HE, Adhesion Forces Between Individual Ligand-Receptor Pairs. Science (1979) 264, 415–417 (1994). - PubMed
    1. Evans E, Ritchie K, Dynamic strength of molecular adhesion bonds. Biophys J 72, 1541–1555 (1997). - PMC - PubMed

Publication types